![]()
MIRA
INFORM REPORT
|
Report Date : |
01.07.2008 |
IDENTIFICATION
DETAILS
|
Name : |
METALPERFIL S.A. |
|
|
|
|
Registered Office : |
Camino Pg
Sarral Cm Barbara, S/N, Cp 43424, Sarral Tarragona |
|
|
|
|
Country : |
Spain |
|
|
|
|
Financials (as on) : |
31.12.2006 |
|
|
|
|
Date of Incorporation : |
|
|
|
|
|
Legal Form : |
Sociedad Anonima |
|
|
|
|
Line of Business : |
RATING &
COMMENTS
|
MIRA’s Rating : |
Ba |
|
RATING |
STATUS |
PROPOSED CREDIT LINE |
|
|
41-55 |
Ba |
Overall operation is considered normal. Capable to meet normal
commitments. |
Satisfactory |
|
Maximum Credit Limit : |
249.996,99 € |
|
|
|
|
Status : |
Satisfactory |
|
|
|
|
Payment Behaviour : |
Regular |
|
|
|
|
Litigation : |
Exists |
FINANCIAL
REPORT
METALPERFIL S.A.
TAX NUMBER: A62273701
EXECUTIVE SUMMARY
Identification
Current Business Name: METALPERFIL S.A.
Other names: YES
Current Address: CAMINO PG
SARRAL CM BARBARA, S/N, CP 43424, SARRAL TARRAGONA
Telephone number: 902454648 Fax: 902454649
Corporate e-mail: administracion@metalperfil.com
Commercial Risk
Credit Appraisal: 249.996,99 €
Legal Actions: YES
Financial Information
Latest Balance sheet sales (2006): 17.828.098,26 € (Registro Mercantil)
Result: 1.085.666,38 €
Total Assets:
10.417.311,87 €
Social Capital: 900.000,00 €
Employees: 30
Commercial Information
Constitution Date: 10/05/2000
Business activity: Iron &
steel industry
NACE Code: 2710
International Operations: No business relationships registered
Corporate Structure
Presidente:
Parent Company:
Other Complementary Information
Latest proceeding published in BORME: 29/02/2008 Revocaciones
Latest press article: 18/09/2006 EXPANSIÓN
DE VALENCIA (INFORMACIÓN SUCURSALES)
Bank Entities: Yes
Credit Appraisal
Maximum Credit (from 0 a 6,000,000 €):
249.996,99 €
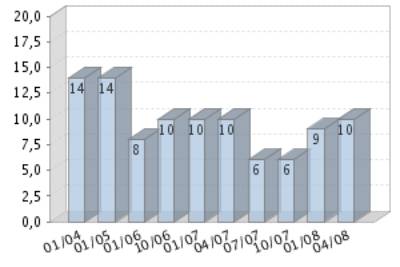
Rating Evolution
Financial Situation
Fiscal year2006
|
Treasury |
Excelente |
|
Indebtedness |
Medio |
|
Profitability |
Suficiente |
|
Balance |
Excelente |
Performance
|
Legal Actions |
Significativas |
|
Business
Trajectory |
Con reservas |
INCIDENTS

Summary
LEGAL ACTIONS: No legal incidences registered
|
CLAIM FILED
AGAINST THE ADMINISTRATION: 5 ( First: 13/05/2004, last:
23/04/2007 )With the Social Security: |
0 |
|
With the Tax
Authorities: |
0 |
|
With Other
Official bodies: |
5 |
AFFECTED BY:
1 Company / Companies in Insolvency Proceedings.
Last claim filed against the administration
Figures expressed in €
WITH OTHER OFFICIAL BODIES
5 claim(s)
Seizures
|
DATE |
ORGANIZATION |
AMOUNT |
|
23/04/2007 |
AYUNTAMIENTO DE BARCELONA |
|
|
12/12/2005 |
AYUNTAMIENTO DE BARCELONA |
|
|
26/10/2005 |
AYUNTAMIENTO DE BARCELONA |
|
Notifications
|
DATE |
ORGANIZATION |
AMOUNT |
|
13/05/2004 |
CONSEJERÍA DE INFRAESTRUCTURAS Y TRANSPORTE |
300,00 |
FINANCIAL ELEMENTS AND SECTORIAL
COMPARATIVE
FINANCIAL ELEMENTS
Figures given in €
|
|
2004 (12) |
2005 (12) |
2006 (12) |
% ASSETS |
|
|
|
|
|
|
BALANCE SHEET
ANALYSIS |
|
|
|
|
|
|
|
|
|
|
OWN FUNDS |
1.150.120,38 |
1.455.949,96 |
2.541.616,34 |
24,40 |
|
|
|
|
|
|
DEBT |
5.462.985,83 |
6.959.389,38 |
7.875.695,53 |
75,60 |
|
|
|
|
|
|
FIXED ASSETS |
1.663.377,87 |
2.201.229,75 |
3.074.502,28 |
29,51 |
|
|
|
|
|
|
TOTAL ASSETS |
6.613.106,21 |
8.415.339,34 |
10.417.311,87 |
|
|
|
|
|
|
|
|
|
|
|
|
|
|
|
|
|
|
|
2004 (12) |
2005 (12) |
2006 (12) |
% SALES |
|
|
|
|
|
|
PROFIT AND LOSS
ACCOUNT ANALYSIS |
|
|
|
|
|
|
|
|
|
|
SALES |
11.501.277,35 |
13.896.619,84 |
17.828.098,26 |
|
|
|
|
|
|
|
ADDED VALUE |
1.432.068,23 |
1.574.180,60 |
3.096.798,89 |
17,37 |
|
|
|
|
|
|
EBITDA |
874.829,75 |
826.984,95 |
2.151.797,92 |
12,07 |
|
|
|
|
|
|
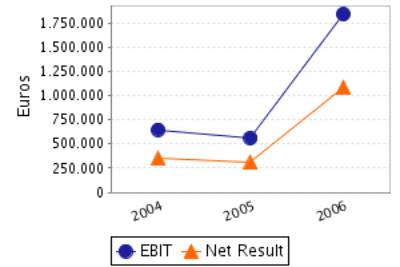
EBIT |
648.846,84 |
562.332,87 |
1.838.200,54 |
10,31 |
|
|
|
|
|
|
NET RESULT |
346.381,99 |
305.829,58 |
1.085.666,38 |
6,09 |
|
|
|
|
|
Balance Sheets Items Analysis
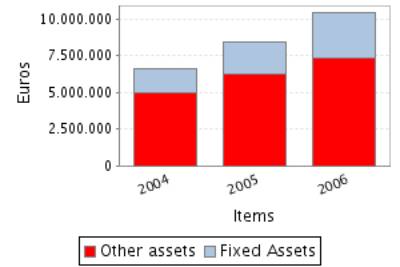
Balance Sheet
Comments
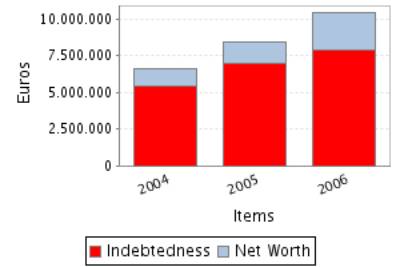
Total assets of the company grew 27,25% between 2004 and 2005.
This growth is a consequence of the fixed assets increase of 32,33%.
This growth has been mainly financed with a debt increase of 27,39%.
Nevertheless the net worth increased 26,59%.
Total assets of the company grew 23,79% between 2005 and 2006.
This growth is a consequence of the fixed assets increase of 39,67%.
This growth has been financed, on a wider scale, with a Shareholders’
equity increase of 74,57% and in a smaller proportion with an debt increase of
13,17%.
Profit and Loss Account Analysis
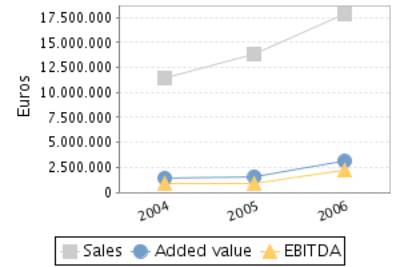
Profit and Loss Account
Comments
The company’s sales figure grew 20,83% between 2004 and 2005.
The company’s EBIT decreased in 13,33% between 2004 and 2005.
This evolution implies a reduction in the company’s operating
profitability.
The result of these variations is a decrease of the company’s Economic
Profitability of 31,89% in the analysed period, being this profitability of
6,68% in the year 2005.
The company’s Net Result decreased in 11,71% between 2004 and 2005.
This evolution, compared to the EBIT’s performance, implies that the
financial and extraordinary activities have had a positive effect in the
company’s Financial Profitability.
The result of these variations is a reduction of the company’s
profitability of 30,25% in the analysed period, being equal to 21,01% in the
year 2005.
The company’s sales figure grew 28,29% between 2005 and 2006.
The company’s EBIT grew 226,89% between 2005 and 2006.
This evolution implies an increase in the company’s operating
profitability.
The result of these variations is an increase of the company’s Economic
Profitability of 164,07% in the analysed period, being this profitability of
17,65% in the year 2006.
The company’s Net Result grew 254,99% between 2005 and 2006.
This evolution, compared to the EBIT’s performance, implies that the financial
and extraordinary activities have had a positive effect in the company’s
Financial Profitability.
The result of these variations is an increase of the company’s Economic
Profitability of 103,35% in the analysed period, being equal to 42,72% in the
year 2006.
ANNUAL FINANCIAL REPORT
ADDITIONAL DATA
Source: annual financial report 2006
Results Distribution
Figures given in €
|
DISTRIBUTION
BASE |
DISTRIBUTION TO |
||
|
Profit and Loss |
1.085.666,38 |
Retained earnings |
108.566,64 |
|
Carry Over |
0,00 |
Voluntary Reserve |
977.099,74 |
|
Voluntary reserves |
0,00 |
Prior years losses |
0,00 |
|
Reserves |
0,00 |
Carry Over |
0,00 |
|
Other concepts |
0,00 |
Other funds |
0,00 |
|
Total of Amounts to be distributed |
1.085.666,38 |
Dividends |
0,00 |
|
|
|
Other Applications |
0,00 |
Auditing
Auditors’ opinion: FAVORABLE
Auditor: CUSPIDE AUDITORES S.L.
COMPARATIVE SECTOR ANALYSIS
Values table
Figures expressed in %
|
|
COMPANY (2006) |
SECTOR |
DIFFERENCE |
DIFFERENCE RELATIVE |
|
|
|
|
|
|
BALANCE SHEET ANALYSIS: % on the total
assets |
|
|
|
|
|
|
|
|
|
|
OWN FUNDS |
24,40 |
41,45 |
-17,05 |
-41,14 |
|
|
|
|
|
|
DEBT |
75,60 |
58,55 |
17,05 |
29,13 |
|
|
|
|
|
|
FIXED ASSETS |
29,51 |
39,38 |
-9,87 |
-25,06 |
|
|
|
|
|
|
|
|
|
|
|
|
|
|
|
|
|
|
COMPANY (2006) |
SECTOR |
DIFFERENCE |
DIFFERENCE RELATIVE |
|
|
|
|
|
|
PROFIT AND LOSS
ACCOUNT ANALYSIS: % on the total operating income |
|
|
|
|
|
|
|
|
|
|
SALES |
99,97 |
99,78 |
0,19 |
0,19 |
|
|
|
|
|
|
ADDED VALUE |
17,37 |
21,60 |
-4,23 |
-19,60 |
|
|
|
|
|
|
EBIT |
10,31 |
2,98 |
7,33 |
246,49 |
|
|
|
|
|
|
NET RESULT |
6,09 |
1,68 |
4,41 |
262,82 |
|
|
|
|
|
Sector Composition
Compared sector (NACE): 271
Number of companies: 10
Size (Sales Figure) : 7.000.000,00 - 40.000.000,00 Euros
Comments on the
sectorial comparative
Compared to its sector the assets of the companies show an inferior
proportion of fixed assets. Specifically the difference with the sector average
is -9,87% , which means a relative difference of -25,06% .
In liabilities composition the company appeals on a wider scale to self
financing, being the proportion of net worth of 17,05% inferior, which means a
relative difference of 41,14% 17,05% more than the sector, which means a
difference of 29,13% .
The proportion that the sales mean to the company’s total ordinary
income is 99,97%, 0,19% higher than in the sector, which means a relative
difference of 0,19% .
The company’s EBIT was positive and was 10,31% with regard to the total
ordinary income, 7,33% higher than in the sector, which means a relative
difference of 246,49% .
The company’s capacity to generate operating income is higher than the
one of the sector as its ratio EBIT/Sales is higher (ES Company versus ES
Sector).
The company’s net result was positive and equal to 6,09% with regard to
the total ordinary income, 4,41% higher than in the sector, which means a relative
difference of 262,82% .
The financial and extraordinary results and the tax impact have had a
less negative impact on the Net result in the company than in the sector; as a
consequence, the company shows a better Net Result/EBIT ratio (REBEmpresa vs. REBSector).
ADDRESSES
Current Legal Seat Address:
CAMINO PG SARRAL CM BARBARA, S/N
43424 SARRAL TARRAGONA
Previous Seat Address:
CALLE SANCHO DE AVILA, 52
08018
BARCELONA
Characteristics of
the current address
Type of premises: local
Property: atribuido en propiedad sin confirmación
oficial
Local Situation: principal
CORPORATE STRUCTURE
ADMINISTRATIVE LINKS
Main Board members,
Directors and Auditor ![]()
|
POSITION |
SURNAMES AND
NAME |
APPOINTMENT DATE |
|
|
PRESIDENTE |
CANDEL JIMENEZ RAFAEL |
29/02/2008 |
|
|
CONSEJERO DELEGADO |
CANDEL NAVARRO RAFAEL |
29/02/2008 |
|
|
CONSEJERO |
CANDEL NAVARRO DAVID |
29/02/2008 |
|
|
AUDITOR |
APPOINTMENT DATE |
||
|
CUSPIDE AUDITORES SOCIEDAD LIMITADA |
21/02/2008 |
||
Functional Managers
|
POSITION |
SURNAMES AND
NAME |
|
Director general |
MORALES GONZALEZ ANGEL |
|
Gerente |
CANDEL NAVARRO RAFAEL |
|
Director financiero |
RUIZ FERNANDO |
FINANCIAL LINKS
|
|
BUSINESS NAME |
CIF / COUNTRY |
% |
SOURCE |
DATA INF. |
|
|
HIERROS Y TRANSFORMADOS SA |
ESPAÑA |
Mayor. |
F.PROPIAS |
22/05/2008 |
CREDIT INFORMATION
Constitution Date: 10/05/2000
Business activity 
Activity: Iron & steel industry
NACE Code: 2710
NACE Activity: Manufacture of basic iron and steel and of
ferro-alloys (ECSC)
Business: COMPRAVENTA DE TODA CLASE DE PRODUCTOS METALICOS,
EN ESPECIAL HIERROS Y ACEROS, LA COMPRAVENTA DE TODA CLASE DE MAQUINARIA Y LA
TRANSFORMACION DE HIERRO Y DEMAS PRODUCTOS METALICOS, CONSTRUCCIONES METALICAS,
ETC.
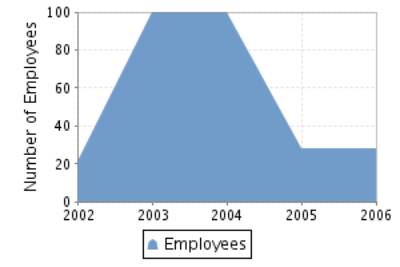
Employees 
Number of total employees: 30 (2008)
Number of fixed employees: 75,00%
Number of temporary employees: 25,00%
Employees evolution
COMMERCIAL OPERATIONS 
SALES
Collection (estimated):
National Distribution: 100%
Banks 
|
ENTITY |
BRANCH |
ADDRESS |
TOWN OR CITY |
PROVINCE |
|
BANCO BILBAO VIZCAYA ARGENTARIA, S.A. |
5413 |
ROSELLON, 443-445 |
BARCELONA |
Barcelona |
|
CAJA DE AHORROS Y PENSIONES DE BARCELONA |
0900 |
VIA LAIETANA, 56 |
BARCELONA |
Barcelona |
|
BANCO BILBAO VIZCAYA ARGENTARIA, S.A. |
|
|
SARRAL |
|
|
CAJA DE AHORROS Y PENSIONES DE BARCELONA |
|
|
SARRAL |
|
4 bank entities registered
Brands, Signs and Commercial
Names 
Brand name: METALPERFIL S.A. (Valid)
Type: MIXTA Date: 31/01/2008
LEGAL STRUCTURE
Constitution Data
Register Date: 10/05/2000
Register town: Barcelona
Announcement number: 291985
Current structure data 
Current Legal Form: SOCIEDAD ANONIMA
Current Capital: 900.000,00 €
Legal Aspects
Obligation to fill in Financial
Statements: YES
Chamber census: YES (2006)
Listed on a Stock Exchange: NO
B.O.R.M.E.(Official Companies
Registry Gazette) 
Registered Proceedings
|
PROCEEDINGS |
DATE |
NOTICE NUM. |
TRADE REG. |
|
Revocaciones |
29/02/2008 |
117574 |
Tarragona |
|
Nombramientos |
29/02/2008 |
117574 |
Tarragona |
|
Reelecciones |
21/02/2008 |
96996 |
Tarragona |
|
Cancelación de
oficio de nombramientos |
29/05/2007 |
291815 |
Tarragona |
Other Proceedings published
|
PROCEEDINGS |
DATE |
NOTICE NUM. |
TRADE REG. |
|
Depósito de cuentas (2006) Individual |
07/11/2007 |
991684 |
Tarragona |
Press articles

18/09/2006 EXPANSIÓN DE VALENCIA (INFORMACIÓN SUCURSALES)
LA EMPRESA METALPERFIL TIENE PREVISTO INVERTIR 9 MM. DE EUROS EN LA
CONSTRUCCION DE SU SEGUNDA PLANTA TRAS ADJUDICARSE UNA PARCELA DE 15.300 METROS
CUADRADOS EN PARC SAGUNT, DONDE CREARA VARIAS LINEAS DE PRODUCCION DE PERFILES
METALICOS DESTINADOS AL SECTOR DE LA CONSTRUCCION. LA INTENCION DE LA EMPRESA
ES COMENZAR LAS OBRAS ESTE AÑO PARA PODER OPERAR EN EL PRIMER SEMESTRE DE 2007.
LA FIRMA, QUE FORMA PARTE DEL GRUPO FAMILIAR HIERROS Y TRANSFORMACION, EMPLEARA
A UNAS 40 PERSONAS EN LA NUEVA FACTORIA CUANDO ESTE PLENAMENTE OPERATIVA Y SE ESPERA
QUE ALCANCE UNA FACTURACION DE ENTRE 6 Y 7 MM. DE EUROS EN EL SEGUNDO AÑO.
20/10/2003 ACT.ECONO (INFORMACIÓN PARTICIPACIONES)
LAS EMPRESAS DE TRANSFORMACION DE PRODUCTOS PLANOS SIDERURGICOS HIERROS
Y TRANSFORMADOS Y METALPANEL HAN ELEGIDO AMPLIAR HORIZONTES EN EL MERCADO
NACIONAL ANTES DE SALIR AL EXTRANJERO. CON SEDE CENTRAL EN MOTA DEL CUERVO
(CUENCA), LAS FIRMAS CUENTAN YA CON UNA FILIAL EN TARRAGONA, METALPERFIL, Y NO
DESCARTAN ABRIR DELEGACIONES EN LEVANTE Y ANDALUCIA. ANGEL MORALES ES DIRECTOR DE
LA EMPRESA Y PROPIETARIO AL 50%. EL RESTO DEL ACCIONARIADO LO POSEE RAFAEL
CANDEL. EN 2002, LAS TRES EMPRESAS FACTURARON MAS DE 60 MM. DE EUROS Y
ACTUALMENTE ESTAN EMBARCADAS EN EL TRASLADO DE HIERROS Y TRANSFORMADOS A
QUINTANAR DE LA ORDEN. LAS INVERSIONES ASCENDERAN A 18 MM. DE EUROS.
FINANCIAL INFORMATION
The information on the last account contained in this report is
extracted from the Mercantile Register file of the legal address of the Company
and dated 14/11/2007.
BALANCE SHEET
Assets
Figures given in €
|
|
31/12/2004 (12) |
31/12/2005 (12) |
31/12/2006 (12) |
|
A) ACCIONISTAS (SOCIOS) POR DESEMBOLSOS NO
EXIGIDOS |
|
|
|
|
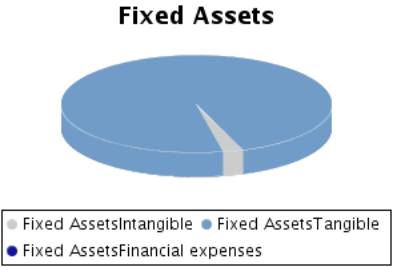
B) INMOVILIZADO |
1.663.377,87 |
2.201.229,75 |
3.074.502,28 |
|
I. Gastos de establecimiento |
|
|
|
|
II. Inmovilizaciones inmateriales |
90.907,09 |
80.872,93 |
72.280,06 |
|
Gastos de investigación y desarrollo |
18.253,90 |
32.937,36 |
47.233,06 |
|
Concesiones, patentes, licencias, marcas y similares |
|
|
|
|
Fondo de comercio |
|
|
|
|
Derechos de traspaso |
|
|
|
|
Aplicaciones informáticas |
29.936,63 |
29.936,63 |
37.498,25 |
|
Derechos s/bienes en régimen de arrendamiento financiero |
121.326,26 |
121.326,26 |
109.113,37 |
|
Anticipos |
|
|
|
|
Provisiones |
|
|
|
|
Amortizaciones |
-78.609,70 |
-103.327,32 |
-121.564,62 |
|
III. Inmovilizaciones materiales |
1.572.470,78 |
2.120.356,82 |
3.002.222,22 |
|
Terrenos y construcciones |
867.188,00 |
985.972,97 |
1.018.733,61 |
|
Instalaciones técnicas y maquinaria |
1.003.510,63 |
1.696.969,85 |
2.141.680,16 |
|
Otras instalaciones, utillaje y mobiliario |
43.432,00 |
66.728,74 |
80.278,22 |
|
Anticipos e inmovilizaciones materiales en curso |
157.469,80 |
48.313,80 |
650.520,98 |
|
Otro inmovilizado |
59.785,06 |
87.137,78 |
158.882,53 |
|
Provisiones |
|
|
|
|
Amortizaciones |
-558.914,71 |
-764.766,32 |
-1.047.873,28 |
|
IV. Inmovilizaciones financieras |
|
|
|
|
Participaciones en empresas del grupo |
|
|
|
|
Créditos a empresas del grupo |
|
|
|
|
Participaciones en empresas asociadas |
|
|
|
|
Créditos a empresas asociadas |
|
|
|
|
Cartera de valores a largo plazo |
|
|
|
|
Otros créditos |
|
|
|
|
Depósitos y fianzas constituidos a largo plazo |
|
|
|
|
Provisiones |
|
|
|
|
Administraciones Públicas a largo plazo |
|
|
|
|
V. Acciones propias |
|
|
|
|
VI. Deudores por operaciones de tráfico a largo
plazo |
|
|
|
|
C) GASTOS A DISTRIBUIR EN VARIOS EJERCICIOS |
2.137,78 |
685,62 |
49,73 |
|
D) ACTIVO CIRCULANTE |
4.947.590,56 |
6.213.423,97 |
7.342.759,86 |
|
I. Accionistas por desembolsos exigidos |
|
|
|
|
II. Existencias |
1.010.197,06 |
992.241,31 |
2.298.693,41 |
|
Comerciales |
1.010.197,06 |
|
|
|
Materias primas y otros aprovisionamientos |
|
992.241,31 |
2.298.693,41 |
|
Productos en curso y semiterminados |
|
|
|
|
Productos terminados |
|
|
|
|
Subproductos residuos y materiales recuperados |
|
|
|
|
Anticipos |
|
|
|
|
Provisiones |
|
|
|
|
III. Deudores |
3.700.228,22 |
4.932.284,91 |
4.911.431,24 |
|
Clientes por ventas y prestaciones de servicios |
3.828.859,26 |
5.095.291,78 |
5.070.503,02 |
|
Empresas del grupo, deudores |
|
|
|
|
Empresas asociadas, deudores |
|
|
|
|
Deudores varios |
255,75 |
|
|
|
Personal |
|
|
|
|
Administraciones Públicas |
37,23 |
|
|
|
Provisiones |
-128.924,02 |
-163.006,87 |
-159.071,78 |
|
IV. Inversiones financieras temporales |
|
|
|
|
Participaciones en empresas del grupo |
|
|
|
|
Créditos a empresas del grupo |
|
|
|
|
Participaciones en empresas asociadas |
|
|
|
|
Créditos a empresas asociadas |
|
|
|
|
Cartera de valores a corto plazo |
|
|
|
|
Otros créditos |
|
|
|
|
Depósitos y fianzas constituidos a corto plazo |
|
|
|
|
Provisiones |
|
|
|
|
V. Acciones propias a corto plazo |
|
|
|
|
VI. Tesorería |
237.165,28 |
288.897,75 |
132.635,21 |
|
VII. Ajustes por periodificación |
|
|
|
|
TOTAL ACTIVO (A + B + C + D) |
6.613.106,21 |
8.415.339,34 |
10.417.311,87 |
Assets composition

Liabilities
Figures given in €
|
|
31/12/2004 (12) |
31/12/2005 (12) |
31/12/2006 (12) |
|
A) FONDOS PROPIOS |
1.150.120,38 |
1.455.949,96 |
2.541.616,34 |
|
I. Capital suscrito |
900.000,00 |
900.000,00 |
900.000,00 |
|
II. Prima de emisión |
|
|
|
|
III. Reserva de revalorización |
|
|
|
|
IV. Reservas |
43,22 |
250.120,38 |
555.949,96 |
|
Reserva legal |
4,32 |
34.642,52 |
65.225,48 |
|
Reservas para acciones propias |
|
|
|
|
Reservas para acciones de la sociedad dominante |
|
|
|
|
Reservas estatutarias |
|
|
|
|
Otras reservas |
38,90 |
215.477,86 |
490.724,48 |
|
Diferencias por ajuste del capital a euros |
|
|
|
|
V. Resultados de ejercicios anteriores |
-96.304,83 |
|
|
|
Remanente |
|
|
|
|
Resultados negativos de ejercicios anteriores |
-96.304,83 |
|
|
|
Aportaciones de socios para compensación de pérdidas |
|
|
|
|
VI. Pérdidas y Ganancias (beneficio o pérdida) |
346.381,99 |
305.829,58 |
1.085.666,38 |
|
VII. Dividendo a cuenta entregado en el ejercicio |
|
|
|
|
VIII. Acciones propias para reducción de capital |
|
|
|
|
B) INGRESOS A DISTRIBUIR EN VARIOS EJERCICIOS |
|
|
|
|
Subvenciones de capital |
|
|
|
|
Diferencias positivas de cambio |
|
|
|
|
Otros ingresos a distribuir en varios ejercicios |
|
|
|
|
Ingresos fiscales a distribuir en varios ejercicios |
|
|
|
|
C) PROVISIONES PARA RIESGOS Y GASTOS |
|
|
|
|
Provisiones para pensiones y obligaciones similares |
|
|
|
|
Provisiones para impuestos |
|
|
|
|
Otras provisiones |
|
|
|
|
Fondo de reversión |
|
|
|
|
D) ACREEDORES A LARGO PLAZO |
1.536.232,16 |
2.558.183,29 |
2.352.909,39 |
|
I. Emisiones de obligaciones y otros valores
negociables |
|
|
|
|
Obligaciones no convertibles |
|
|
|
|
Obligaciones convertibles |
|
|
|
|
Otras deudas representadas en valores negociables |
|
|
|
|
II. Deudas con entidades de crédito |
1.497.532,13 |
1.948.618,31 |
1.752.909,39 |
|
Deudas a largo plazo con entidades de crédito |
1.497.532,13 |
1.948.618,31 |
1.752.909,39 |
|
Acreedores por arrendamiento financiero a largo plazo |
|
|
|
|
III. Deudas con empresas del grupo y asociadas |
|
600.000,00 |
600.000,00 |
|
Deudas con empresas del grupo |
|
600.000,00 |
600.000,00 |
|
Deudas con empresas asociadas |
|
|
|
|
IV. Otros acreedores |
38.700,03 |
9.564,98 |
|
|
Deudas representadas por efectos a pagar |
|
|
|
|
Otras deudas |
38.700,03 |
9.564,98 |
|
|
Fianzas y depósitos recibidos a largo plazo |
|
|
|
|
Administraciones Públicas a largo plazo |
|
|
|
|
V. Desembolsos pendientes sobre acciones no
exigidos |
|
|
|
|
De empresas del grupo |
|
|
|
|
De empresas asociadas |
|
|
|
|
De otras empresas |
|
|
|
|
VI. Acreedores por operaciones de tráfico a largo
plazo |
|
|
|
|
E) ACREEDORES A CORTO PLAZO |
3.926.753,67 |
4.401.206,09 |
5.522.786,14 |
|
I. Emisiones de obligaciones y otros valores
negociables |
|
|
|
|
Obligaciones no convertibles |
|
|
|
|
Obligaciones convertibles |
|
|
|
|
Otras deudas representadas en valores negociables |
|
|
|
|
Intereses de obligaciones y otros valores |
|
|
|
|
II. Deudas con entidades de crédito |
1.908.356,54 |
583.181,59 |
2.723.983,92 |
|
Préstamos y otras deudas |
1.908.356,54 |
583.181,59 |
2.723.983,92 |
|
Deudas por intereses |
|
|
|
|
Acreedores por arrendamiento financiero a corto plazo |
|
|
|
|
III. Deudas con empresas del grupo y asociadas a
corto plazo |
|
|
|
|
Deudas con empresas del grupo |
|
|
|
|
Deudas con empresas asociadas |
|
|
|
|
IV. Acreedores comerciales |
1.807.510,86 |
3.623.844,14 |
2.156.703,10 |
|
Anticipos recibidos por pedidos |
|
|
|
|
Deudas por compras o prestaciones de servicios |
1.807.510,86 |
3.623.844,14 |
2.156.703,10 |
|
Deudas representadas por efectos a pagar |
|
|
|
|
V. Otras deudas no comerciales |
210.886,27 |
194.180,36 |
642.099,12 |
|
Administraciones Públicas |
180.479,23 |
165.037,88 |
633.061,00 |
|
Deudas representadas por efectos a pagar |
|
|
|
|
Otras deudas |
|
29.142,48 |
8.949,87 |
|
Remuneraciones pendientes de pago |
29.124,48 |
|
88,25 |
|
Fianzas y depósitos recibidos a corto plazo |
1.282,56 |
|
|
|
VI. Provisiones para operaciones de tráfico |
|
|
|
|
VII. Ajustes por periodificación |
|
|
|
|
F) PROVISIONES PARA RIESGOS Y GASTOS A CORTO
PLAZO |
|
|
|
|
TOTAL PASIVO (A + B + C + D + E + F) |
6.613.106,21 |
8.415.339,34 |
10.417.311,87 |
Liabilities
Composition
PROFIT AND LOSS ACCOUNT
Itams of the Profit
and Loss Account
Figures given in €
|
|
31/12/2004 (12) |
31/12/2005 (12) |
31/12/2006 (12) |
|
A) GASTOS (A.1 a A.16) |
11.155.098,05 |
13.591.388,83 |
16.749.978,87 |
|
A.1. Reducción de existencias de productos
terminados y en curso de fabricación |
|
|
|
|
A.2. Aprovisionamientos |
9.431.142,81 |
11.469.902,58 |
13.713.599,33 |
|
Consumo de mercaderías |
-405.969,44 |
17.984,55 |
-1.306.452,10 |
|
Consumo de materias primas y otras materias consumibles |
9.837.112,25 |
11.450.253,81 |
15.014.831,43 |
|
Otros gastos externos |
|
1.664,22 |
5.220,00 |
|
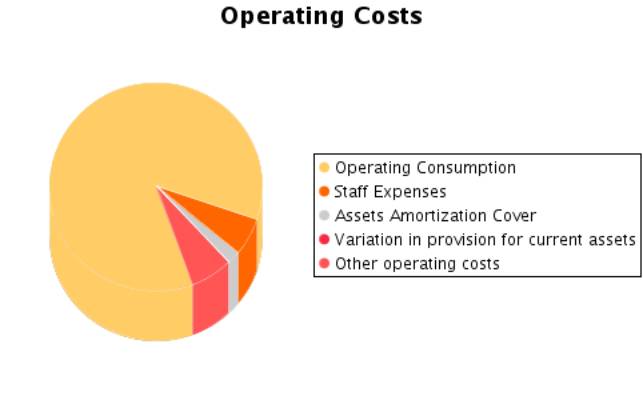
A.3. Gastos de personal |
557.238,48 |
747.195,65 |
945.000,97 |
|
Sueldos, salarios y asimilados |
422.228,24 |
575.893,52 |
765.527,66 |
|
Cargas sociales |
135.010,24 |
171.302,13 |
179.473,31 |
|
A.4. Dotaciones para amortizaciones de
inmovilizado |
179.620,73 |
230.569,23 |
312.973,84 |
|
A.5. Variación de las provisiones de tráfico |
46.362,18 |
34.082,85 |
623,54 |
|
Variación de provisiones de existencias |
|
|
|
|
Variación de provisiones y pérdidas de créditos incobrables |
46.362,18 |
34.082,85 |
623,54 |
|
Variación de otras provisiones de tráfico |
|
|
|
|
A.6. Otros gastos de explotación |
638.066,31 |
852.536,66 |
1.022.285,31 |
|
Servicios exteriores |
632.530,36 |
848.145,91 |
1.016.338,15 |
|
Tributos |
5.535,95 |
4.390,75 |
5.947,16 |
|
Otros gastos de gestión corriente |
|
|
|
|
Dotación al fondo de reversión |
|
|
|
|
A.I. BENEFICIOS DE EXPLOTACION
(B.1+B.2+B.3+B.4-A.1-A.2-A.3-A.4-A.5-A.6) |
648.846,84 |
562.332,87 |
1.838.200,54 |
|
A.7. Gastos financieros y gastos asimilados |
111.413,54 |
97.732,11 |
171.039,02 |
|
Por deudas con empresas del grupo |
|
|
|
|
Por deudas con empresas asociadas |
|
|
|
|
Por otras deudas Por deudas con terceros y gastos asimilados |
111.413,54 |
97.732,11 |
171.039,02 |
|
Pérdidas de inversiones financieras |
|
|
|
|
A.8. Variación de las provisiones de inversiones
financieras |
|
|
|
|
A.9. Diferencias negativas de cambio |
|
|
|
|
A.II. RESULTADOS
FINANCIEROS POSITIVOS (B.5+B.6+B.7+B.8-A.7-A.8-A.9) |
|
|
|
|
A.III.
BENEFICIOS DE LAS ACTIVIDADES ORDINARIAS (A.I+A.II-B.I-B.II) |
537.582,42 |
464.953,28 |
1.667.904,44 |
|
A.10. Variación
de las provisiones de inmovilizado inmaterial, material y cartera de control |
|
|
|
|
A.11. Pérdidas
procedentes del inmovilizado inmaterial, material y cartera de control |
|
|
3.711,78 |
|
A.12. Pérdidas
por operaciones con acciones y obligaciones propias |
|
|
|
|
A.13. Gastos
extraordinarios |
8.864,63 |
477,67 |
265,82 |
|
A.14. Gastos y
pérdidas de otros ejercicios |
|
|
|
|
A.IV. RESULTADOS
EXTRAORDINARIOS POSITIVOS (B.9+B.10+B.11+B.12+B.13-A.10-A.11-A.12-A.13-A.14) |
|
|
|
|
A.V. BENEFICIOS
ANTES DE IMPUESTOS (A.II+A.IV-B.III-B.IV.) |
528.771,36 |
464.721,66 |
1.666.145,64 |
|
A.15. Impuesto
sobre Sociedades |
182.389,37 |
158.892,08 |
580.479,26 |
|
A.16. Otros
impuestos |
|
|
|
|
A.VI. RESULTADO
DEL EJERCICIO (BENEFICIOS) (A.V-A.15-A.16) |
346.381,99 |
305.829,58 |
1.085.666,38 |
|
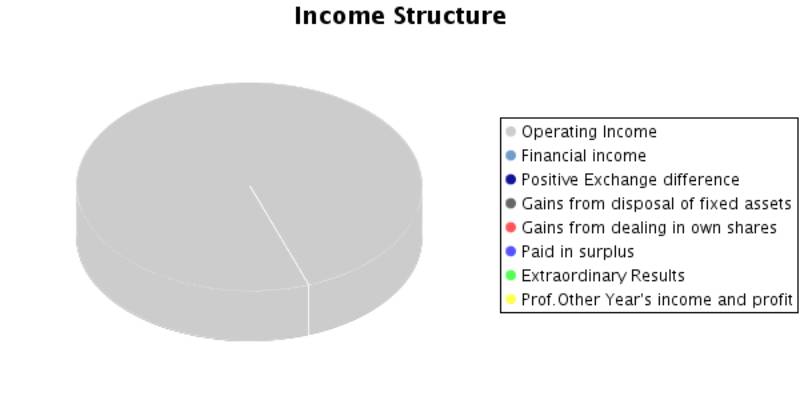
B) INGRESOS (B.1
a B.13) |
11.501.480,04 |
13.897.218,41 |
17.835.645,25 |
|
B.1. Importe
neto de la cifra de negocios |
11.501.277,35 |
13.896.619,84 |
17.828.098,26 |
|
Ventas |
11.501.277,35 |
13.896.619,84 |
17.828.098,26 |
|
Prestaciones de servicios |
|
|
|
|
Devoluciones y
“rappels” sobre ventas |
|
|
|
|
B.2. Aumento de
existencias de productos terminados y en curso de fabricación |
|
|
|
|
B.3. Trabajos
efectuados por la empresa para el inmovilizado |
|
|
|
|
B.4. Otros
ingresos de explotación |
|
|
4.585,27 |
|
Ingresos
accesorios y otros de gestión corriente |
|
|
18,03 |
|
Subvenciones |
|
|
|
|
Exceso de
provisiones de riesgos y gastos |
|
|
4.567,24 |
|
B.I. PÉRDIDAS DE
EXPLOTACIÓN (A.1+A.2+A.3+A.4+A.5+A.6-B.1-B.2-B.3-B.4) |
|
|
|
|
B.5. Ingresos de
participaciones en capital |
|
|
|
|
En empresas del
grupo |
|
|
|
|
En empresas
asociadas |
|
|
|
|
En empresas
fuera del grupo |
|
|
|
|
B.6. Ingresos de
otros valores negociables y de créditos del activo inmovilizado |
|
|
|
|
De empresas del grupo |
|
|
|
|
De empresas asociadas |
|
|
|
|
De empresas
fuera del grupo |
|
|
|
|
B.7. Otros
intereses e ingresos asimilados |
149,12 |
352,52 |
742,92 |
|
De empresas del
grupo |
|
|
|
|
De empresas
asociadas |
|
|
|
|
Otros intereses |
149,12 |
352,52 |
742,92 |
|
Beneficios en
inversiones financieras |
|
|
|
|
B.8. Diferencias
positivas de cambio |
|
|
|
|
B.II. RESULTADOS
FINANCIEROS NEGATIVOS (A.7+A.8+A.9-B.5-B.6-B.7-B.8) |
111.264,42 |
97.379,59 |
170.296,10 |
|
B.III. PÉRDIDAS
DE LAS ACTIVIDADES ORDINARIAS (B.I+B.II-A.I-A.II) |
|
|
|
|
B.9. Beneficios
en enajenación de inmovilizado inmaterial, material y cartera de control |
|
|
|
|
B.10. Beneficios
por operaciones con acciones y obligaciones propias |
|
|
|
|
B.11. Subvenciones
de capital transferidas al resultado del ejercicio |
|
|
|
|
B.12. Ingresos
extraordinarios |
53,57 |
246,05 |
2.218,80 |
|
B.13. Ingresos y
beneficios de otros ejercicios |
|
|
|
|
B.IV. RESULTADOS
EXTRAORDINARIOS NEGATIVOS (A.10+A.11+A.12+A.13+A.14-B.9-B.10-B.11-B.12-B.13) |
8.811,06 |
231,62 |
1.758,80 |
|
B.V. PÉRDIDAS
ANTES DE IMPUESTOS (B.III+B.IV-A.III-A.IV) |
|
|
|
|
B.VI. RESULTADO
DEL EJERCICIO (PERDIDAS) (B.V+A.15+A.16) |
|
|
|
Composition of the
Profit and Loss Account
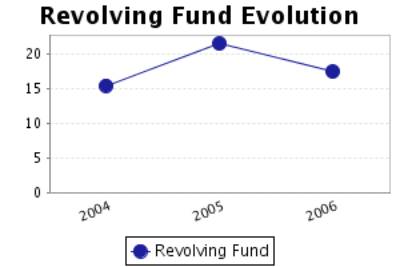
FINANCIAL BALANCE
Here the Main Capital Amounts of the company and the Revolving Fund
Evolution are analysed.
Financial Balance
Table
Figures given in €
|
|
31/12/2004 (12) |
% |
31/12/2005 (12) |
% |
31/12/2006 (12) |
% |
|
A) ACCIONISTAS (SOCIOS) POR DESEMBOLSOS NO EXIGIDOS |
|
|
|
|
|
|
|
B) INMOVILIZADO |
1.663.377,87 |
25,15 |
2.201.229,75 |
26,16 |
3.074.502,28 |
29,51 |
|
C) GASTOS A DISTRIBUIR EN VARIOS EJERCICIOS |
2.137,78 |
0,03 |
685,62 |
0,01 |
49,73 |
0,00 |
|
D) ACTIVO CIRCULANTE |
4.947.590,56 |
74,81 |
6.213.423,97 |
73,83 |
7.342.759,86 |
70,49 |
|
TOTAL ACTIVO (A + B + C + D) |
6.613.106,21 |
|
8.415.339,34 |
|
10.417.311,87 |
|
|
|
||||||
|
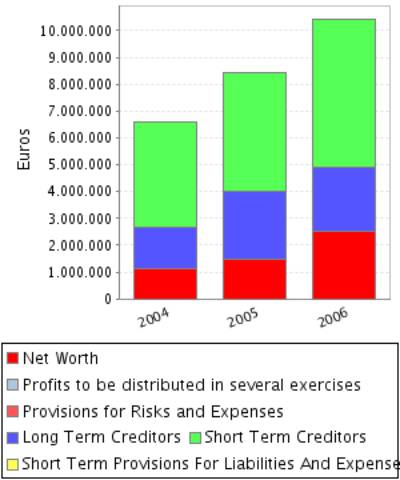
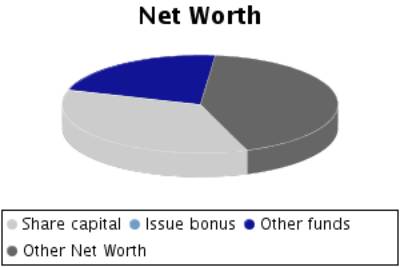
A) FONDOS PROPIOS |
1.150.120,38 |
17,39 |
1.455.949,96 |
17,30 |
2.541.616,34 |
24,40 |
|
B) INGRESOS A DISTRIBUIR EN VARIOS EJERCICIOS |
|
|
|
|
|
|
|
C) PROVISIONES PARA RIESGOS Y GASTOS |
|
|
|
|
|
|
|
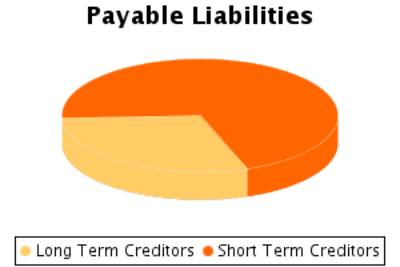
D) ACREEDORES A LARGO PLAZO |
1.536.232,16 |
23,23 |
2.558.183,29 |
30,40 |
2.352.909,39 |
22,59 |
|
E) ACREEDORES A CORTO PLAZO |
3.926.753,67 |
59,38 |
4.401.206,09 |
52,30 |
5.522.786,14 |
53,02 |
|
F) PROVISIONES PARA RIESGOS Y GASTOS A CORTO PLAZO |
|
|
|
|
|
|
|
TOTAL PASIVO (A + B + C + D + E + F) |
6.613.106,21 |
|
8.415.339,34 |
|
10.417.311,87 |
|
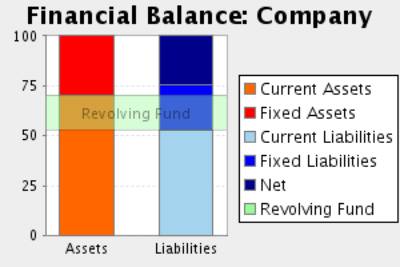
Financial Balance
Composition
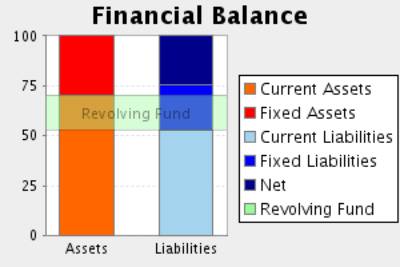
Comments on Financial
Balance
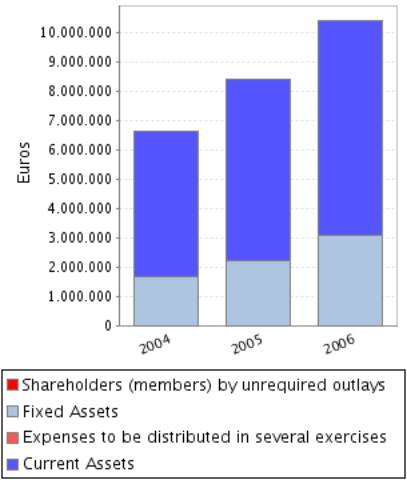
In the 2004, the assets of the company were formed in 25,19% of Fixed
Assets and in 74,81% of Current Assets.This assets were financed in 17,39% with
own capitals, and in 23,23% with long term debt and in 59,38% with current
liabilities.
The result of this financial structure is a positive turnover fund of
1.020.836,89 Euros, which is equivalent to 15,44% proportion of the
company’s total assets.
In the 2005, the assets of the company were formed in 26,17% of Fixed
Assets and in 73,83% of Current Assets.This assets were financed in 17,30% with
own capitals, and in 30,40% with long term debt and in 52,30% with current
liabilities.
The result of this financial structure is a positive turnover fund of
1.812.217,88 Euros, which is equivalent to 21,53% proportion of the
company’s total assets.
This measure has increased with respect to the previous exercise in
77,52% having also increased its proportion with respect to the total assets of
the company.
In the 2006, the assets of the company were formed in 29,51% of Fixed
Assets and in 70,49% of Current Assets.This assets were financed in 24,40% with
own capitals, and in 22,59% with long term debt and in 53,02% with current
liabilities.
The result of this financial structure is a positive turnover fund of
1.819.973,72 Euros, which is equivalent to 17,47% proportion of the
company’s total assets.
This measure has increased with respect to the previous exercise in
0,43% having, however, diminished its proportion with respect to the total
assets of the company.
RATIOS
Main Ratios
|
|
31/12/2004 (12) |
31/12/2005 (12) |
31/12/2006 (12) |
|
STRUCTURAL RATIOS |
|
|
|
|
Fondo maniobra |
1.020.836,89 |
1.812.217,88 |
1.819.973,72 |
|
Necesidad fondo maniobra |
2.692.028,15 |
2.106.501,72 |
4.411.322,43 |
|
Endeudamiento (%) |
82,61 |
82,70 |
75,60 |
|
Fondos ajenos sobre fondos propios |
4,75 |
4,78 |
3,10 |
|
GENERAL ACTIVITY RATIO |
|
|
|
|
Crecimiento de la cifra de negocio (%) |
58,90 |
20,83 |
28,29 |
|
Crecimiento valor añadido (%) |
71,06 |
9,92 |
96,72 |
|
Cash flow |
572.364,90 |
570.481,66 |
1.399.263,76 |
|
Productividad de la mano de obra |
2,57 |
2,11 |
3,28 |
|
Rotación de activos |
1,74 |
1,65 |
1,71 |
|
Punto muerto |
7.896.406,59 |
10.676.415,23 |
9.874.592,14 |
|
Margen de seguridad del punto muerto (%) |
31,34 |
23,17 |
44,63 |
|
ACTIVITY RATIOS |
|
|
|
|
Periodo medio de pago |
69 |
114 |
57 |
|
Periodo medio de cobro |
116 |
128 |
99 |
|
Periodo de rotación de inventario |
32 |
26 |
46 |
|
SOLVENCY RATIOS |
|
|
|
|
Capacidad devolución |
0,10 |
0,08 |
0,18 |
|
Garantía de activo |
1,21 |
1,21 |
1,32 |
|
Proporción de deudas a corto plazo (%) |
71,88 |
63,24 |
70,12 |
|
Cobertura de intereses |
5,14 |
5,83 |
8,16 |
|
LIQUIDITY RATIOS |
|
|
|
|
Ratio corriente |
1,26 |
1,41 |
1,33 |
|
Liquidez inmediata |
0,06 |
0,07 |
0,02 |
|
Tesorería |
-1.671.191,26 |
-294.283,84 |
-2.591.348,71 |
|
Ventas sobre activo circulante |
837 |
805 |
874 |
Results Analysis
Ratios
|
|
31/12/2004 (12) |
31/12/2005 (12) |
31/12/2006 (12) |
|
Rentabilidad económica (%) |
9,81 |
6,68 |
17,65 |
|
Rentabilidad de explotación (%) |
5,64 |
4,05 |
10,31 |
|
Apalancamiento financiero |
4,76 |
4,78 |
3,72 |
|
Rentabilidad financiera (%) |
30,12 |
21,01 |
42,72 |
|
Rentabilidad general (%) |
3,01 |
2,20 |
6,09 |
Comments on the
Results Analysis Ratios
The economic profitability in the year2005 achieved a 6,68% positive
level, due to a 4,05% economic margin and to an assets turnover of1,65%.
The economic profitability in the year has reduced from 9,81% up to
6,68% of2005, even if it remains positive. This fall is due to the decrease in
operating profitability, that has passe from 5,64% to 4,05%, as assets turnover
whose index has passed from 1,74 to 1,65%.
Financial profitability on 2005 achieved a 21,01%.
The company’s financial structure has instigated its economic
profitability with an indebtedness level of 4,78.
The general profitability on 2005 achieved a 2,20%.
The economic profitability in the year2006 achieved a 17,65% positive
level, due to a 10,31% economic margin and to an assets turnover of1,71%.
The economic profitability in the year has increased from 6,68% up to
17,65%. This growth is due to the economic margin increase, from 4,05% to the
current 10,31Y%, and to the assets turnover index, which in the last period has
achieved 1,71, compared to 1,65 del 2005.
Financial profitability on 2006 achieved a 42,72%.
The company’s financial structure has instigated its economic
profitability with an indebtedness level of 3,72.
The general profitability on 2006 achieved a 6,09%.
SECTORIAL ANÁLYSIS
Large Capital Amounts
and Financial Balance
Figures given in %
|
|
COMPANY (2006) |
SECTOR |
DIFFERENCE |
DIFFERENCE RELATIVE |
|
|
|
|
|
|
ASSETS |
|
|
|
|
|
|
|
|
|
|
A) ACCIONISTAS (SOCIOS) POR DESEMBOLSOS NO EXIGIDOS |
|
0,00 |
|
|
|
|
|
|
|
|
B) INMOVILIZADO |
29,51 |
39,38 |
-9,87 |
-25,07 |
|
|
|
|
|
|
C) GASTOS A
DISTRIBUIR EN VARIOS EJERCICIOS |
0,00 |
0,32 |
-0,32 |
-100,00 |
|
|
|
|
|
|
D) ACTIVO
CIRCULANTE |
70,49 |
60,30 |
10,19 |
16,89 |
|
|
|
|
|
|
TOTAL ACTIVO (A
+ B + C + D) |
100 |
100 |
|
|
|
|
|
|
|
|
|
|
|
|
|
|
|
|
|
|
|
|
COMPANY (2006) |
SECTOR |
DIFFERENCE |
DIFFERENCE RELATIVE |
|
|
|
|
|
|
LIABILITIES |
|
|
|
|
|
|
|
|
|
|
A) FONDOS
PROPIOS |
24,40 |
39,94 |
-15,54 |
-38,91 |
|
|
|
|
|
|
B) INGRESOS A
DISTRIBUIR EN VARIOS EJERCICIOS |
|
1,51 |
|
|
|
|
|
|
|
|
C) PROVISIONES
PARA RIESGOS Y GASTOS |
|
0,02 |
|
|
|
|
|
|
|
|
D) ACREEDORES A
LARGO PLAZO |
22,59 |
16,08 |
6,51 |
40,49 |
|
|
|
|
|
|
E) ACREEDORES A
CORTO PLAZO |
53,02 |
42,20 |
10,82 |
25,64 |
|
|
|
|
|
|
F) PROVISIONES
PARA RIESGOS Y GASTOS A CORTO PLAZO |
|
0,25 |
|
|
|
|
|
|
|
|
TOTAL PASIVO (A + B + C + D + E + F) |
100 |
100 |
|
|
|
|
|
|
|
Financial Balance
Composition
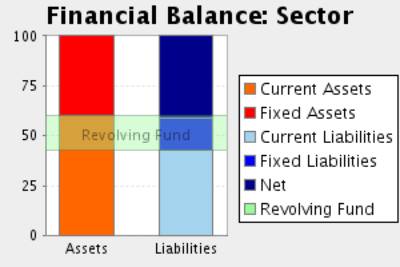
Comments to the
Sectorial Analysis
In the 2006, the assets of the company were formed in 29,51% of fixed
assets and in 70,49Current Assets % In the sector, the proportion of fixed
assets was of 39,70%, 25,66% superior, and the proportion of current assets was
of 60,30%, 16,89% inferior.
The assets were financed in the company in 24,40% with own capitals , in
22,59% with fixed liabilities and in 53,02% with current liabilities In the
sector, the self financing represented 41,45%, 41,14% superior. On the other
hand the long term debts represented in the sector an average of 16,10%
financing, with a relative difference of 40,33% in favour of the companyAnd,
short term liabilities represented in the sector an average of 42,45%
financing, with a relative difference of 24,90% in favour of the company
The result of this company’s financial structure is a turnover fund that
represents 17,47% of the total assets; in the sector, this same proportion is
17,85%, therefore, we can say that the company’s turnover fund is 2,15% smaller
than the sector one.
Analytical Account of
Results
Figures given in %
|
|
COMPANY (2006) |
SECTOR |
DIFFERENCE |
DIFFERENCE RELATIVE |
|
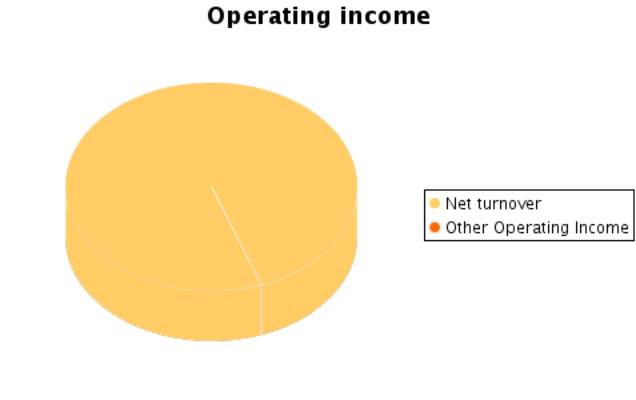
Importe neto de la cifra de negocios |
99,97 |
99,78 |
0,19 |
0,19 |
|
Otros ingresos de explotación |
0,03 |
0,22 |
-0,19 |
-86,11 |
|
Valor de la Producción |
100,00 |
100,00 |
0,00 |
0,00 |
|
Consumos explotación |
76,90 |
68,17 |
8,73 |
12,81 |
|
Otros gastos explotación |
5,73 |
10,23 |
-4,50 |
-44,00 |
|
Valor Añadido |
17,37 |
21,60 |
-4,23 |
-19,58 |
|
Gastos de Personal |
5,30 |
14,82 |
-9,52 |
-64,23 |
|
Resultado
Económico Bruto |
12,07 |
6,78 |
5,29 |
77,92 |
|
Dotaciones para
amortizaciones de inmovilizado |
1,76 |
3,57 |
-1,81 |
-50,76 |
|
Variación de las
provisiones de tráfico y pérdidas de crédito incobrables |
0,00 |
0,24 |
-0,24 |
-100,00 |
|
Resultado
Económico Neto |
10,31 |
2,98 |
7,34 |
246,55 |
|
Ingresos financieros |
0,00 |
0,21 |
-0,21 |
-100,00 |
|
Gastos
financieros |
0,96 |
1,13 |
-0,17 |
-14,74 |
|
Variación de las
provisiones de inv. financieras |
|
0,00 |
|
|
|
Resultado
Actividades Ordinarias |
9,35 |
2,06 |
7,29 |
354,77 |
|
Ingresos
extraordinarios |
0,01 |
0,53 |
-0,52 |
-98,11 |
|
Gastos extraordinarios |
0,02 |
0,31 |
-0,29 |
-93,53 |
|
Variación de las
provisiones de inmovilizado inmaterial, material y cartera de control |
|
-0,12 |
|
|
|
Resultado Antes
Impuestos |
9,34 |
2,40 |
6,94 |
289,65 |
|
Impuesto sobre
sociedades |
3,26 |
0,72 |
2,54 |
353,41 |
|
Resultado Neto |
6,09 |
1,68 |
4,41 |
262,93 |
|
Dotaciones para
amortizaciones de inmovilizado |
1,76 |
3,57 |
-1,81 |
-50,76 |
|
Variación de
provisiones |
0,00 |
0,11 |
-0,11 |
-100,00 |
|
Autofinanciación Neta |
7,85 |
5,37 |
2,48 |
46,26 |
Main Ratios
|
|
COMPANY (2006) |
PTILE25 |
PTILE50 |
PTILE75 |
|
STRUCTURAL RATIOS |
|
|
|
|
|
Fondo maniobra |
1.819.973,72 |
-37,10 |
2.264,81 |
4.180,96 |
|
Necesidad fondo maniobra |
4.411.322,43 |
-2.891,77 |
-1.751,25 |
2.224,79 |
|
Endeudamiento (%) |
75,60 |
39,71 |
65,90 |
74,60 |
|
Fondos ajenos sobre fondos propios |
3,10 |
0,68 |
1,93 |
3,53 |
|
GENERAL ACTIVITY
RATIO |
|
|
|
|
|
Crecimiento de
la cifra de negocio (%) |
28,29 |
-17,51 |
6,69 |
19,36 |
|
Crecimiento
valor añadido (%) |
96,72 |
-31,27 |
-2,17 |
20,84 |
|
Cash flow |
1.399.263,76 |
541,61 |
859,96 |
1.407,69 |
|
Productividad de
la mano de obra |
3,28 |
1,48 |
1,72 |
2,23 |
|
Rotación de
activos |
1,71 |
0,83 |
1,26 |
1,44 |
|
Punto muerto |
9.874.592,14 |
8.567.379,16 |
11.715.025,22 |
23.068.762,08 |
|
Margen de
seguridad del punto muerto (%) |
44,63 |
8,87 |
11,72 |
20,62 |
|
ACTIVITY RATIOS |
|
|
|
|
|
Periodo medio de
pago |
57 |
51 |
103 |
141 |
|
Periodo medio de
cobro |
99 |
71 |
94 |
151 |
|
Periodo de
rotación de inventario |
46 |
39 |
60 |
107 |
|
SOLVENCY RATIOS |
|
|
|
|
|
Capacidad
devolución |
0,18 |
0,06 |
0,11 |
0,23 |
|
Garantía de
activo |
1,32 |
1,35 |
1,50 |
2,66 |
|
Proporción de
deudas a corto plazo (%) |
70,12 |
61,98 |
80,35 |
97,73 |
|
Cobertura de
intereses |
8,16 |
1,91 |
4,88 |
11,77 |
|
LIQUIDITY RATIOS |
|
|
|
|
|
Ratio corriente |
1,33 |
1,00 |
1,29 |
2,05 |
|
Liquidez
inmediata |
0,02 |
0,03 |
0,11 |
0,30 |
|
Tesorería |
-2.591.348,71 |
-2.732,48 |
-1.439,57 |
1.027,64 |
|
Ventas sobre
activo circulante |
874 |
496 |
680 |
853 |
Results Analysis
Ratios
|
|
COMPANY (2006) |
PTILE25 |
PTILE50 |
PTILE75 |
|
Rentabilidad económica (%) |
17,65 |
2,63 |
3,90 |
5,48 |
|
Rentabilidad de explotación (%) |
10,31 |
1,99 |
3,28 |
6,45 |
|
Apalancamiento financiero |
3,72 |
1,06 |
1,80 |
3,84 |
|
Rentabilidad financiera (%) |
42,72 |
2,26 |
6,80 |
11,96 |
|
Rentabilidad general (%) |
6,09 |
1,14 |
2,01 |
4,22 |
NOTES
Here is our final resport. Even thoudh this
company is obliged to file their balance sheets in the Mercantile Register, no
official balance sheets are available for 2007.
FOREIGN EXCHANGE
RATES
|
Currency |
Unit
|
Indian Rupees |
|
US Dollar |
1 |
Rs.43.30 |
|
UK Pound |
1 |
Rs.86.13 |
|
Euro |
1 |
Rs.68.72 |
RATING
EXPLANATIONS
|
RATING |
STATUS |
PROPOSED CREDIT LINE |
|
|
>86 |
Aaa |
Possesses an extremely sound financial base with the strongest
capability for timely payment of interest and principal sums |
Unlimited |
|
71-85 |
Aa |
Possesses adequate working capital. No caution needed for credit
transaction. It has above average (strong) capability for payment of interest
and principal sums |
Large |
|
56-70 |
A |
Financial & operational base are regarded healthy. General
unfavourable factors will not cause fatal effect. Satisfactory capability for
payment of interest and principal sums |
Fairly Large |
|
41-55 |
Ba |
Overall operation is considered normal. Capable to meet normal
commitments. |
Satisfactory |
|
26-40 |
B |
Unfavourable & favourable factors carry similar weight in credit consideration.
Capability to overcome financial difficulties seems comparatively below
average. |
Small |
|
11-25 |
Ca |
Adverse factors are apparent. Repayment of interest and principal sums
in default or expected to be in default upon maturity |
Limited with
full security |
|
<10 |
C |
Absolute credit risk exists. Caution needed to be exercised |
Credit not
recommended |
|
NR |
In view of the lack of information, we have no basis upon which to
recommend credit dealings |
No Rating |
|
This score serves as a reference to assess SC’s credit risk
and to set the amount of credit to be extended. It is calculated from a
composite of weighted scores obtained from each of the major sections of this
report. The assessed factors and their relative weights (as indicated through
%) are as follows:
Financial
condition (40%) Ownership
background (20%) Payment
record (10%)
Credit history
(10%) Market trend
(10%) Operational
size (10%)