![]()
MIRA
INFORM REPORT
|
Report Date : |
01.07.2008 |
IDENTIFICATION
DETAILS
|
Name : |
TUBACEX TUBOS INOXIDABLES SA ”TTI |
|
|
|
|
Registered Office : |
Calle Tres Cruces, 8 01400 Llodio Álava |
|
|
|
|
Country : |
Spain |
|
|
|
|
Financials (as on) : |
31.12.2006 |
|
|
|
|
Date of Incorporation : |
|
|
|
|
|
Legal Form : |
Sociedad Limitada |
|
|
|
|
Line of Business : |
RATING &
COMMENTS
|
MIRA’s Rating : |
A |
|
RATING |
STATUS |
PROPOSED CREDIT LINE |
|
|
56-70 |
A |
Financial & operational base are regarded healthy. General
unfavourable factors will not cause fatal effect. Satisfactory capability for
payment of interest and principal sums |
Fairly Large |
|
Maximum Credit Limit : |
2.260.406,52 € |
|
|
|
|
Status : |
Good |
|
|
|
|
Payment Behaviour : |
Regular |
|
|
|
|
Litigation : |
Clear |
FINANCIAL
REPORT
TUBACEX TUBOS INOXIDABLES SA ”TTI”
TAX NUMBER: A01140227
EXECUTIVE SUMMARY
Identification
Current Business Name: TUBACEX TUBOS
INOXIDABLES SA
Commercial Name: TTI
Other names: YES
Current Address: CALLE TRES
CRUCES, 8, CP 01400, LLODIO ÁLAVA
Telephone number: 946719300 Fax: 946725062
URL: www.tubacex.com Corporate e-mail: sales@tubacex.es
Commercial Risk
Credit Appraisal:
2.260.406,52 €
Legal Actions: NO
Financial Information
Latest sales known (2007): 243.896.601,51 € (Estimadas)
Latest Balance sheet sales (2006): 236.792.817,00 € (Registro Mercantil)
Result: 3.558.124 €
Total Assets:
158.430.148 €
Social Capital: 15.028.005,00 €
Employees: 580
Commercial Information
Constitution Date: 21/05/1993
Business activity: Mfg. of steel
tubes
NACE Code: 2722
International Operations: Importa y
exporta
Corporate Structure
Presidente:
Parent Company:
Other Complementary Information
Latest proceeding published in BORME: 06/03/2008 Nombramientos
Latest press article: 19/06/2007 EXPANSION
DEL PAIS VASCO (INFORMACIÓN GENERAL)
Bank Entities: Yes
Credit Appraisal
Maximum Credit (from 0 a 6,000,000 €):
2.260.406,52 €
Rating Evolution

Financial Situation
Fiscal year2006
|
Treasury |
Excelente |
|
Indebtedness |
Medio |
|
Profitability |
Media |
|
Balance |
Excelente |
Performance
|
Legal Actions |
Nulas o irrelevantes |
|
Business
Trajectory |
Excelente |
|
|
|
INCIDENTS

Summary
LEGAL ACTIONS: No legal
incidences registered
CLAIM FILED AGAINST THE ADMINISTRATION: No administrative
claims registered
AFFECTED BY: No significant
element.
FINANCIAL ELEMENTS AND SECTORIAL
COMPARATIVE
FINANCIAL ELEMENTS
Figures given in €
|
|
2005 (12) |
2006 (12) |
2007 |
|
|
|
|
|
BALANCE SHEET ANALYSIS |
|
|
|
|
|
|
|
|
OWN FUNDS |
52.706.460,00 |
55.664.464,00 |
|
|
|
|
|
|
DEBT |
85.013.601,00 |
102.765.684,00 |
|
|
|
|
|
|
FIXED ASSETS |
16.796.209,00 |
18.578.850,00 |
|
|
|
|
|
|
TOTAL ASSETS |
137.720.061,00 |
158.430.148,00 |
|
|
|
|
|
|
|
|
|
|
|
|
|
|
|
|
2005 (12) |
2006 (12) |
2007 |
|
|
|
|
|
PROFIT AND LOSS ACCOUNT ANALYSIS |
|
|
|
|
|
|
|
|
SALES |
187.893.175,00 |
236.792.817,00 |
243.896.601,51 |
|
|
|
|
|
ADDED VALUE |
42.244.470,00 |
44.098.938,00 |
|
|
|
|
|
|
EBITDA |
13.598.780,00 |
11.930.023,00 |
|
|
|
|
|
|
EBIT |
7.919.517,00 |
6.254.894,00 |
|
|
|
|
|
|
NET RESULT |
4.647.380,00 |
3.558.124,00 |
|
|
|
|
|
Balance Sheets Items Analysis


Balance Sheet
Comments
Total assets of the company grew 15,04% between 2005 and 2006.
This growth has been inferior in the case of the fixed assets that increased
just in 10,61%.
This growth has been mainly financed with a debt increase of 20,88%.
Nevertheless the net worth increased 5,61%.
Profit and Loss Account Analysis


Profit and Loss
Account Comments
The company’s sales figure grew 26,03% between 2005 and 2006.
The company’s EBIT decreased in 21,02% between 2005 and 2006.
This evolution implies a reduction in the company’s operating
profitability.
The result of these variations is a decrease of the company’s Economic
Profitability of 31,34% in the analysed period, being this profitability of
3,95% in the year 2006.
The company’s Net Result decreased in 23,44% between 2005 and 2006.
This evolution, compared to the EBIT’s performance, implies that the
financial and extraordinary activities have had a negative effect in the
company’s Financial Profitability.
The result of these variations is a reduction of the company’s
profitability of 27,51% in the analysed period, being equal to 6,39% in the
year 2006.
ANNUAL FINANCIAL REPORT
ADDITIONAL DATA
Source: annual financial report 2006
Results Distribution
Figures given in €
|
DISTRIBUTION
BASE |
DISTRIBUTION TO |
||
|
Profit and Loss |
3.558.124,75 |
Retained earnings |
0,00 |
|
Carry Over |
0,00 |
Voluntary Reserve |
2.958.004,75 |
|
Voluntary reserves |
0,00 |
Prior years losses |
0,00 |
|
Reserves |
0,00 |
Carry Over |
0,00 |
|
Other concepts |
0,00 |
Other funds |
0,00 |
|
Total of Amounts to be distributed |
3.558.124,75 |
Dividends |
600.120,00 |
|
|
|
Other Applications |
0,00 |
Auditing
Auditors’ opinion: FAVORABLE
Auditor: KPMG AUDITORES S.L.
COMPARATIVE SECTOR ANALYSIS
Values table
Figures expressed in %
|
|
COMPANY (2006) |
SECTOR |
DIFFERENCE |
DIFFERENCE RELATIVE |
|
|
|
|
|
|
BALANCE SHEET
ANALYSIS: % on the total assets |
|
|
|
|
|
|
|
|
|
|
OWN FUNDS |
35,14 |
50,05 |
-14,91 |
-29,79 |
|
|
|
|
|
|
DEBT |
64,86 |
49,95 |
14,91 |
29,85 |
|
|
|
|
|
|
FIXED ASSETS |
11,73 |
39,64 |
-27,91 |
-70,42 |
|
|
|
|
|
|
|
|
|
|
|
|
|
|
|
|
|
|
COMPANY (2006) |
SECTOR |
DIFFERENCE |
DIFFERENCE RELATIVE |
|
|
|
|
|
|
PROFIT AND LOSS
ACCOUNT ANALYSIS: % on the total operating income |
|
|
|
|
|
|
|
|
|
|
SALES |
99,47 |
99,65 |
-0,18 |
-0,18 |
|
|
|
|
|
|
ADDED VALUE |
18,52 |
24,65 |
-6,12 |
-24,84 |
|
|
|
|
|
|
EBIT |
2,63 |
8,00 |
-5,38 |
-67,18 |
|
|
|
|
|
|
NET RESULT |
1,49 |
5,27 |
-3,77 |
-71,62 |
|
|
|
|
|
Sector Composition
Compared sector (NACE): 272
Number of companies: 12
Size (Sales Figure) : > 40.000.000,00
Euros
Comments on the
sectorial comparative
Compared to its sector the assets of the companies show an inferior
proportion of fixed assets. Specifically the difference with the sector average
is -27,91% , which means a relative difference of -70,42% .
In liabilities composition the company appeals on a wider scale to self
financing, being the proportion of net worth of 14,91% inferior, which means a
relative difference of 29,79% 14,91% more than the sector, which means a
difference of 29,85% .
The proportion that the sales mean to the company’s total ordinary
income is 99,47%, 0,18% lower than in the sector, which means a relative
difference of 0,18% .
The company’s EBIT was positive and was 2,63% with regard to the total
ordinary income, 5,38% less than the sector, which means a relative difference
of 67,18% .
The company’s capacity to generate operating income is equal to that of
the sector as its ratio EBIT/Sales is also equal.
The company’s net result was positive and equal to 1,49% with regard to
the total ordinary income, 3,77% less than the sector, which means a relative
difference of 71,62% .
ADDRESSES
Current Legal Seat Address:
CALLE TRES CRUCES, 8
01400
LLODIO ÁLAVA
Characteristics of
the current address
Type of premises: oficina, factoria,
almacén
Property: el local está compartido
Property Description: Tubacex, S.A.
Local Situation: principal
CORPORATE STRUCTURE
ADMINISTRATIVE LINKS
Main Board members,
Directors and Auditor ![]()
|
POSITION |
SURNAMES AND
NAME |
APPOINTMENT DATE |
|
|
PRESIDENTE |
VIDEGAIN MURO ALVARO |
07/03/2007 |
|
|
CONSEJERO |
GARTEIZGOGEASCOA IGUAIN JUAN ANTONIO |
07/03/2007 |
|
|
CONSEJERO |
MARCO GARDOQUI IBANEZ IGNACIO |
07/03/2007 |
|
|
CONSEJERO |
NEGRO PARRAGA OSCAR |
07/03/2007 |
|
|
CONSEJERO |
ERICH HERTNER |
07/03/2007 |
|
|
CONSEJERO |
FERNANDEZ MUINOS MANUEL |
07/03/2007 |
|
|
CONSEJERO |
RUIZ LONGARTE PEREZ GUILLERMO |
07/03/2007 |
|
|
CONSEJERO |
IRIBECAMPOS ZUBIA JUAN JOSE |
01/08/2007 |
|
|
AUDITOR |
APPOINTMENT DATE |
||
|
KPMG AUDITORES SL |
01/08/2007 |
||
Functional Managers
|
POSITION |
SURNAMES AND
NAME |
|
Director general |
RUIZ-LONGARTE GUILLERMO |
|
Director financiero |
ROBLES MOLLINEDO JAVIER |
|
Director de rrhh |
AZLOR ANTON |
|
Director comercial |
LAZARO MIKEL |
|
Director de compras |
CARBAJO PEDRO |
|
Director de operaciones |
CANIVELL RAMON |
FINANCIAL LINKS
|
|
BUSINESS NAME |
CIF / COUNTRY |
% |
SOURCE |
DATA INF. |
|
|
TUBACEX SA |
ESPAÑA |
99,99 |
F.PROPIAS |
29/01/2008 |
CREDIT INFORMATION
Constitution Date: 21/05/1993
Business activity 
Activity: Mfg. of steel tubes
NACE Code: 2722
NACE Activity: Manufacture of
steel tubes
Business: FABRICACION Y VENTA DE TUBOS DE ACERO INOXIDABLE,
DE OTROS ACEROS ESPECIALES Y DE ALTAS ALEACIONES, INCLUIDOS LOS TUBOS
BIMETALICOS, ASI COMO DE CUALQUIER OTRO PRODUCTO ESPECIFICO Y COMPLEMENTARIO.
Employees 
Number of total employees: 580 (2008)
Number of fixed employees: 100,00%
Number of temporary employees: 0,00%
Employees evolution

COMMERCIAL OPERATIONS 
SUPPLIERS
|
BUSINESS NAME |
INTERNATIONAL |
|
ACERIA DE ALAVA |
NO |
|
ACERIA DE ALAVA
SA |
NO |
|
SALEM TRUBE INC |
SI |
|
TUBACEX INC |
SI |
|
COMERCIAL DE
TUBOS Y ACCESORIOS ESPECIALES SA |
NO |
|
TUBACEX |
NO |
|
TUBOS MECANICOS
SA |
NO |
|
TUBACEX TAYLOR
ACCESORIOS SA |
SI |
|
SBER A.G. |
SI |
|
TUBACEX SA |
NO |
17 proveedores
SALES
Collection (estimated):
Export Percentage: 85%
Exports to: Inglaterra, Italia, Rusia, Canadá y stados Unidos
National Distribution: 15%
CLIENTS
|
BUSINESS NAME |
INTERNATIONAL |
|
TUBACEX SA |
NO |
|
ALTX INC. |
SI |
|
COTUBES CANADA
INC |
SI |
|
ALEC INC |
SI |
|
SALEM TUBE, INC |
SI |
|
COMERCIAL DE
TUBOS YA CCESORIOS ESPECIALES SA |
NO |
|
MIS METAUX INOX |
SI |
|
SCHOELLER-BLECKMANN
EDELSTAHLROHR AG |
SI |
|
SCHOELLER
-BLECKAMANN EDELSTAHRO |
SI |
|
SBER PHONIX KFT. |
SI |
23 clientes
Banks 
|
ENTITY |
BRANCH |
ADDRESS |
TOWN OR CITY |
PROVINCE |
|
BANCO BILBAO VIZCAYA ARGENTARIA, S.A. |
|
|
BILBAO |
|
|
BANCO DE SABADELL, S.A. |
|
|
BILBAO |
|
|
BANCO SANTANDER, S.A. |
|
|
BILBAO |
|
3 bank entities registered
Brands, Signs and Commercial
Names 
ANAGRAM: TTI
FORMER NAMES:
•
TUBACEX TUBOS INOXIDABLES SL
LEGAL STRUCTURE
Constitution Data
Register Date: 21/05/1993
Register town: Álava
Announcement number: 247668
Legal form: SOCIEDAD LIMITADA
Social Capital: 3.005,06 €
Current Legal Form: SOCIEDAD ANONIMA
Current Capital:
15.028.005,00 €
Legal Aspects
Obligation to fill in Financial
Statements: YES
Chamber census: YES (2005)
Listed on a Stock Exchange: NO
B.O.R.M.E.(Official Companies Registry
Gazette) 
Registered Proceedings
|
PROCEEDINGS |
DATE |
NOTICE NUM. |
TRADE REG. |
|
Nombramientos |
06/03/2008 |
126646 |
Álava |
|
Reelecciones |
01/08/2007 |
402813 |
Álava |
|
Nombramientos |
01/08/2007 |
402812 |
Álava |
|
Reelecciones |
07/03/2007 |
133839 |
Álava |
Other Proceedings published
|
PROCEEDINGS |
DATE |
NOTICE NUM. |
TRADE REG. |
|
Depósito de cuentas (2006) Individual |
25/07/2007 |
233087 |
Álava |
Press articles

19/06/2007 EXPANSION DEL PAIS VASCO (INFORMACIÓN GENERAL)
LAS FILIALES DE TUBACEX TTI Y ACERALAVA HAN OBTENIDO LA CERTIFICACION
OSHAS 18001 -NORMA ESTANDARIZADA DE MAXIMO RECONOCIMIENTO INTERNACIONAL- EN SUS
SISTEMAS DE GESTION EN PREVENCION DE RIESGOS LABORALES.
20/02/2003 EXPANSIÓN (INFORMACIÓN ÓRGANO DE ADMINISTRACIÓN)
ANTON AZLOR HA SIDO NOMBRADO DIRECTOR DE GESTION DE PERSONAS Y ORGANIZACION DE LAS FILIALES TUBACEX TUBOS INOXIDABLES Y ACERIA DE ALAVA, Y ADJUNTO A LA PRESIDENCIA DEL GRUPO TUBACEX.
FINANCIAL INFORMATION
The information on the last account contained in this report is
extracted from the Mercantile Register file of the legal address of the Company
and dated 27/07/2007.
BALANCE SHEET
Assets
Figures given in €
|
|
31/12/2004 (12) |
31/12/2005 (12) |
31/12/2006 (12) |
|
A) ACCIONISTAS (SOCIOS) POR DESEMBOLSOS NO
EXIGIDOS |
|
|
|
|
B) INMOVILIZADO |
16.674.814,00 |
16.796.209,00 |
18.578.850,00 |
|
I. Gastos de establecimiento |
|
|
|
|
II. Inmovilizaciones inmateriales |
1.256.729,00 |
649.971,00 |
|
|
Gastos de investigación y desarrollo |
|
|
|
|
Concesiones, patentes, licencias, marcas y similares |
|
|
|
|
Fondo de comercio |
|
|
|
|
Derechos de traspaso |
|
|
|
|
Aplicaciones informáticas |
6.343.663,00 |
6.873.299,00 |
6.873.299,00 |
|
Derechos s/bienes en régimen de arrendamiento financiero |
|
|
|
|
Anticipos |
|
|
|
|
Provisiones |
|
|
|
|
Amortizaciones |
-5.086.934,00 |
-6.223.328,00 |
-6.873.299,00 |
|
III. Inmovilizaciones materiales |
13.717.806,00 |
14.751.264,00 |
17.097.707,00 |
|
Terrenos y construcciones |
|
|
|
|
Instalaciones técnicas y maquinaria |
53.773.374,00 |
57.894.292,00 |
63.985.203,00 |
|
Otras instalaciones, utillaje y mobiliario |
7.673.092,00 |
8.183.031,00 |
8.649.277,00 |
|
Anticipos e inmovilizaciones materiales en curso |
449.412,00 |
725.767,00 |
1.060.124,00 |
|
Otro inmovilizado |
|
|
|
|
Provisiones |
|
|
|
|
Amortizaciones |
-48.178.072,00 |
-52.051.826,00 |
-56.596.897,00 |
|
IV. Inmovilizaciones financieras |
1.700.279,00 |
1.394.974,00 |
1.481.143,00 |
|
Participaciones en empresas del grupo |
|
|
|
|
Créditos a empresas del grupo |
|
|
|
|
Participaciones en empresas asociadas |
|
|
|
|
Créditos a empresas asociadas |
|
|
|
|
Cartera de valores a largo plazo |
1.202,00 |
1.202,00 |
1.202,00 |
|
Otros créditos |
|
|
|
|
Depósitos y fianzas constituidos a largo plazo |
|
|
|
|
Provisiones |
|
|
|
|
Administraciones Públicas a largo plazo |
1.699.077,00 |
1.393.772,00 |
1.479.941,00 |
|
V. Acciones propias |
|
|
|
|
VI. Deudores por operaciones de tráfico a largo
plazo |
|
|
|
|
C) GASTOS A DISTRIBUIR EN VARIOS EJERCICIOS |
|
|
|
|
D) ACTIVO CIRCULANTE |
79.821.988,00 |
120.923.852,00 |
139.851.298,00 |
|
I. Accionistas por desembolsos exigidos |
|
|
|
|
II. Existencias |
34.573.189,00 |
53.317.246,00 |
52.525.542,00 |
|
Comerciales |
|
|
|
|
Materias primas y otros aprovisionamientos |
13.891.700,00 |
17.510.089,00 |
20.355.099,00 |
|
Productos en curso y semiterminados |
12.282.890,00 |
20.491.497,00 |
20.790.602,00 |
|
Productos terminados |
8.398.599,00 |
15.121.830,00 |
11.378.661,00 |
|
Subproductos residuos y materiales recuperados |
|
|
|
|
Anticipos |
|
193.830,00 |
1.180,00 |
|
Provisiones |
|
|
|
|
III. Deudores |
44.929.368,00 |
63.603.133,00 |
86.026.815,00 |
|
Clientes por ventas y prestaciones de servicios |
21.580.165,00 |
34.195.120,00 |
43.793.782,00 |
|
Empresas del grupo, deudores |
17.432.914,00 |
18.034.717,00 |
23.948.021,00 |
|
Empresas asociadas, deudores |
|
|
|
|
Deudores varios |
15.787,00 |
|
|
|
Personal |
|
|
|
|
Administraciones Públicas |
6.005.502,00 |
11.478.296,00 |
18.390.012,00 |
|
Provisiones |
-105.000,00 |
-105.000,00 |
-105.000,00 |
|
IV. Inversiones financieras temporales |
|
182.150,00 |
182.050,00 |
|
Participaciones en empresas del grupo |
|
|
|
|
Créditos a empresas del grupo |
|
|
|
|
Participaciones en empresas asociadas |
|
|
|
|
Créditos a empresas asociadas |
|
|
|
|
Cartera de valores a corto plazo |
|
|
|
|
Otros créditos |
|
182.150,00 |
182.050,00 |
|
Depósitos y fianzas constituidos a corto plazo |
|
|
|
|
Provisiones |
|
|
|
|
V. Acciones propias a corto plazo |
|
|
|
|
VI. Tesorería |
319.431,00 |
3.821.323,00 |
1.116.891,00 |
|
VII. Ajustes por periodificación |
|
|
|
|
TOTAL ACTIVO (A + B + C + D) |
96.496.802,00 |
137.720.061,00 |
158.430.148,00 |
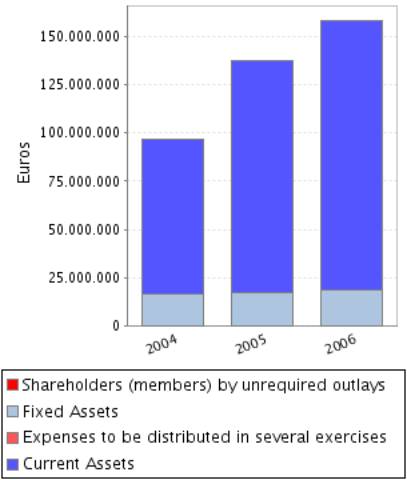
Assets composition

Liabilities
Figures given in €
|
|
31/12/2004 (12) |
31/12/2005 (12) |
31/12/2006 (12) |
|
A) FONDOS PROPIOS |
48.659.200,00 |
52.706.460,00 |
55.664.464,00 |
|
I. Capital suscrito |
15.028.005,00 |
15.028.005,00 |
15.028.005,00 |
|
II. Prima de emisión |
|
|
|
|
III. Reserva de revalorización |
313.832,00 |
313.832,00 |
313.832,00 |
|
IV. Reservas |
31.796.498,00 |
33.317.363,00 |
37.364.623,00 |
|
Reserva legal |
3.005.665,00 |
3.005.665,00 |
3.005.665,00 |
|
Reservas para acciones propias |
|
|
|
|
Reservas para acciones de la sociedad dominante |
|
|
|
|
Reservas estatutarias |
|
|
|
|
Otras reservas |
28.790.530,00 |
30.311.395,00 |
34.358.655,00 |
|
Diferencias por ajuste del capital a euros |
303,00 |
303,00 |
303,00 |
|
V. Resultados de ejercicios anteriores |
|
|
|
|
Remanente |
|
|
|
|
Resultados negativos de ejercicios anteriores |
|
|
|
|
Aportaciones de
socios para compensación de pérdidas |
|
|
|
|
VI. Pérdidas y
Ganancias (beneficio o pérdida) |
2.120.985,00 |
4.647.380,00 |
3.558.124,00 |
|
VII. Dividendo a
cuenta entregado en el ejercicio |
-600.120,00 |
-600.120,00 |
-600.120,00 |
|
VIII. Acciones
propias para reducción de capital |
|
|
|
|
B) INGRESOS A
DISTRIBUIR EN VARIOS EJERCICIOS |
|
|
|
|
Subvenciones de
capital |
|
|
|
|
Diferencias
positivas de cambio |
|
|
|
|
Otros ingresos a
distribuir en varios ejercicios |
|
|
|
|
Ingresos
fiscales a distribuir en varios ejercicios |
|
|
|
|
C) PROVISIONES
PARA RIESGOS Y GASTOS |
1.533.615,00 |
921.215,00 |
867.549,00 |
|
Provisiones para
pensiones y obligaciones similares |
1.533.615,00 |
921.215,00 |
867.549,00 |
|
Provisiones para
impuestos |
|
|
|
|
Otras
provisiones |
|
|
|
|
Fondo de
reversión |
|
|
|
|
D) ACREEDORES A
LARGO PLAZO |
646.399,00 |
1.175.947,00 |
1.009.740,00 |
|
I. Emisiones de
obligaciones y otros valores negociables |
|
|
|
|
Obligaciones no
convertibles |
|
|
|
|
Obligaciones
convertibles |
|
|
|
|
Otras deudas
representadas en valores negociables |
|
|
|
|
II. Deudas con
entidades de crédito |
646.399,00 |
1.175.947,00 |
1.009.740,00 |
|
Deudas a largo
plazo con entidades de crédito |
646.399,00 |
1.175.947,00 |
1.009.740,00 |
|
Acreedores por
arrendamiento financiero a largo plazo |
|
|
|
|
III. Deudas con
empresas del grupo y asociadas |
|
|
|
|
Deudas con
empresas del grupo |
|
|
|
|
Deudas con
empresas asociadas |
|
|
|
|
IV. Otros
acreedores |
|
|
|
|
Deudas
representadas por efectos a pagar |
|
|
|
|
Otras deudas |
|
|
|
|
Fianzas y
depósitos recibidos a largo plazo |
|
|
|
|
Administraciones
Públicas a largo plazo |
|
|
|
|
V. Desembolsos
pendientes sobre acciones no exigidos |
|
|
|
|
De empresas del
grupo |
|
|
|
|
De empresas
asociadas |
|
|
|
|
De otras
empresas |
|
|
|
|
VI. Acreedores
por operaciones de tráfico a largo plazo |
|
|
|
|
E) ACREEDORES A
CORTO PLAZO |
45.657.588,00 |
82.916.439,00 |
100.888.395,00 |
|
I. Emisiones de
obligaciones y otros valores negociables |
|
|
|
|
Obligaciones no convertibles |
|
|
|
|
Obligaciones convertibles |
|
|
|
|
Otras deudas representadas en valores negociables |
|
|
|
|
Intereses de obligaciones y otros valores |
|
|
|
|
II. Deudas con entidades de crédito |
30.246.105,00 |
32.872.386,00 |
41.934.990,00 |
|
Préstamos y otras deudas |
30.190.362,00 |
32.780.254,00 |
41.809.074,00 |
|
Deudas por intereses |
55.743,00 |
92.132,00 |
125.916,00 |
|
Acreedores por arrendamiento financiero a corto plazo |
|
|
|
|
III. Deudas con empresas del grupo y asociadas a
corto plazo |
2.531.397,00 |
31.460.976,00 |
39.006.712,00 |
|
Deudas con empresas del grupo |
2.531.397,00 |
31.460.976,00 |
39.006.712,00 |
|
Deudas con empresas asociadas |
|
|
|
|
IV. Acreedores comerciales |
7.646.988,00 |
11.910.719,00 |
11.777.454,00 |
|
Anticipos recibidos por pedidos |
|
|
|
|
Deudas por compras o prestaciones de servicios |
7.646.988,00 |
11.910.719,00 |
11.777.454,00 |
|
Deudas representadas por efectos a pagar |
|
|
|
|
V. Otras deudas no comerciales |
4.922.631,00 |
6.115.358,00 |
7.588.894,00 |
|
Administraciones Públicas |
1.771.099,00 |
2.343.112,00 |
2.951.427,00 |
|
Deudas representadas
por efectos a pagar |
|
|
|
|
Otras deudas |
31.745,00 |
75.602,00 |
90.643,00 |
|
Remuneraciones
pendientes de pago |
3.119.787,00 |
3.696.644,00 |
4.546.824,00 |
|
Fianzas y
depósitos recibidos a corto plazo |
|
|
|
|
VI. Provisiones
para operaciones de tráfico |
310.467,00 |
557.000,00 |
580.345,00 |
|
VII. Ajustes por
periodificación |
|
|
|
|
F) PROVISIONES PARA RIESGOS Y GASTOS A CORTO
PLAZO |
|
|
|
|
TOTAL PASIVO (A + B + C + D + E + F) |
96.496.802,00 |
137.720.061,00 |
158.430.148,00 |
Liabilities Composition


PROFIT AND LOSS ACCOUNT
Itams of the Profit
and Loss Account
Figures given in €
|
|
31/12/2004 (12) |
31/12/2005 (12) |
31/12/2006 (12) |
|
A) GASTOS (A.1 a A.16) |
154.556.686,00 |
201.776.527,00 |
236.954.214,00 |
|
A.1. Reducción
de existencias de productos terminados y en curso de fabricación |
|
|
3.444.064,00 |
|
A.2.
Aprovisionamientos |
93.485.731,00 |
131.152.896,00 |
158.813.217,00 |
|
Consumo de
mercaderías |
|
|
|
|
Consumo de
materias primas y otras materias consumibles |
91.904.647,00 |
129.268.935,00 |
156.846.498,00 |
|
Otros gastos
externos |
1.581.084,00 |
1.883.961,00 |
1.966.719,00 |
|
A.3. Gastos de personal |
25.938.577,00 |
28.645.690,00 |
32.168.915,00 |
|
Sueldos,
salarios y asimilados |
17.802.816,00 |
19.882.254,00 |
22.560.111,00 |
|
Cargas sociales |
8.135.761,00 |
8.763.436,00 |
9.608.804,00 |
|
A.4. Dotaciones
para amortizaciones de inmovilizado |
4.946.592,00 |
5.432.730,00 |
5.651.784,00 |
|
A.5. Variación de las provisiones de tráfico |
257.593,00 |
246.533,00 |
23.345,00 |
|
Variación de provisiones de existencias |
|
|
23.345,00 |
|
Variación de provisiones y pérdidas de créditos incobrables |
|
|
|
|
Variación de otras provisiones de tráfico |
257.593,00 |
246.533,00 |
|
|
A.6. Otros gastos de explotación |
24.848.146,00 |
30.772.458,00 |
31.703.931,00 |
|
Servicios exteriores |
24.792.747,00 |
30.693.343,00 |
31.614.644,00 |
|
Tributos |
55.399,00 |
79.115,00 |
89.287,00 |
|
Otros gastos de gestión corriente |
|
|
|
|
Dotación al fondo de reversión |
|
|
|
|
A.I. BENEFICIOS
DE EXPLOTACION (B.1+B.2+B.3+B.4-A.1-A.2-A.3-A.4-A.5-A.6) |
5.275.606,00 |
7.919.517,00 |
6.254.894,00 |
|
A.7. Gastos
financieros y gastos asimilados |
901.483,00 |
1.010.791,00 |
1.742.915,00 |
|
Por deudas con
empresas del grupo |
|
|
|
|
Por deudas con
empresas asociadas |
|
|
|
|
Por otras deudas
Por deudas con terceros y gastos asimilados |
901.483,00 |
1.010.791,00 |
1.742.915,00 |
|
Pérdidas de
inversiones financieras |
|
|
|
|
A.8. Variación
de las provisiones de inversiones financieras |
|
|
|
|
A.9. Diferencias
negativas de cambio |
2.622.199,00 |
2.856.773,00 |
2.561.380,00 |
|
A.II. RESULTADOS
FINANCIEROS POSITIVOS (B.5+B.6+B.7+B.8-A.7-A.8-A.9) |
|
|
|
|
A.III.
BENEFICIOS DE LAS ACTIVIDADES ORDINARIAS (A.I+A.II-B.I-B.II) |
3.677.350,00 |
6.306.036,00 |
4.402.787,00 |
|
A.10. Variación de
las provisiones de inmovilizado inmaterial, material y cartera de control |
|
|
|
|
A.11. Pérdidas
procedentes del inmovilizado inmaterial, material y cartera de control |
283.687,00 |
391.411,00 |
417.756,00 |
|
A.12. Pérdidas
por operaciones con acciones y obligaciones propias |
|
|
|
|
A.13. Gastos
extraordinarios |
667.633,00 |
|
|
|
A.14. Gastos y
pérdidas de otros ejercicios |
|
|
|
|
A.IV. RESULTADOS
EXTRAORDINARIOS POSITIVOS (B.9+B.10+B.11+B.12+B.13-A.10-A.11-A.12-A.13-A.14) |
|
|
|
|
A.V. BENEFICIOS
ANTES DE IMPUESTOS (A.II+A.IV-B.III-B.IV.) |
2.726.030,00 |
5.914.625,00 |
3.985.031,00 |
|
A.15. Impuesto
sobre Sociedades |
605.045,00 |
1.267.245,00 |
426.907,00 |
|
A.16. Otros
impuestos |
|
|
|
|
A.VI. RESULTADO
DEL EJERCICIO (BENEFICIOS) (A.V-A.15-A.16) |
2.120.985,00 |
4.647.380,00 |
3.558.124,00 |
|
B) INGRESOS (B.1
a B.13) |
156.677.671,00 |
206.423.907,00 |
240.512.338,00 |
|
B.1. Importe
neto de la cifra de negocios |
150.974.456,00 |
187.893.175,00 |
236.792.817,00 |
|
Ventas |
150.974.456,00 |
187.893.175,00 |
236.792.817,00 |
|
Prestaciones de
servicios |
|
|
|
|
Devoluciones y
“rappels” sobre ventas |
|
|
|
|
B.2. Aumento de
existencias de productos terminados y en curso de fabricación |
2.934.224,00 |
14.931.839,00 |
|
|
B.3. Trabajos
efectuados por la empresa para el inmovilizado |
|
|
1.267.333,00 |
|
B.4. Otros
ingresos de explotación |
843.565,00 |
1.344.810,00 |
|
|
Ingresos
accesorios y otros de gestión corriente |
843.565,00 |
1.344.810,00 |
|
|
Subvenciones |
|
|
|
|
Exceso de provisiones de riesgos y gastos |
|
|
|
|
B.I. PÉRDIDAS DE
EXPLOTACIÓN (A.1+A.2+A.3+A.4+A.5+A.6-B.1-B.2-B.3-B.4) |
|
|
|
|
B.5. Ingresos de
participaciones en capital |
|
|
|
|
En empresas del
grupo |
|
|
|
|
En empresas
asociadas |
|
|
|
|
En empresas
fuera del grupo |
|
|
|
|
B.6. Ingresos de
otros valores negociables y de créditos del activo inmovilizado |
|
|
|
|
De empresas del
grupo |
|
|
|
|
De empresas
asociadas |
|
|
|
|
De empresas
fuera del grupo |
|
|
|
|
B.7. Otros
intereses e ingresos asimilados |
4.338,00 |
22.899,00 |
67.296,00 |
|
De empresas del
grupo |
|
|
|
|
De empresas
asociadas |
|
|
|
|
Otros intereses |
4.338,00 |
22.899,00 |
67.296,00 |
|
Beneficios en
inversiones financieras |
|
|
|
|
B.8. Diferencias
positivas de cambio |
1.921.088,00 |
2.231.184,00 |
2.384.892,00 |
|
B.II. RESULTADOS
FINANCIEROS NEGATIVOS (A.7+A.8+A.9-B.5-B.6-B.7-B.8) |
1.598.256,00 |
1.613.481,00 |
1.852.107,00 |
|
B.III. PÉRDIDAS
DE LAS ACTIVIDADES ORDINARIAS (B.I+B.II-A.I-A.II) |
|
|
|
|
B.9. Beneficios
en enajenación de inmovilizado inmaterial, material y cartera de control |
|
|
|
|
B.10. Beneficios
por operaciones con acciones y obligaciones propias |
|
|
|
|
B.11.
Subvenciones de capital transferidas al resultado del ejercicio |
|
|
|
|
B.12. Ingresos
extraordinarios |
|
|
|
|
B.13. Ingresos y
beneficios de otros ejercicios |
|
|
|
|
B.IV. RESULTADOS
EXTRAORDINARIOS NEGATIVOS (A.10+A.11+A.12+A.13+A.14-B.9-B.10-B.11-B.12-B.13) |
951.320,00 |
391.411,00 |
417.756,00 |
|
B.V. PÉRDIDAS
ANTES DE IMPUESTOS (B.III+B.IV-A.III-A.IV) |
|
|
|
|
B.VI. RESULTADO
DEL EJERCICIO (PERDIDAS) (B.V+A.15+A.16) |
|
|
|
Composition of the
Profit and Loss Account


FINANCIAL BALANCE
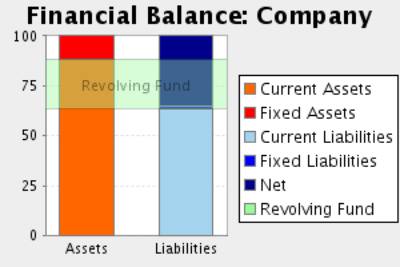
Here the Main Capital Amounts of the company and the Revolving Fund
Evolution are analysed.
Financial Balance
Table
Figures given in €
|
|
31/12/2004 (12) |
% |
31/12/2005 (12) |
% |
31/12/2006 (12) |
% |
|
A) ACCIONISTAS (SOCIOS) POR DESEMBOLSOS NO EXIGIDOS |
|
|
|
|
|
|
|
B) INMOVILIZADO |
16.674.814,00 |
17,28 |
16.796.209,00 |
12,20 |
18.578.850,00 |
11,73 |
|
C) GASTOS A DISTRIBUIR EN VARIOS EJERCICIOS |
|
|
|
|
|
|
|
D) ACTIVO CIRCULANTE |
79.821.988,00 |
82,72 |
120.923.852,00 |
87,80 |
139.851.298,00 |
88,27 |
|
TOTAL ACTIVO (A + B + C + D) |
96.496.802,00 |
|
137.720.061,00 |
|
158.430.148,00 |
|
|
|
||||||
|
A) FONDOS PROPIOS |
48.659.200,00 |
50,43 |
52.706.460,00 |
38,27 |
55.664.464,00 |
35,14 |
|
B) INGRESOS A DISTRIBUIR EN VARIOS EJERCICIOS |
|
|
|
|
|
|
|
C) PROVISIONES PARA RIESGOS Y GASTOS |
1.533.615,00 |
1,59 |
921.215,00 |
0,67 |
867.549,00 |
0,55 |
|
D) ACREEDORES A LARGO PLAZO |
646.399,00 |
0,67 |
1.175.947,00 |
0,85 |
1.009.740,00 |
0,64 |
|
E) ACREEDORES A CORTO PLAZO |
45.657.588,00 |
47,32 |
82.916.439,00 |
60,21 |
100.888.395,00 |
63,68 |
|
F) PROVISIONES PARA RIESGOS Y GASTOS A CORTO PLAZO |
|
|
|
|
|
|
|
TOTAL PASIVO (A + B + C + D + E + F) |
96.496.802,00 |
|
137.720.061,00 |
|
158.430.148,00 |
|
Financial Balance
Composition


Comments on Financial
Balance
In the 2004, the assets of the company were formed in 17,28% of Fixed
Assets and in 82,72% of Current Assets.This assets were financed in 50,43% with
own capitals, and in 2,26% with long term debt and in 47,32% with current
liabilities.
The result of this financial structure is a positive turnover fund of
34.164.400,00 Euros, which is equivalent to 35,40% proportion of the
company’s total assets.
In the 2005, the assets of the company were formed in 12,20% of Fixed
Assets and in 87,80% of Current Assets.This assets were financed in 38,27% with
own capitals, and in 1,52% with long term debt and in 60,21% with current
liabilities.
The result of this financial structure is a positive turnover fund of
38.007.413,00 Euros, which is equivalent to 27,60% proportion of the
company’s total assets.
This measure has increased with respect to the previous exercise in
11,25% having, however, diminished its proportion with respect to the total
assets of the company.
In the 2006, the assets of the company were formed in 11,73% of Fixed
Assets and in 88,27% of Current Assets.This assets were financed in 35,14% with
own capitals, and in 1,18% with long term debt and in 63,68% with current
liabilities.
The result of this financial structure is a positive turnover fund of
38.962.903,00 Euros, which is equivalent to 24,59% proportion of the
company’s total assets.
This measure has increased with respect to the previous exercise in
2,51% having, however, diminished its proportion with respect to the total
assets of the company.
RATIOS
Main Ratios
|
|
31/12/2004 (12) |
31/12/2005 (12) |
31/12/2006 (12) |
|
STRUCTURAL RATIOS |
|
|
|
|
Fondo maniobra |
34.164.400,00 |
38.007.413,00 |
38.962.903,00 |
|
Necesidad fondo maniobra |
64.091.074,00 |
66.876.326,00 |
79.598.952,00 |
|
Endeudamiento (%) |
49,57 |
61,73 |
64,86 |
|
Fondos ajenos sobre fondos propios |
0,98 |
1,61 |
1,85 |
|
GENERAL ACTIVITY RATIO |
|
|
|
|
Crecimiento de la cifra de negocio (%) |
37,44 |
24,45 |
26,02 |
|
Crecimiento valor añadido (%) |
14,77 |
16,00 |
4,39 |
|
Cash flow |
7.325.170,00 |
10.326.643,00 |
9.233.253,00 |
|
Productividad de la mano de obra |
1,40 |
1,48 |
1,37 |
|
Rotación de activos |
1,56 |
1,36 |
1,50 |
|
Punto muerto |
138.745.103,84 |
168.712.971,41 |
218.416.553,08 |
|
Margen de seguridad del punto muerto (%) |
8,61 |
10,85 |
8,25 |
|
ACTIVITY RATIOS |
|
|
|
|
Periodo medio de pago |
30 |
37 |
26 |
|
Periodo medio de cobro |
107 |
122 |
131 |
|
Periodo de rotación de inventario |
82 |
102 |
80 |
|
SOLVENCY RATIOS |
|
|
|
|
Capacidad devolución |
0,15 |
0,12 |
0,09 |
|
Garantía de activo |
2,02 |
1,62 |
1,54 |
|
Proporción de deudas a corto plazo (%) |
95,44 |
97,53 |
98,17 |
|
Cobertura de intereses |
2,74 |
-6,79 |
3,89 |
|
LIQUIDITY RATIOS |
|
|
|
|
Ratio corriente |
1,75 |
1,46 |
1,39 |
|
Liquidez inmediata |
0,01 |
0,05 |
0,01 |
|
Tesorería |
-29.926.674,00 |
-28.868.913,00 |
-40.636.049,00 |
|
Ventas sobre activo circulante |
681 |
559 |
610 |
Results Analysis
Ratios
|
|
31/12/2004 (12) |
31/12/2005 (12) |
31/12/2006 (12) |
|
Rentabilidad económica (%) |
5,47 |
5,75 |
3,95 |
|
Rentabilidad de explotación (%) |
3,49 |
4,22 |
2,64 |
|
Apalancamiento financiero |
1,38 |
2,08 |
2,00 |
|
Rentabilidad financiera (%) |
4,36 |
8,82 |
6,39 |
|
Rentabilidad general (%) |
1,40 |
2,47 |
1,50 |
Comments on the Results
Analysis Ratios
The economic profitability in the year2005 achieved a 5,75% positive
level, due to a 4,22% economic margin and to an assets turnover of1,36%.
The economic profitability in the year has increased from 5,47% up to
5,75%. This growth is due to the economic margin increase, from 3,49% to the
current 4,22% in spite of the assets turnover drop, which have decreased from
1,56 to 1,36%.
Financial profitability on 2005 achieved a 8,82%.
The company’s financial structure has instigated its economic
profitability with an indebtedness level of 2,08.
The general profitability on 2005 achieved a 2,47%.
The economic profitability in the year2006 achieved a 3,95% positive
level, due to a 2,64% economic margin and to an assets turnover of1,50%.
The economic profitability in the year has reduced from 5,75% up to
3,95% of2006, even if it remains positive. Assets turnover increase whose index
has passed from 1,36 to 1,50, could not compensate operating profitability
reduction from4,22% to the current level of 2,64%.
Financial profitability on 2006 achieved a 6,39%.
The company’s financial structure has instigated its economic
profitability with an indebtedness level of 2,00.
The general profitability on 2006 achieved a 1,50%.
SECTORIAL ANÁLYSIS
Large Capital Amounts
and Financial Balance
Figures given in %
|
|
COMPANY (2006) |
SECTOR |
DIFFERENCE |
DIFFERENCE RELATIVE |
|
|
|
|
|
|
ASSETS |
|
|
|
|
|
|
|
|
|
|
A) ACCIONISTAS (SOCIOS) POR DESEMBOLSOS NO EXIGIDOS |
|
0,00 |
|
|
|
|
|
|
|
|
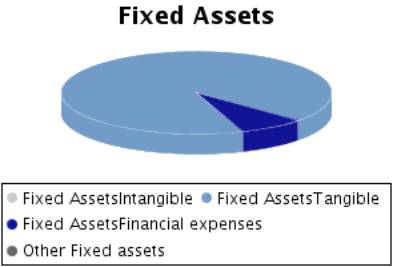
B) INMOVILIZADO |
11,73 |
39,64 |
-27,91 |
-70,41 |
|
|
|
|
|
|
C) GASTOS A DISTRIBUIR EN VARIOS EJERCICIOS |
|
0,05 |
|
|
|
|
|
|
|
|
D) ACTIVO CIRCULANTE |
88,27 |
60,32 |
27,96 |
46,35 |
|
|
|
|
|
|
TOTAL ACTIVO (A + B + C + D) |
100 |
100 |
|
|
|
|
|
|
|
|
|
|
|
|
|
|
|
|
|
|
|
|
COMPANY (2006) |
SECTOR |
DIFFERENCE |
DIFFERENCE RELATIVE |
|
|
|
|
|
|
LIABILITIES |
|
|
|
|
|
|
|
|
|
|
A) FONDOS PROPIOS |
35,14 |
48,66 |
-13,52 |
-27,79 |
|
|
|
|
|
|
B) INGRESOS A DISTRIBUIR EN VARIOS EJERCICIOS |
|
1,38 |
|
|
|
|
|
|
|
|
C) PROVISIONES PARA RIESGOS Y GASTOS |
0,55 |
2,62 |
-2,07 |
-78,99 |
|
|
|
|
|
|
D) ACREEDORES A LARGO PLAZO |
0,64 |
9,19 |
-8,55 |
-93,03 |
|
|
|
|
|
|
E) ACREEDORES A CORTO PLAZO |
63,68 |
38,15 |
25,53 |
66,92 |
|
|
|
|
|
|
F) PROVISIONES PARA RIESGOS Y GASTOS A CORTO PLAZO |
|
0,00 |
|
|
|
|
|
|
|
|
TOTAL PASIVO (A + B + C + D + E + F) |
100 |
100 |
|
|
|
|
|
|
|
Financial Balance
Composition
Comments to the
Sectorial Analysis
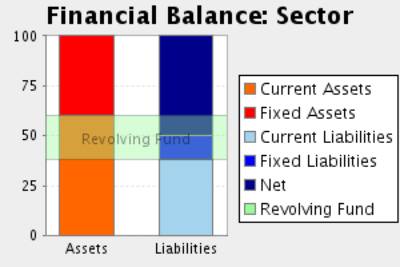
In the 2006, the assets of the company were formed in 11,73% of fixed
assets and in 88,27Current Assets % In the sector, the proportion of fixed
assets was of 39,68%, 70,44% superior, and the proportion of current assets was
of 60,32%, 46,35% inferior.
The assets were financed in the company in 35,14% with own capitals , in
1,18% with fixed liabilities and in 63,68% with current liabilities In the
sector, the self financing represented 50,05%, 29,78% superior. On the other
hand the long term debts represented in the sector an average of 11,80% financing,
with a relative difference of 90,00% favourable to the sectorAnd, short term
liabilities represented in the sector an average of 38,15% financing, with a
relative difference of 66,92% in favour of the company
The result of this company’s financial structure is a turnover fund that
represents 24,59% of the total assets; in the sector, this same proportion is
22,17%, therefore, we can say that the company’s turnover fund is 10,94% higher
than the one in of the sector.
Analytical Account of
Results
Figures given in %
|
|
COMPANY (2006) |
SECTOR |
DIFFERENCE |
DIFFERENCE RELATIVE |
|
Importe neto de
la cifra de negocios |
99,47 |
99,65 |
-0,18 |
-0,18 |
|
Otros ingresos
de explotación |
0,53 |
0,35 |
0,18 |
50,14 |
|
Valor de la
Producción |
100,00 |
100,00 |
0,00 |
0,00 |
|
Consumos
explotación |
68,16 |
61,50 |
6,66 |
10,83 |
|
Otros gastos
explotación |
13,32 |
13,85 |
-0,53 |
-3,85 |
|
Valor Añadido |
18,52 |
24,65 |
-6,13 |
-24,86 |
|
Gastos de
Personal |
13,51 |
13,20 |
0,31 |
2,32 |
|
Resultado
Económico Bruto |
5,01 |
11,44 |
-6,43 |
-56,21 |
|
Dotaciones para
amortizaciones de inmovilizado |
2,37 |
3,29 |
-0,92 |
-27,90 |
|
Variación de las
provisiones de tráfico y pérdidas de crédito incobrables |
0,01 |
0,15 |
-0,14 |
-93,29 |
|
Resultado
Económico Neto |
2,63 |
8,00 |
-5,38 |
-67,15 |
|
Ingresos
financieros |
1,03 |
0,88 |
0,15 |
17,58 |
|
Gastos
financieros |
1,81 |
1,58 |
0,23 |
14,56 |
|
Variación de las
provisiones de inv. financieras |
|
-0,01 |
|
|
|
Resultado
Actividades Ordinarias |
1,85 |
7,31 |
-5,46 |
-74,70 |
|
Ingresos
extraordinarios |
|
0,27 |
|
|
|
Gastos
extraordinarios |
0,18 |
0,48 |
-0,30 |
-62,81 |
|
Variación de las
provisiones de inmovilizado inmaterial, material y cartera de control |
|
-0,06 |
|
|
|
Resultado Antes
Impuestos |
1,67 |
7,15 |
-5,48 |
-76,65 |
|
Impuesto sobre
sociedades |
0,18 |
1,89 |
-1,71 |
-90,46 |
|
Resultado Neto |
1,49 |
5,27 |
-3,78 |
-71,71 |
|
Dotaciones para
amortizaciones de inmovilizado |
2,37 |
3,29 |
-0,92 |
-27,90 |
|
Variación de provisiones |
0,01 |
0,08 |
-0,07 |
-87,65 |
|
Autofinanciación Neta |
3,88 |
8,63 |
-4,75 |
-55,06 |
Main Ratios
|
|
COMPANY (2006) |
PTILE25 |
PTILE50 |
PTILE75 |
|
STRUCTURAL RATIOS |
|
|
|
|
|
Fondo maniobra |
38.962.903,00 |
10.215,48 |
16.595,05 |
35.795,00 |
|
Necesidad fondo
maniobra |
79.598.952,00 |
1.242,17 |
4.280,04 |
9.311,29 |
|
Endeudamiento
(%) |
64,86 |
36,00 |
48,63 |
62,00 |
|
Fondos ajenos
sobre fondos propios |
1,85 |
0,56 |
0,96 |
1,63 |
|
GENERAL ACTIVITY
RATIO |
|
|
|
|
|
Crecimiento de
la cifra de negocio (%) |
26,02 |
-3,94 |
5,12 |
21,68 |
|
Crecimiento
valor añadido (%) |
4,39 |
-26,67 |
1,16 |
22,44 |
|
Cash flow |
9.233.253,00 |
4.887,41 |
8.133,00 |
15.731,75 |
|
Productividad de
la mano de obra |
1,37 |
1,50 |
1,90 |
2,58 |
|
Rotación de activos |
1,50 |
1,05 |
1,31 |
1,67 |
|
Punto muerto |
218.416.553,08 |
55.536.480,72 |
80.900.681,05 |
157.906.874,21 |
|
Margen de seguridad del punto muerto (%) |
8,25 |
8,67 |
18,91 |
31,93 |
|
ACTIVITY RATIOS |
|
|
|
|
|
Periodo medio de
pago |
26 |
39 |
57 |
81 |
|
Periodo medio de
cobro |
131 |
64 |
80 |
116 |
|
Periodo de
rotación de inventario |
80 |
42 |
57 |
73 |
|
SOLVENCY RATIOS |
|
|
|
|
|
Capacidad
devolución |
0,09 |
0,12 |
0,25 |
0,41 |
|
Garantía de
activo |
1,54 |
1,61 |
2,07 |
2,79 |
|
Proporción de
deudas a corto plazo (%) |
98,17 |
72,84 |
83,89 |
96,93 |
|
Cobertura de
intereses |
3,89 |
4,60 |
10,57 |
15,89 |
|
LIQUIDITY RATIOS |
|
|
|
|
|
Ratio corriente |
1,39 |
1,41 |
1,56 |
1,68 |
|
Liquidez inmediata |
0,01 |
0,00 |
0,06 |
0,11 |
|
Tesorería |
-40.636.049,00 |
-12.030,47 |
-5.882,96 |
202,16 |
|
Ventas sobre
activo circulante |
610 |
618 |
854 |
1.056 |
Results Analysis
Ratios
|
|
COMPANY (2006) |
PTILE25 |
PTILE50 |
PTILE75 |
|
Rentabilidad económica (%) |
3,95 |
4,61 |
8,91 |
14,90 |
|
Rentabilidad de explotación (%) |
2,64 |
2,67 |
6,91 |
11,99 |
|
Apalancamiento financiero |
2,00 |
1,31 |
1,57 |
1,96 |
|
Rentabilidad financiera (%) |
6,39 |
5,69 |
10,80 |
19,03 |
|
Rentabilidad general (%) |
1,50 |
1,24 |
5,31 |
8,13 |
NOTES
ABOUT YOUR REQUEST.
The address included in your enquiry belongs to a postal address.
FOREIGN EXCHANGE
RATES
|
Currency |
Unit
|
Indian Rupees |
|
US Dollar |
1 |
Rs.43.30 |
|
UK Pound |
1 |
Rs.86.13 |
|
Euro |
1 |
Rs.68.72 |
RATING
EXPLANATIONS
|
RATING |
STATUS |
PROPOSED CREDIT LINE |
|
|
>86 |
Aaa |
Possesses an extremely sound financial base with the strongest capability
for timely payment of interest and principal sums |
Unlimited |
|
71-85 |
Aa |
Possesses adequate working capital. No caution needed for credit
transaction. It has above average (strong) capability for payment of interest
and principal sums |
Large |
|
56-70 |
A |
Financial & operational base are regarded healthy. General
unfavourable factors will not cause fatal effect. Satisfactory capability for
payment of interest and principal sums |
Fairly Large |
|
41-55 |
Ba |
Overall operation is considered normal. Capable to meet normal
commitments. |
Satisfactory |
|
26-40 |
B |
Unfavourable & favourable factors carry similar weight in credit
consideration. Capability to overcome financial difficulties seems comparatively
below average. |
Small |
|
11-25 |
Ca |
Adverse factors are apparent. Repayment of interest and principal sums
in default or expected to be in default upon maturity |
Limited with
full security |
|
<10 |
C |
Absolute credit risk exists. Caution needed to be exercised |
Credit not
recommended |
|
NR |
In view of the lack of information, we have no basis upon which to
recommend credit dealings |
No Rating |
|
This score serves as a reference to assess SC’s credit risk
and to set the amount of credit to be extended. It is calculated from a
composite of weighted scores obtained from each of the major sections of this
report. The assessed factors and their relative weights (as indicated through
%) are as follows:
Financial
condition (40%) Ownership
background (20%) Payment
record (10%)
Credit history
(10%) Market trend
(10%) Operational
size (10%)