![]()
MIRA
INFORM REPORT
|
Report Date : |
03.07.2008 |
IDENTIFICATION
DETAILS
|
Name : |
CDC HIACRE SA |
|
|
|
|
Registered Office : |
Avenida Paisos
Catalans - Lg Moli D En Fonolleda, S/N, Cp 08186, Llica D
Amunt Barcelona |
|
|
|
|
Country : |
Spain |
|
|
|
|
Financials (as on) : |
31.12.2006 |
|
|
|
|
Date of Incorporation : |
|
|
|
|
|
Legal Form : |
Joint Stock Company |
|
|
|
|
Line of Business : |
Wholesale of Iron and Steel |
RATING &
COMMENTS
|
MIRA’s Rating : |
A |
|
RATING |
STATUS |
PROPOSED CREDIT LINE |
|
|
56-70 |
A |
Financial & operational base are regarded healthy. General
unfavourable factors will not cause fatal effect. Satisfactory capability for
payment of interest and principal sums |
Fairly Large |
|
Maximum Credit Limit : |
1.292.500,57 € |
|
|
|
|
Status : |
Good |
|
|
|
|
Payment Behaviour : |
Regular |
|
|
|
|
Litigation : |
Clear |
FINANCIAL REPORT
CDC HIACRE SA
TAX NUMBER: A61030466
EXECUTIVE SUMMARY
Identification
Current Business Name: CDC HIACRE SA
Other names: YES
Current Address: AVENIDA PAISOS
CATALANS - LG MOLI D EN FONOLLEDA, S/N, CP 08186, LLICA D
AMUNT BARCELONA
Telephone number: 938415210 Fax: 938414434
URL: www.cdchiacre.com Corporate e-mail: cdchiacre@cdchiacre.com
Commercial Risk
Credit Appraisal: 1.292.500,57 €
Legal
Actions: NO
Financial Information
Latest Balance sheet sales (2006): 43.306.982,92 € (MERCANTILE REGISTER)
Result: 1.207.193,51 €
Total Assets: 30.455.925,42 €
Social Capital: 601.000,00 €
Employees: 44
Commercial Information
Constitution Date: 24/01/1996
Business activity: Wholesale of
iron & steel
NACE Code: 5152
International Operations: Imports
Corporate Structure
President:
Participations: 1
Credit Appraisal
Maximum Credit (from 0 a 6,000,000 €):
1.292.500,57 €
Rating Evolution
Financial Situation
Fiscal year2006
|
Treasury |
Excellent |
|
Indebtedness |
Average |
|
Profitability |
Average |
|
Balance |
Excellent |
Performance
|
Legal Actions |
None or Negligible |
|
Business
Trajectory |
Excellent |
INCIDENTS

Summary
LEGAL ACTIONS: No legal incidences registered
CLAIM FILED AGAINST THE ADMINISTRATION: No administrative
claims registered
AFFECTED BY:
1 Company / Companies in Insolvency Proceedings.
FINANCIAL ELEMENTS AND SECTORIAL
COMPARATIVE
FINANCIAL ELEMENTS
Figures given in €
|
|
2004 (12) |
2005 (12) |
2006 (12) |
% ASSETS |
|
|
|
|
|
|
BALANCE SHEET
ANALYSIS |
|
|
|
|
|
|
|
|
|
|
OWN FUNDS |
7.386.838,74 |
7.936.380,98 |
9.127.017,88 |
29,97 |
|
|
|
|
|
|
DEBT |
15.527.786,89 |
22.787.906,17 |
21.328.907,54 |
70,03 |
|
|
|
|
|
|
FIXED ASSETS |
633.558,58 |
2.535.594,11 |
4.302.189,74 |
14,13 |
|
|
|
|
|
|
TOTAL ASSETS |
22.914.625,63 |
30.724.287,15 |
30.455.925,42 |
|
|
|
|
|
|
|
|
|
|
|
|
|
|
|
|
|
|
|
2004 (12) |
2005 (12) |
2006 (12) |
% SALES |
|
|
|
|
|
|
PROFIT AND LOSS
ACCOUNT ANALYSIS |
|
|
|
|
|
|
|
|
|
|
SALES |
38.823.803,54 |
43.025.970,66 |
43.306.982,92 |
|
|
|
|
|
|
|
ADDED VALUE |
5.022.213,96 |
2.611.075,47 |
4.396.117,62 |
10,15 |
|
|
|
|
|
|
EBITDA |
3.426.655,28 |
1.015.144,98 |
2.624.401,80 |
6,06 |
|
|
|
|
|
|
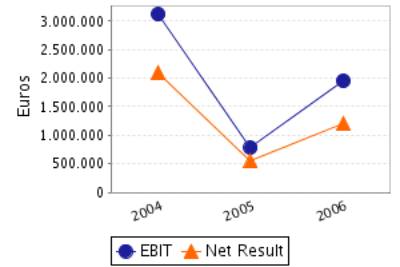
EBIT |
3.122.255,54 |
782.239,92 |
1.951.924,40 |
4,51 |
|
|
|
|
|
|
NET RESULT |
2.105.109,33 |
549.542,24 |
1.207.193,51 |
2,79 |
|
|
|
|
|
Balance Sheets Items Analysis
Balance Sheet
Comments
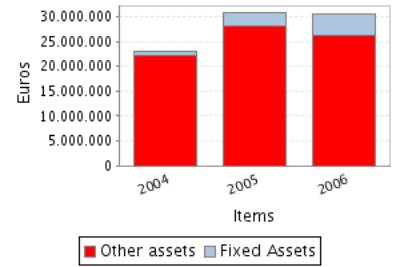
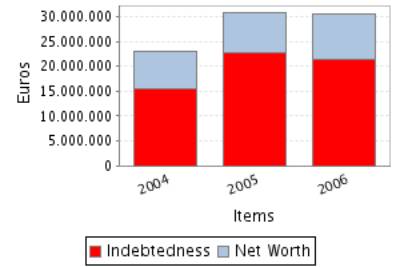
Total assets of the company grew 34,08% between 2004 and 2005.
This growth is a consequence of the fixed assets increase of 300,21%.
This growth has been mainly financed with a debt increase of 46,76%.
Nevertheless the net worth increased 7,44%.
Total assets of the company decreased in 0,87% between 2005 and 2006.
In spite of the decrease in the amount of total assets, fixed assets
grew 69,67%.
Assets reduction contrasts with net worth growth of 15,00%. Therefore,
the company’s indebtedness has reduced in 6,40%.
Profit and Loss Account Analysis
Profit and Loss
Account Comments
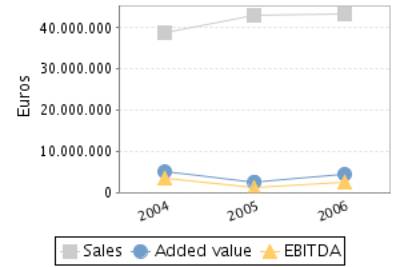
The company’s sales figure grew 10,82% between 2004 and 2005.
The company’s EBIT decreased in 74,95% between 2004 and 2005.
This evolution implies a reduction in the company’s operating
profitability.
The result of these variations is a decrease of the company’s Economic
Profitability of 81,31% in the analysed period, being this profitability of
2,55% in the year 2005.
The company’s Net Result decreased in 73,89% between 2004 and 2005.
This evolution, compared to the EBIT’s performance, implies that the
financial and extraordinary activities have had a positive effect in the
company’s Financial Profitability.
The result of these variations is a reduction of the company’s
profitability of 75,70% in the analysed period, being equal to 6,92% in the
year 2005.
The company’s sales figure grew 0,65% between 2005 and 2006.
The company’s EBIT grew 149,53% between 2005 and 2006.
This evolution implies an increase in the company’s operating
profitability.
The result of these variations is an increase of the company’s Economic
Profitability of 151,73% in the analysed period, being this profitability of
6,41% in the year 2006.
The company’s Net Result grew 119,67% between 2005 and 2006.
This evolution, compared to the EBIT’s performance, implies that the
financial and extraordinary activities have had a negative effect in the
company’s Financial Profitability.
The result of these variations is an increase of the company’s Economic
Profitability of 91,02% in the analysed period, being equal to 13,23% in the
year 2006.
ANNUAL FINANCIAL REPORT
ADDITIONAL DATA
Source: annual financial report 2006
Results Distribution
Figures given in €
|
DISTRIBUTION
BASE |
DISTRIBUTION TO |
||
|
Profit and Loss |
1.207.193,51 |
Retained earnings |
0,00 |
|
Carry Over |
0,00 |
Voluntary Reserve |
1.207.193,51 |
|
Voluntary reserves |
0,00 |
Prior years losses |
0,00 |
|
Reserves |
0,00 |
Carry Over |
0,00 |
|
Other concepts |
0,00 |
Other funds |
0,00 |
|
Total of Amounts to be distributed |
1.207.193,51 |
Dividends |
0,00 |
|
|
|
Other Applications |
0,00 |
Auditing
Auditors’ opinion: FAVOURABLE
Auditor: AVRP AUDITORES SL
COMPARATIVE SECTOR ANALYSIS
Values table
Figures expressed in %
|
|
COMPANY (2006) |
SECTOR |
DIFFERENCE |
DIFFERENCE RELATIVE |
|
|
|
|
|
|
BALANCE SHEET
ANALYSIS: % on the total assets |
|
|
|
|
|
|
|
|
|
|
OWN FUNDS |
29,97 |
40,28 |
-10,31 |
-25,59 |
|
|
|
|
|
|
DEBT |
70,03 |
59,72 |
10,31 |
17,26 |
|
|
|
|
|
|
FIXED ASSETS |
14,13 |
39,26 |
-25,13 |
-64,02 |
|
|
|
|
|
|
|
|
|
|
|
|
|
|
|
|
|
|
COMPANY (2006) |
SECTOR |
DIFFERENCE |
DIFFERENCE RELATIVE |
|
|
|
|
|
|
PROFIT AND LOSS
ACCOUNT ANALYSIS: % on the total operating income |
|
|
|
|
|
|
|
|
|
|
SALES |
99,93 |
99,44 |
0,49 |
0,50 |
|
|
|
|
|
|
ADDED VALUE |
10,14 |
5,38 |
4,76 |
88,38 |
|
|
|
|
|
|
EBIT |
4,50 |
2,14 |
2,36 |
110,48 |
|
|
|
|
|
|
NET RESULT |
2,79 |
1,76 |
1,03 |
58,64 |
|
|
|
|
|
Sector Composition
Compared sector (NACE): 515
Number of companies: 166
Size (Sales Figure) : > 40.000.000,00 Euros
Comments on the
sectorial comparative
Compared to its sector the assets of the companies show an inferior
proportion of fixed assets. Specifically the difference with the sector average
is -25,13% , which means a relative difference of -64,02% .
In liabilities composition the company appeals on a wider scale to self
financing, being the proportion of net worth of 10,31% inferior, which means a
relative difference of 25,59% 10,31% more than the sector, which means a
difference of 17,26% .
The proportion that the sales mean to the company’s total ordinary
income is 99,93%, 0,49% higher than in the sector, which means a relative
difference of 0,50% .
The company’s EBIT was positive and was 4,50% with regard to the total
ordinary income, 2,36% higher than in the sector, which means a relative
difference of 110,48% .
The company’s capacity to generate operating income is higher than the
one of the sector as its ratio EBIT/Sales is higher (ES Company versus ES
Sector).
The company’s net result was positive and equal to 2,79% with regard to
the total ordinary income, 1,03% higher than in the sector, which means a
relative difference of 58,64% .
The financial and extraordinary results and the tax impact have had a
negative impact on the Net result in the company with a worse behaviour than in
the sector; as a consequence, the company shows a worse Net Result/EBIT ratio
(REBEmpresa vs. REBSector).
ADDRESSES
Current Legal Seat Address:
AVENIDA PAISOS CATALANS - LG MOLI D EN FONOLLEDA, S/N
08186 LLICA D AMUNT BARCELONA
Previous Seat Address:
AVENIDA PAISOS CATALANS (MOLI DE FONOLLED), S/N
08186
LLICA D AMUNT BARCELONA
Characteristics
of the current address
Type of premises: warehouse
Property: owned; with no official confirmation
Local Situation: main
CORPORATE STRUCTURE
ADMINISTRATIVE LINKS
Main Board members,
Directors and Auditor ![]()
|
POSITION |
SURNAMES AND
NAME |
APPOINTMENT DATE |
|
|
PRESIDENT |
DEL VAL GARCIA MARIANO |
26/06/2007 |
|
|
MANAGING DIRECTOR |
DEL VAL VALERO SERGIO |
26/06/2007 |
|
|
MANAGING DIRECTOR |
DEL VAL VALERO JORGE |
26/06/2007 |
|
|
AUDITOR |
APPOINTMENT DATE |
||
|
AVRP AUDITORES S L |
13/02/2002 |
||
Functional Managers
|
POSITION |
SURNAMES AND
NAME |
|
General Manager |
SAEZ DEZARTIGUI LOPEZ CECILIO |
|
General Manager |
DEL VAL VALERO JORGE |
|
General Manager |
DEL VAL VALERO SERGIO |
|
Financial Manager |
JAO JOAN |
|
Human Resources Manager |
JAO JOAN |
FINANCIAL LINKS
|
|
BUSINESS NAME |
CIF / COUNTRY |
% |
SOURCE |
DATA INF. |
|
|
CDC HIACRE SA |
ESPAÑA |
2,60 |
TRADE REG. |
31/12/2006 |
|
|
DEL VAL VALERO SERGIO |
ESPAÑA |
Indet. |
OWN SOURCES |
07/12/2006 |
|
|
DEL VAL GARCIA MARIANO |
ESPAÑA |
Indet. |
OWN SOURCES |
07/12/2006 |
|
|
DEL VAL VALERO JORGE |
ESPAÑA |
Indet. |
OWN SOURCES |
07/12/2006 |
|
|
BUSINESS NAME |
CIF / COUNTRY |
% |
SOURCE |
DATA INF. |
|
|
CDC HIACRE SA |
ESPAÑA |
2,60 |
TRADE REG. |
31/12/2006 |
CREDIT INFORMATION
Constitution Date: 24/01/1996
Business activity 
Activity: Wholesale of iron & steel
NACE Code: 5152
NACE Activity: Wholesale of metals and metal ores
Business: MANIPULACION Y VENTA DE PRODUCTOS SIDERURGICOS.
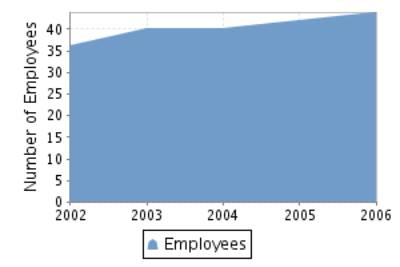
Employees 
Number of total employees: 44 (2006)
Number of fixed employees: 100,00%
Number of temporary employees: 0,00%
Employees evolution
COMMERCIAL OPERATIONS 
SUPPLIERS
|
BUSINESS NAME |
INTERNATIONAL |
|
CDC ACEROS SL |
NO |
1 proveedores
CLIENTS
|
BUSINESS NAME |
INTERNATIONAL |
|
INTERDELVAL SL |
NO |
1 clientes
Banks 
|
ENTITY |
BRANCH |
ADDRESS |
TOWN OR CITY |
PROVINCE |
|
BANCO BILBAO VIZCAYA ARGENTARIA, S.A. |
|
|
|
|
|
BANCO POPULAR ESPAÑOL, S.A. |
|
|
|
|
|
DEUTSCHE BANK, S.A.E. |
|
|
|
|
|
BANCO DE SABADELL, S.A. |
|
|
BARCELONA |
|
|
BANCO ESPAÑOL DE CREDITO, S.A. |
2441 |
PZ PORXADA 30 APDO. 237 |
GRANOLLERS |
Barcelona |
7 bank entities registered
Brands, Signs and Commercial
Names 
Brand name: CDC-HIACRE (Valid)
Type: DENOMINATIVE Date: 03/11/2003
LEGAL STRUCTURE
Constitution Data
Register Date: 24/01/1996
Register town: Barcelona
Announcement number: 84382
Current structure data 
Current Legal Form: JOINT STOCK COMPANY
Current Capital: 601.000,00 €
Legal Aspects
Obligation to fill in Financial Statements: YES
Chamber census: YES (2006)
Listed on a Stock Exchange: NO
B.O.R.M.E.(Official Companies
Registry Gazette) 
Registered Proceedings
|
PROCEEDINGS |
DATE |
NOTICE NUM. |
TRADE REG. |
|
Resignations |
21/05/2008 |
252424 |
Barcelona |
|
Appointments |
26/06/2007 |
341540 |
Barcelona |
|
Appointments |
12/06/2007 |
316791 |
Barcelona |
Other Proceedings published
|
PROCEEDINGS |
DATE |
NOTICE NUM. |
TRADE REG. |
|
Registration of accounts (2006) Individual |
04/02/2008 |
52886 |
Barcelona |
|
Registration of accounts (2005) Individual |
04/10/2006 |
642416 |
Barcelona |
Press articles

04/06/2005 VANGUARDIA (BUSINESS AWARDS INFORMATION)
CDC HIACRE, EMPRESA DEDICADA AL CORTE Y DISTRIBUCION DE PRODUCTOS
SIDERURGICOS, HA SIDO GALARDONADA CON EL PREMIO A LA EMPRESA MAS COMPETITIVA
AUSPICIADO POR PIMEC, ASOCIACION QUE AGRUPA A LA PEQUEÑA Y MEDIANA EMPRESA DE
CATALUÑA.
FINANCIAL INFORMATION
The information on the last account contained in this report is
extracted from the Mercantile Register file of the legal address of the Company
and dated 17/01/2008.
BALANCE SHEET
Assets
Figures given in €
|
|
31/12/2004 (12) |
31/12/2005 (12) |
31/12/2006 (12) |
|
A) DUE FROM SHAREHOLDERS FOR UNCALLED CAPITAL |
|
|
|
|
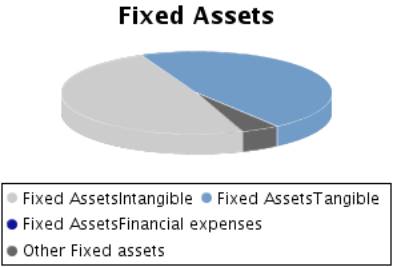
B) FIXED ASSETS |
633.558,58 |
2.535.594,11 |
4.302.189,74 |
|
I. Incorporation costs |
|
|
|
|
II. Intangible fixed assets |
86.928,25 |
1.919.674,14 |
2.104.301,26 |
|
R & D expenses |
25.902,25 |
25.902,25 |
205.735,29 |
|
Concessions, patents, licences , trademarks |
2.544,02 |
3.164,08 |
3.164,08 |
|
Goodwill |
|
|
|
|
Acquired rights from finance leases |
|
|
|
|
Software |
168.566,23 |
265.428,03 |
320.755,75 |
|
Leasing |
24.120,93 |
1.829.966,23 |
1.929.380,57 |
|
Cash advance |
|
|
|
|
Provisions |
|
|
|
|
Depreciation |
-134.205,18 |
-204.786,45 |
-354.734,43 |
|
III. Tangible fixed assets |
539.306,82 |
608.367,60 |
1.998.240,10 |
|
Property, plant and equipment |
|
|
|
|
Machinery, equipment and other |
135.024,97 |
189.634,50 |
1.912.631,86 |
|
Other property plant and equipment |
229.355,10 |
300.454,45 |
361.214,71 |
|
Prepaid expenses on fixed assets |
265.609,85 |
267.450,47 |
|
|
Other assets |
271.646,12 |
283.366,91 |
250.500,07 |
|
Provisions |
|
|
|
|
Depreciation |
-362.329,22 |
-432.538,73 |
-526.106,54 |
|
IV. Financial fixed assets |
7.323,51 |
7.552,37 |
7.586,38 |
|
Shares in affiliated companies |
|
|
|
|
Receivables in affiliated companies |
|
|
|
|
Shares in associated companies |
|
|
|
|
Loans to associated companies |
|
|
|
|
Securities |
|
|
|
|
Other loans |
|
|
|
|
Long term deposits and guarantees |
7.323,51 |
7.552,37 |
7.586,38 |
|
Provisions |
|
|
|
|
Taxes receivable |
|
|
|
|
V.Owners equity |
|
|
192.062,00 |
|
VI.Long term trade liabilities |
|
|
|
|
C) DEFERRED EXPENSES |
135,85 |
219.379,14 |
191.787,88 |
|
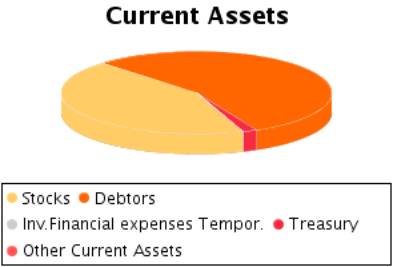
D) CURRENT ASSETS |
22.280.931,20 |
27.969.313,90 |
25.961.947,80 |
|
I. Shareholders by required outlays |
|
|
|
|
II. Stocks |
8.730.571,02 |
10.672.935,50 |
11.277.021,05 |
|
Goods available for sale |
8.730.571,02 |
10.672.935,50 |
11.277.021,05 |
|
Raw material inventory |
|
|
|
|
Work in Progress |
|
|
|
|
Finished goods |
|
|
|
|
Subproducts and recycled materials |
|
|
|
|
Cash advance |
|
|
|
|
Provisions |
|
|
|
|
III. Debtors |
13.362.745,98 |
16.968.560,42 |
14.215.839,02 |
|
Clients |
12.857.930,34 |
15.841.812,83 |
14.676.512,53 |
|
Amounts owned by affiliated companies |
1.083.039,50 |
1.647.237,32 |
379.103,84 |
|
Amounts owned by associated companies |
|
|
|
|
Other debts |
|
|
177.063,32 |
|
Staff Expenses |
1.541,96 |
|
4.075,47 |
|
Government |
|
146.302,22 |
|
|
Provisions |
-579.765,82 |
-666.791,95 |
-1.020.916,14 |
|
IV. Temporary financial investment |
|
|
|
|
Shares in affiliated companies |
|
|
|
|
Receivables in affiliated companies |
|
|
|
|
Shares in associated companies |
|
|
|
|
Loans to associated companies |
|
|
|
|
Short term investment |
|
|
|
|
Other loans |
|
|
|
|
Short Term Deposit and guarantees |
|
|
|
|
Provisions |
|
|
|
|
V. Short-term own shares |
|
|
|
|
VI. Treasury |
178.086,69 |
318.730,39 |
453.278,85 |
|
VII. Periodification adjustments |
9.527,51 |
9.087,59 |
15.808,88 |
|
ASSETS (A + B + C + D) |
22.914.625,63 |
30.724.287,15 |
30.455.925,42 |
Assets composition
Liabilities
Figures given in €
|
|
31/12/2004 (12) |
31/12/2005 (12) |
31/12/2006 (12) |
|
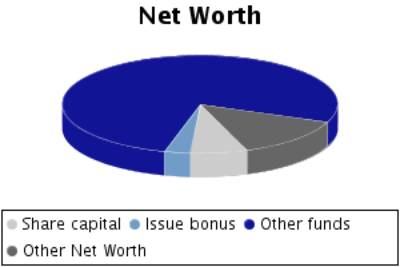
A) SHAREHOLDERS EQUITY |
7.386.838,74 |
7.936.380,98 |
9.047.574,49 |
|
I. Share capital |
601.000,00 |
601.000,00 |
601.000,00 |
|
II. Issue bonus |
279.500,00 |
279.500,00 |
279.500,00 |
|
III.Revaluation reserve |
|
|
|
|
IV.Reserves |
4.401.229,41 |
6.506.338,74 |
6.959.880,98 |
|
Retained earnings |
120.200,00 |
120.200,00 |
120.200,00 |
|
Sinking fund from owner equity |
|
|
192.062,00 |
|
Reserve for the parent company capital |
|
|
|
|
Statutory reserve |
|
|
|
|
Other funds |
4.281.029,41 |
6.386.138,74 |
6.647.618,98 |
|
Capital adjustments in Euros |
|
|
|
|
V.Results from previous years |
|
|
|
|
Carry Over |
|
|
|
|
Prior years losses |
|
|
|
|
Loans from partners for losses compensation |
|
|
|
|
VI.Profit and Losses |
2.105.109,33 |
549.542,24 |
1.207.193,51 |
|
VII.Dividend paid during the year |
|
|
|
|
VIII.Own shares for capital reduction |
|
|
|
|
B) DEFERRED INCOME |
|
|
79.443,39 |
|
Capital grants |
|
|
51.773,63 |
|
Positive change difference |
|
|
|
|
Other deferred income |
|
|
27.669,76 |
|
Fiscal deferred income |
|
|
|
|
C) PROVISIONS FOR LIABILITIES AND EXPENSES |
|
|
|
|
Provision for pensions plans |
|
|
|
|
Provision for taxes |
|
|
|
|
Other provisions |
|
|
|
|
Reversion fund |
|
|
|
|
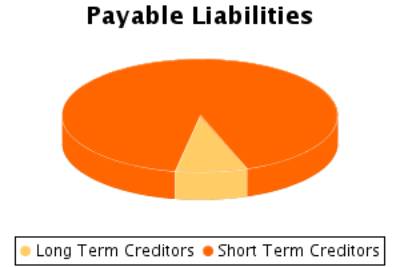
D) LONG TERM LIABILITIES |
1.366,13 |
1.653.819,32 |
1.808.729,88 |
|
I.Negotiable bonds and other negotiable values |
|
|
|
|
Non convertible securities |
|
|
|
|
Convertible securities |
|
|
|
|
Other convertible debentures |
|
|
|
|
II.Debt with bank entities |
1.366,13 |
1.653.819,32 |
1.808.729,88 |
|
Long term bank loans |
|
|
|
|
Leasing |
1.366,13 |
1.653.819,32 |
1.808.729,88 |
|
III.Debts with associated and affiliated
companies |
|
|
|
|
With affiliated companies |
|
|
|
|
Associated companies |
|
|
|
|
IV. Other creditors |
|
|
|
|
Bills payable |
|
|
|
|
Other debts |
|
|
|
|
Long term deposit and guaranties |
|
|
|
|
Taxes receivable |
|
|
|
|
V. Deferred debts on shares |
|
|
|
|
From affiliated companies |
|
|
|
|
From associated companies |
|
|
|
|
Other companies |
|
|
|
|
VI. Long term debt with creditor |
|
|
|
|
E) SHORT TERM LIABILITIES |
15.526.420,76 |
21.134.086,85 |
19.520.177,66 |
|
I.Negotiable bonds and other negotiable values |
|
|
|
|
Non convertible securities |
|
|
|
|
Convertible securities |
|
|
|
|
Other convertible debentures |
|
|
|
|
Interests from bonds |
|
|
|
|
II.Debt with bank entities |
9.727.869,48 |
15.012.380,73 |
13.443.284,43 |
|
Loans and other debts |
9.727.869,48 |
14.702.888,87 |
13.104.126,49 |
|
Debt interest |
|
6.324,90 |
6.150,11 |
|
Leasing |
|
303.166,96 |
333.007,83 |
|
III. Short term debts with associated and
affiliated companies |
|
|
44.640,00 |
|
With affiliated companies |
|
|
44.640,00 |
|
Associated companies |
|
|
|
|
IV. Commercial creditors |
5.024.384,82 |
5.883.863,33 |
5.481.357,36 |
|
Accounts payable |
2.000,00 |
3.116,00 |
|
|
Expenses |
5.022.384,82 |
5.880.747,33 |
5.481.357,36 |
|
Bills payable |
|
|
|
|
V. Other non-commercial debt |
774.166,46 |
237.842,79 |
550.895,87 |
|
Government |
357.059,53 |
127.371,16 |
390.860,67 |
|
Bills payable |
|
|
|
|
Other debts |
102.579,89 |
20.870,44 |
|
|
Accounts receivable |
314.527,04 |
89.601,19 |
160.035,20 |
|
Short term deposits and guarantees |
|
|
|
|
VI. Provisions for current assets |
|
|
|
|
VII. Periodification adjustments |
|
|
|
|
F) SHORT TERM PROVISIONS FOR LIABILITIES AND
EXPENSES |
|
|
|
|
LIABILITIES (A + B + C + D + E + F) |
22.914.625,63 |
30.724.287,15 |
30.455.925,42 |
Liabilities
Composition
PROFIT AND LOSS ACCOUNT
Itams of the Profit
and Loss Account
Figures given in €
|
|
31/12/2004 (12) |
31/12/2005 (12) |
31/12/2006 (12) |
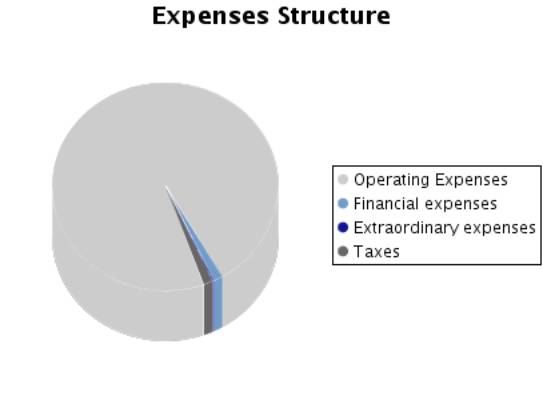
|
A) EXPENSES (A.1 a A.16) |
36.835.054,07 |
43.118.220,93 |
42.618.920,36 |
|
A.1.Reduction in stocks of finished goods and
work in progress |
|
|
|
|
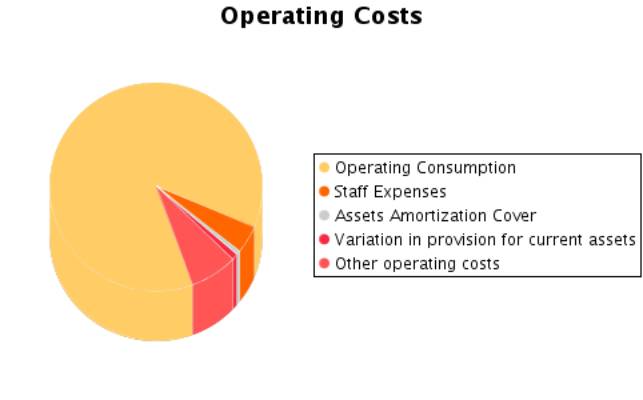
A.2.Supplies |
31.213.074,95 |
37.738.109,62 |
35.943.366,76 |
|
Material consumed |
30.113.381,30 |
36.606.065,37 |
34.515.018,12 |
|
Raw materials consumed |
140.857,08 |
152.125,72 |
185.738,02 |
|
Other expenses |
958.836,57 |
979.918,53 |
1.242.610,62 |
|
A.3. Labour cost |
1.595.558,68 |
1.595.930,49 |
1.771.715,82 |
|
Wages |
1.334.321,37 |
1.299.442,78 |
1.438.486,43 |
|
Social security expenses |
261.237,31 |
296.487,71 |
333.229,39 |
|
A.4. Assets depreciation |
91.358,29 |
143.495,33 |
318.353,21 |
|
A.5.Variance in the traffic provisions |
213.041,45 |
89.409,73 |
354.124,19 |
|
Variance in provision for inventory |
|
|
|
|
Variance in provision for bad debts |
213.041,45 |
89.409,73 |
354.124,19 |
|
Variance in provision for other current assets |
|
|
|
|
A.6. Other operating costs |
2.588.514,63 |
2.676.785,57 |
2.996.285,14 |
|
External costs |
2.554.121,98 |
2.634.898,79 |
2.957.984,85 |
|
Taxes |
34.392,65 |
41.886,78 |
38.300,29 |
|
Other day to day expenses |
|
|
|
|
Allowance to reversion fund |
|
|
|
|
A.I.OPERATING RESULT
(B.1+B.2+B.3+B.4-A.1-A.2-A.3-A.4-A.5-A.6) |
3.122.255,54 |
782.239,92 |
1.951.924,40 |
|
A.7.Financial expenses and similar |
159.703,42 |
570.776,26 |
507.208,88 |
|
Debts with related companies |
|
|
|
|
Debts with associated companies |
|
|
|
|
Other companies debts By debts with third parties and similar expenses |
159.703,42 |
570.776,26 |
507.208,88 |
|
Losses from financial investments |
|
|
|
|
A.8. Variation in financial investment provision |
|
|
|
|
A.9.Negative exchange difference |
|
|
81.472,45 |
|
A.II.POSITIVE FINANCIAL RESULTS
(B.5+B.6+B.7+B.8-A.7-A.8-A.9) |
|
|
|
|
A.III.PROFIT FROM ORDINARY ACTIVITIES
(A.I+A.II-B.I-B.II) |
3.055.730,68 |
523.472,00 |
1.536.661,77 |
|
A.10. Variation in provision in fixed assets |
|
|
|
|
A.11. Losses in fixed assets |
|
|
83.835,62 |
|
A.12. Losses from own shares and bonds |
|
|
|
|
A.13. Extraordinary charges |
16.922,98 |
7.806,57 |
30.279,28 |
|
A.14.Other exercises’ expenses and losses |
|
|
|
|
A.IV.POSITIVE
EXTRAORDINARY RESULT (B.9+B.10+B.11+B.12+B.13-A.10-A.11-A.12-A.13-A.14) |
6.258,32 |
321.977,60 |
202.810,75 |
|
A.V.PROFIT BEFORE TAXES (A.III+A.IV-B.III-B.IV) |
3.061.989,00 |
845.449,60 |
1.739.472,52 |
|
A.15.Corporate Taxes |
956.879,67 |
295.907,36 |
532.279,01 |
|
A.16. Other taxes |
|
|
|
|
A.VI.EXERCISE
RESULT (PROFIT) (A.V-A.14-A.15) |
2.105.109,33 |
549.542,24 |
1.207.193,51 |
|
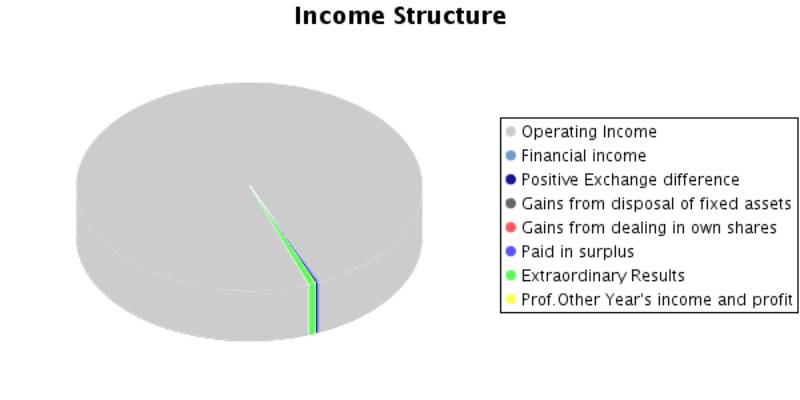
B) INCOMES (B.1 a B13) |
38.940.163,40 |
43.667.763,17 |
43.826.113,87 |
|
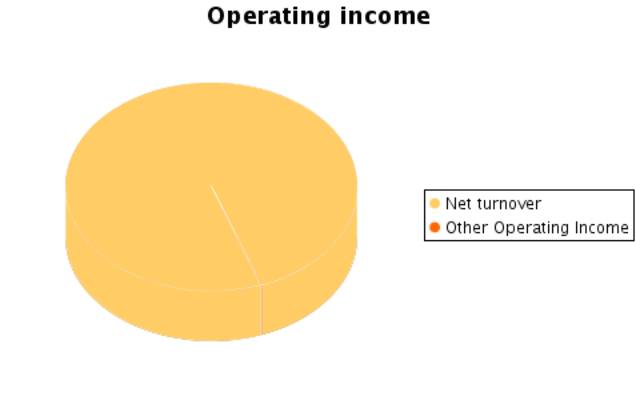
B.1. Turnover |
38.823.803,54 |
43.025.970,66 |
43.306.982,92 |
|
Sales |
38.492.369,52 |
42.715.980,14 |
43.097.042,99 |
|
Services provided |
331.434,02 |
309.990,52 |
209.939,93 |
|
Refunds and sale reminders |
|
|
|
|
B.2.Increase in inventory of finished goods and
works in progress |
|
|
|
|
B.3.Expenses capitalized |
|
|
28.786,60 |
|
B.4. Other operating income |
|
|
|
|
Other incomes |
|
|
|
|
Grants |
|
|
|
|
Excess in provision for liabilities and charges |
|
|
|
|
B.I.OPERATING
LOSSES (A.1+A.2+A.3+A.4+A.5+A.6-B.1-B.2-B.3-B.4) |
|
|
|
|
B.5.Incomes from share participations |
|
|
|
|
From affiliated companies |
|
|
|
|
From associated companies |
|
|
|
|
From other companies |
|
|
|
|
B.6.Income from other securities and credits to
fixed assets |
|
|
1.711,52 |
|
From affiliated companies |
|
|
|
|
From associated companies |
|
|
|
|
Other companies |
|
|
1.711,52 |
|
B.7.Other interests and similar |
93.178,56 |
312.008,34 |
86.852,99 |
|
From affiliated companies |
|
|
|
|
From associated companies |
|
|
|
|
Other Interests |
93.178,56 |
312.008,34 |
86.852,99 |
|
Profits from investments |
|
|
|
|
B.8. Positive change difference |
|
|
84.854,19 |
|
B.II. NEGATIVE FINANCIAL RESULTS
(A.7+A.8+A.9-B.5-B.6-B.7-B.8) |
66.524,86 |
258.767,92 |
415.262,63 |
|
B.III.LOSSES FROM ORDINARY ACTIVITIES
(B.I+B.II-A.I-A.II) |
|
|
|
|
B.9.B.9. Gains from disposal of fixed assets |
|
9.370,00 |
33.532,62 |
|
B.10.Gains from dealing in own shares |
|
|
|
|
B.11. Paid in surplus |
|
|
2.144,92 |
|
B.12. Extraordinary income |
14.323,82 |
310.872,39 |
275.284,49 |
|
B.13.Other year’s income and profits |
8.857,48 |
9.541,78 |
5.963,62 |
|
B.IV.NEGATIVE EXTRAORDINARY LOSSES
(A.10+A.11+A.12+A.13+A.14-B.9-B.10-B.11-B.12-B.13) |
|
|
|
|
B.V.LOSS BEFORE TAXES (B.III+B.IV-A.III-A.IV) |
|
|
|
|
B.VI.EXERCISE RESULTS (LOSS) (B.V+A.14+A.15) |
|
|
|
Composition of the
Profit and Loss Account
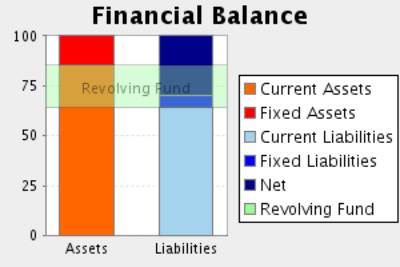
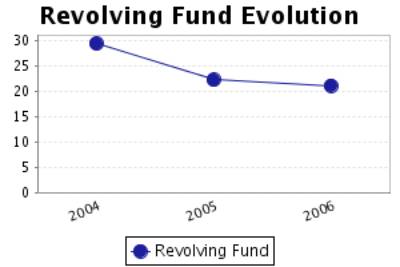
FINANCIAL BALANCE
Here the Main Capital Amounts of the company and the Revolving Fund
Evolution are analysed.
Financial Balance
Table
Figures given in €
|
|
31/12/2004 (12) |
% |
31/12/2005 (12) |
% |
31/12/2006 (12) |
% |
|
A) DUE FROM SHAREHOLDERS FOR UNCALLED CAPITAL |
|
|
|
|
|
|
|
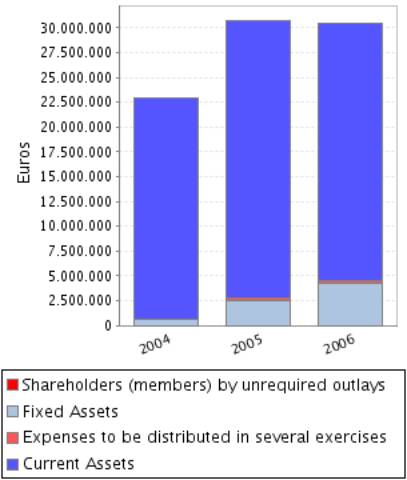
B) FIXED ASSETS |
633.558,58 |
2,76 |
2.535.594,11 |
8,25 |
4.302.189,74 |
14,13 |
|
C) DEFERRED EXPENSES |
135,85 |
0,00 |
219.379,14 |
0,71 |
191.787,88 |
0,63 |
|
D) CURRENT ASSETS |
22.280.931,20 |
97,23 |
27.969.313,90 |
91,03 |
25.961.947,80 |
85,24 |
|
ASSETS (A + B + C + D) |
22.914.625,63 |
|
30.724.287,15 |
|
30.455.925,42 |
|
|
|
||||||
|
A) SHAREHOLDERS
EQUITY |
7.386.838,74 |
32,24 |
7.936.380,98 |
25,83 |
9.047.574,49 |
29,71 |
|
B) DEFERRED INCOME |
|
|
|
|
79.443,39 |
0,26 |
|
C) PROVISIONS
FOR LIABILITIES AND EXPENSES |
|
|
|
|
|
|
|
D) LONG TERM LIABILITIES |
1.366,13 |
0,01 |
1.653.819,32 |
5,38 |
1.808.729,88 |
5,94 |
|
E) SHORT TERM LIABILITIES |
15.526.420,76 |
67,76 |
21.134.086,85 |
68,79 |
19.520.177,66 |
64,09 |
|
F) SHORT TERM PROVISIONS FOR LIABILITIES AND EXPENSES |
|
|
|
|
|
|
|
LIABILITIES (A + B + C + D + E + F) |
22.914.625,63 |
|
30.724.287,15 |
|
30.455.925,42 |
|
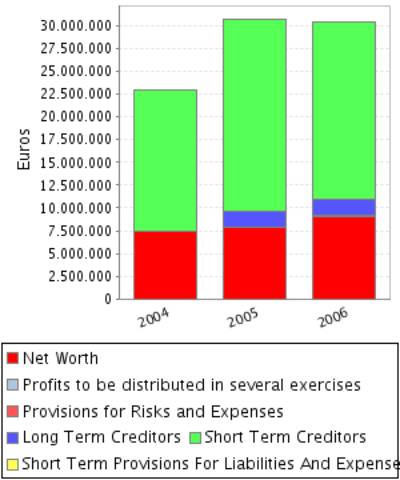
Financial Balance
Composition
Comments on Financial
Balance
In the 2004, the assets of the company were formed in 2,77% of Fixed
Assets and in 97,23% of Current Assets.This assets were financed in 32,24% with
own capitals, and in 0,01% with long term debt and in 67,76% with current
liabilities.
The result of this financial structure is a positive turnover fund of
6.754.510,44 Euros, which is equivalent to 29,48% proportion of the
company’s total assets.
In the 2005, the assets of the company were formed in 8,97% of Fixed
Assets and in 91,03% of Current Assets.This assets were financed in 25,83% with
own capitals, and in 5,38% with long term debt and in 68,79% with current
liabilities.
The result of this financial structure is a positive turnover fund of
6.835.227,05 Euros, which is equivalent to 22,25% proportion of the
company’s total assets.
This measure has increased with respect to the previous exercise in
1,20% having, however, diminished its proportion with respect to the total
assets of the company.
In the 2006, the assets of the company were formed in 14,76% of Fixed
Assets and in 85,24% of Current Assets.This assets were financed in 29,97% with
own capitals, and in 5,94% with long term debt and in 64,09% with current
liabilities.
The result of this financial structure is a positive turnover fund of
6.441.770,14 Euros, which is equivalent to 21,15% proportion of the
company’s total assets.
This measure has diminished with respect to the previous exercise in
5,76% having also diminished its proportion with respect to the total assets of
the company.
RATIOS
Main Ratios
|
|
31/12/2004 (12) |
31/12/2005 (12) |
31/12/2006 (12) |
|
STRUCTURAL RATIOS |
|
|
|
|
Management fund |
6.754.510,44 |
6.835.227,05 |
6.441.770,14 |
|
Management Fund Requirement |
16.304.293,23 |
21.528.877,39 |
19.431.775,72 |
|
Indebtedness (%) |
67,76 |
74,17 |
70,03 |
|
External Funds on Net Worth |
2,10 |
2,87 |
2,34 |
|
GENERAL ACTIVITY RATIO |
|
|
|
|
Turnover Increase (%) |
50,14 |
10,82 |
0,65 |
|
Added value growth (%) |
115,56 |
-48,01 |
68,36 |
|
Cash Flow |
2.409.509,07 |
782.447,30 |
1.879.670,91 |
|
Labour Productivity |
3,15 |
1,64 |
2,48 |
|
Assets turnover |
1,69 |
1,40 |
1,42 |
|
Breakdown Point |
22.896.572,10 |
36.661.084,82 |
31.893.191,42 |
|
Security Margin of the Breakdown Point (%) |
41,02 |
14,79 |
26,40 |
|
ACTIVITY RATIOS |
|
|
|
|
Average Payment Period |
58 |
56 |
55 |
|
Average Collection Period |
124 |
142 |
118 |
|
Inventory Turnover Period |
81 |
89 |
94 |
|
SOLVENCY RATIOS |
|
|
|
|
Payback Capacity |
0,16 |
0,03 |
0,09 |
|
Assets Guarantee |
1,48 |
1,34 |
1,42 |
|
Short Term Debts Proportion (%) |
99,99 |
92,74 |
91,52 |
|
Interest Coverage |
14,36 |
0,25 |
2,74 |
|
LIQUIDITY RATIOS |
|
|
|
|
Current Ratio |
1,44 |
1,32 |
1,33 |
|
Immediate liquidity |
0,01 |
0,02 |
0,02 |
|
Treasury |
-9.549.782,79 |
-14.693.650,34 |
-12.990.005,58 |
|
Sales on Current Assets |
627 |
554 |
601 |
Results Analysis
Ratios
|
|
31/12/2004 (12) |
31/12/2005 (12) |
31/12/2006 (12) |
|
Economic profitability (%) |
13,63 |
2,55 |
6,41 |
|
Operating Profitability (%) |
8,04 |
1,82 |
4,51 |
|
Equity gearing |
3,04 |
2,59 |
2,63 |
|
Financial profitability (%) |
28,50 |
6,92 |
13,23 |
|
General Profitability (%) |
5,42 |
1,28 |
2,79 |
Comments on the
Results Analysis Ratios
The economic profitability in the year2005 achieved a 2,55% positive
level, due to a 1,82% economic margin and to an assets turnover of1,40%.
The economic profitability in the year has reduced from 13,63% up to
2,55% of2005, even if it remains positive. This fall is due to the decrease in
operating profitability, that has passe from 8,04% to 1,82%, as assets turnover
whose index has passed from 1,69 to 1,40%.
Financial profitability on 2005 achieved a 6,92%.
The company’s financial structure has instigated its economic
profitability with an indebtedness level of 2,59.
The general profitability on 2005 achieved a 1,28%.
The economic profitability in the year2006 achieved a 6,41% positive
level, due to a 4,51% economic margin and to an assets turnover of1,42%.
The economic profitability in the year has increased from 2,55% up to
6,41%. This growth is due to the economic margin increase, from 1,82% to the
current 4,51Y%, and to the assets turnover index, which in the last period has
achieved 1,42, compared to 1,40 del 2005.
Financial profitability on 2006 achieved a 13,23%.
The company’s financial structure has instigated its economic
profitability with an indebtedness level of 2,63.
The general profitability on 2006 achieved a 2,79%.
SECTORIAL ANÁLYSIS
Large Capital Amounts
and Financial Balance
Figures given in %
|
|
COMPANY (2006) |
SECTOR |
DIFFERENCE |
DIFFERENCE RELATIVE |
|
|
|
|
|
|
ASSETS |
|
|
|
|
|
|
|
|
|
|
A) DUE FROM
SHAREHOLDERS FOR UNCALLED CAPITAL |
|
0,00 |
|
|
|
|
|
|
|
|
B) FIXED ASSETS |
14,13 |
39,26 |
-25,13 |
-64,01 |
|
|
|
|
|
|
C) DEFERRED
EXPENSES |
0,63 |
0,83 |
-0,20 |
-24,10 |
|
|
|
|
|
|
D) CURRENT ASSETS |
85,24 |
59,91 |
25,33 |
42,28 |
|
|
|
|
|
|
ASSETS (A + B + C + D) |
100 |
100 |
|
|
|
|
|
|
|
|
|
|
|
|
|
|
|
|
|
|
|
|
COMPANY (2006) |
SECTOR |
DIFFERENCE |
DIFFERENCE RELATIVE |
|
|
|
|
|
|
LIABILITIES |
|
|
|
|
|
|
|
|
|
|
A) SHAREHOLDERS
EQUITY |
29,71 |
40,02 |
-10,31 |
-25,77 |
|
|
|
|
|
|
B) DEFERRED
INCOME |
0,26 |
0,25 |
0,01 |
3,17 |
|
|
|
|
|
|
C) PROVISIONS
FOR LIABILITIES AND EXPENSES |
|
1,91 |
|
|
|
|
|
|
|
|
D) LONG TERM
LIABILITIES |
5,94 |
8,00 |
-2,06 |
-25,71 |
|
|
|
|
|
|
E) SHORT TERM
LIABILITIES |
64,09 |
49,62 |
14,48 |
29,17 |
|
|
|
|
|
|
F) SHORT TERM
PROVISIONS FOR LIABILITIES AND EXPENSES |
|
0,20 |
|
|
|
|
|
|
|
|
LIABILITIES (A + B + C + D + E + F) |
100 |
100 |
|
|
|
|
|
|
|
Financial Balance
Composition
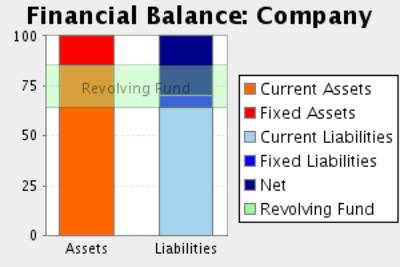
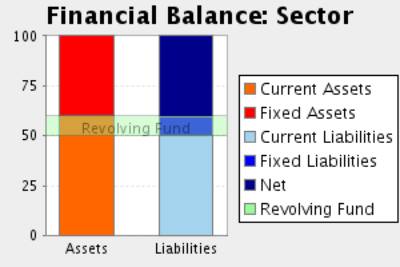
Comments to the Sectorial Analysis
In the 2006, the assets of the company were formed in 14,76% of fixed
assets and in 85,24Current Assets % In the sector, the proportion of fixed
assets was of 40,09%, 63,18% superior, and the proportion of current assets was
of 59,91%, 42,28% inferior.
The assets were financed in the company in 29,97% with own capitals , in
5,94% with fixed liabilities and in 64,09% with current liabilities In the
sector, the self financing represented 40,28%, 25,59% superior. On the other
hand the long term debts represented in the sector an average of 9,90%
financing, with a relative difference of 40,02% favourable to the sectorAnd,
short term liabilities represented in the sector an average of 49,82%
financing, with a relative difference of 28,64% in favour of the company
The result of this company’s financial structure is a turnover fund that
represents 21,15% of the total assets; in the sector, this same proportion is
10,09%, therefore, we can say that the company’s turnover fund is 109,63%
higher than the one in of the sector.
Analytical Account of
Results
Figures given in %
|
|
COMPANY (2006) |
SECTOR |
DIFFERENCE |
DIFFERENCE RELATIVE |
|
Turnover |
99,93 |
99,44 |
0,49 |
0,49 |
|
Other operating income |
0,07 |
0,56 |
-0,49 |
-87,48 |
|
Production Value |
100,00 |
100,00 |
0,00 |
0,00 |
|
Operating expenses |
82,94 |
87,52 |
-4,58 |
-5,23 |
|
Other operation expenses |
6,91 |
7,10 |
-0,19 |
-2,62 |
|
Added value |
10,14 |
5,38 |
4,76 |
88,30 |
|
Labour cost |
4,09 |
2,37 |
1,72 |
72,43 |
|
Gross Economic Result |
6,06 |
3,01 |
3,05 |
101,13 |
|
Assets depreciation |
0,73 |
0,82 |
-0,09 |
-11,08 |
|
Variation in provision for current assets and bad debt losses |
0,82 |
0,05 |
0,77 |
1.476,92 |
|
Net Economic Result |
4,50 |
2,14 |
2,36 |
110,28 |
|
Financial income |
0,40 |
0,79 |
-0,39 |
-49,62 |
|
Financial Charges |
1,36 |
0,48 |
0,88 |
180,99 |
|
Variation in financial investment provision |
|
0,00 |
|
|
|
Ordinary Activities Result |
3,55 |
2,45 |
1,10 |
45,02 |
|
Extraordinary income |
0,73 |
0,19 |
0,54 |
284,21 |
|
Extraordinary charges |
0,26 |
0,13 |
0,13 |
100,00 |
|
Variation in provision in fixed assets |
|
0,06 |
|
|
|
Results before Taxes |
4,01 |
2,45 |
1,56 |
63,74 |
|
Corporate taxes |
1,23 |
0,69 |
0,54 |
77,49 |
|
Net Result |
2,79 |
1,76 |
1,03 |
58,88 |
|
Assets depreciation |
0,73 |
0,82 |
-0,09 |
-11,08 |
|
Change of Provisions |
0,82 |
0,11 |
0,71 |
625,66 |
|
Net Self-Financing |
4,34 |
2,69 |
1,65 |
61,34 |
Main Ratios
|
|
COMPANY (2006) |
PTILE25 |
PTILE50 |
PTILE75 |
|
STRUCTURAL RATIOS |
|
|
|
|
|
Management fund |
6.441.770,14 |
2.000,94 |
5.767,84 |
14.304,14 |
|
Management Fund Requirement |
19.431.775,72 |
-9.292,82 |
-977,36 |
5.397,65 |
|
Indebtedness (%) |
70,03 |
54,88 |
66,33 |
77,50 |
|
External Funds on Net Worth |
2,34 |
1,22 |
1,97 |
3,44 |
|
GENERAL ACTIVITY RATIO |
|
|
|
|
|
Turnover Increase (%) |
0,65 |
0,51 |
6,97 |
17,97 |
|
Added value growth (%) |
68,36 |
-17,11 |
-1,23 |
12,22 |
|
Cash Flow |
1.879.670,91 |
1.019,88 |
2.693,90 |
5.671,22 |
|
Labour Productivity |
2,48 |
1,48 |
2,02 |
3,20 |
|
Assets turnover |
1,42 |
1,49 |
1,90 |
2,92 |
|
Breakdown Point |
31.893.191,42 |
40.272.149,61 |
56.058.838,07 |
85.937.635,89 |
|
Security Margin of the Breakdown Point (%) |
26,40 |
9,38 |
19,54 |
34,50 |
|
ACTIVITY RATIOS |
|
|
|
|
|
Average Payment Period |
55 |
21 |
46 |
75 |
|
Average Collection Period |
118 |
54 |
92 |
121 |
|
Inventory Turnover Period |
94 |
15 |
31 |
51 |
|
SOLVENCY RATIOS |
|
|
|
|
|
Payback Capacity |
0,09 |
0,04 |
0,09 |
0,17 |
|
Assets Guarantee |
1,42 |
1,28 |
1,50 |
1,82 |
|
Short Term Debts Proportion (%) |
91,52 |
84,33 |
96,45 |
99,64 |
|
Interest Coverage |
2,74 |
0,91 |
3,60 |
12,50 |
|
LIQUIDITY RATIOS |
|
|
|
|
|
Current Ratio |
1,33 |
1,08 |
1,24 |
1,63 |
|
Immediate liquidity |
0,02 |
0,02 |
0,07 |
0,26 |
|
Treasury |
-12.990.005,58 |
-7.995,37 |
-50,87 |
2.849,99 |
|
Sales on Current Assets |
601 |
713 |
877 |
1.404 |
Results Analysis
Ratios
|
|
COMPANY (2006) |
PTILE25 |
PTILE50 |
PTILE75 |
|
Economic profitability (%) |
6,41 |
2,45 |
5,22 |
10,75 |
|
Operating Profitability (%) |
4,51 |
1,03 |
2,81 |
5,90 |
|
Equity gearing |
2,63 |
1,81 |
2,81 |
4,04 |
|
Financial profitability (%) |
13,23 |
4,50 |
11,86 |
21,27 |
|
General Profitability (%) |
2,79 |
0,65 |
1,78 |
3,90 |
FOREIGN EXCHANGE
RATES
|
Currency |
Unit
|
Indian Rupees |
|
US Dollar |
1 |
Rs.43.21 |
|
UK Pound |
1 |
Rs.85.72 |
|
Euro |
1 |
Rs.67.92 |
RATING
EXPLANATIONS
|
RATING |
STATUS |
PROPOSED CREDIT LINE |
|
|
>86 |
Aaa |
Possesses an extremely sound financial base with the strongest
capability for timely payment of interest and principal sums |
Unlimited |
|
71-85 |
Aa |
Possesses adequate working capital. No caution needed for credit
transaction. It has above average (strong) capability for payment of interest
and principal sums |
Large |
|
56-70 |
A |
Financial & operational base are regarded healthy. General unfavourable
factors will not cause fatal effect. Satisfactory capability for payment of
interest and principal sums |
Fairly Large |
|
41-55 |
Ba |
Overall operation is considered normal. Capable to meet normal
commitments. |
Satisfactory |
|
26-40 |
B |
Unfavourable & favourable factors carry similar weight in credit
consideration. Capability to overcome financial difficulties seems
comparatively below average. |
Small |
|
11-25 |
Ca |
Adverse factors are apparent. Repayment of interest and principal sums
in default or expected to be in default upon maturity |
Limited with
full security |
|
<10 |
C |
Absolute credit risk exists. Caution needed to be exercised |
Credit not
recommended |
|
NR |
In view of the lack of information, we have no basis upon which to
recommend credit dealings |
No Rating |
|
This score serves as a reference to assess SC’s credit risk
and to set the amount of credit to be extended. It is calculated from a composite
of weighted scores obtained from each of the major sections of this report. The
assessed factors and their relative weights (as indicated through %) are as
follows:
Financial
condition (40%) Ownership
background (20%) Payment
record (10%)
Credit history
(10%) Market trend
(10%) Operational
size (10%)