![]()
MIRA
INFORM REPORT
|
Report Date : |
03.07.2008 |
IDENTIFICATION
DETAILS
|
Name : |
CORUS LAMINACION Y DERIVADOS SOCIEDAD
LIMITADA. |
|
|
|
|
Registered Office : |
|
|
|
|
|
Country : |
Spain |
|
|
|
|
Financials (as on) : |
31.12.2006 |
|
|
|
|
Date of Incorporation : |
|
|
|
|
|
Legal Form : |
Limited Liability Company |
|
|
|
|
Line of Business : |
Iron and Steel Industry |
RATING & COMMENTS
|
MIRA’s Rating : |
Ba |
|
RATING |
STATUS |
PROPOSED CREDIT LINE |
|
|
41-55 |
Ba |
Overall operation is considered normal. Capable to meet normal
commitments. |
Satisfactory |
|
Maximum Credit Limit : |
2.000.000,00 € |
|
|
|
|
Status : |
Satisfactory |
|
|
|
|
Payment Behaviour : |
Regular |
|
|
|
|
Litigation : |
Clear |
FINANCIAL REPORT
CORUS LAMINACION Y DERIVADOS SOCIEDAD LIMITADA.
TAX NUMBER: B95021218
EXECUTIVE SUMMARY
Identification
Current Business Name: CORUS LAMINACION Y DERIVADOS SOCIEDAD
LIMITADA.
Commercial Name: LAMINACION Y DERIVADOS, S.A. - LAYDE
Other names: YES
Current Address: STREET SAN
FAUSTO, 6, CP 48200, DURANGO VIZCAYA
Branches: 1
Telephone number: 946217850 Fax: 946217868
URL: www.corusspecialstrip.com/ci
Corporate e-mail: layde@corusgroup.com
Commercial Risk
Credit Appraisal:
2.000.000,00 €
Legal Actions: NO
Financial Information
Latest sales known (2007): 120.960.110,00 € (Estimated)
Latest Balance sheet sales (2006): 117.437.000,00 € (MERCANTILE REGISTER)
Result: 2.134.000 €
Total Assets: 90.545.000 €
Social Capital: 24.146.000,00 €
Employees: 173
Commercial Information
Constitution Date: 12/03/1999
Business activity: Iron &
steel industry
NACE Code: 2710
International Operations: Imports
Corporate Structure
President:
VOLLEBERGH
ANDRIAAN HERMAN JOSEPH
Parent Company:
Credit Appraisal
Maximum Credit (from 0 a 6,000,000 €):
2.000.000,00 €
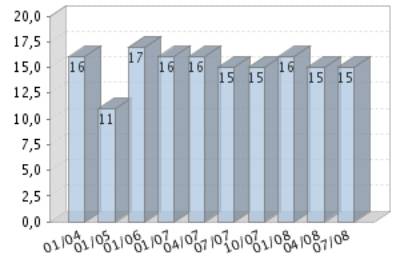
Rating Evolution
Financial Situation
Fiscal year2006
|
Treasury |
Excellent |
|
Indebtedness |
Weak |
|
Profitability |
Average |
|
Balance |
Excellent |
Performance
|
Legal Actions |
None or Negligible |
|
Business
Trajectory |
Excellent |
INCIDENTS

Summary
LEGAL ACTIONS: No legal incidences registered
CLAIM FILED AGAINST THE ADMINISTRATION: No administrative
claims registered
AFFECTED BY: No significant element.
FINANCIAL ELEMENTS AND SECTORIAL COMPARATIVE
FINANCIAL ELEMENTS
Figures given in €
|
|
2005 (12) |
2006 (12) |
2007 |
|
|
|
|
|
BALANCE SHEET
ANALYSIS |
|
|
|
|
|
|
|
|
OWN FUNDS |
|
49.684.000,00 |
|
|
|
|
|
|
DEBT |
|
40.861.000,00 |
|
|
|
|
|
|
FIXED ASSETS |
|
21.670.000,00 |
|
|
|
|
|
|
TOTAL ASSETS |
|
90.545.000,00 |
|
|
|
|
|
|
|
|
|
|
|
|
|
|
|
|
2005 (12) |
2006 (12) |
2007 |
|
|
|
|
|
PROFIT AND LOSS
ACCOUNT ANALYSIS |
|
|
|
|
|
|
|
|
SALES |
110.363.251,72 |
117.437.000,00 |
120.960.110,00 |
|
|
|
|
|
ADDED VALUE |
|
13.371.000,00 |
|
|
|
|
|
|
EBITDA |
|
5.406.000,00 |
|
|
|
|
|
|
EBIT |
|
3.399.000,00 |
|
|
|
|
|
|
NET RESULT |
2.866.515,21 |
2.134.000,00 |
|
|
|
|
|
ANNUAL FINANCIAL REPORT
ADDITIONAL DATA
Source: annual financial report 2006
Results Distribution
Figures given in €
|
DISTRIBUTION
BASE |
DISTRIBUTION TO |
||
|
Profit and Loss |
2.133.820,05 |
Retained earnings |
213.382,00 |
|
Carry Over |
0,00 |
Voluntary Reserve |
0,00 |
|
Voluntary reserves |
0,00 |
Prior years losses |
0,00 |
|
Reserves |
0,00 |
Carry Over |
0,00 |
|
Other concepts |
0,00 |
Other funds |
1.920.438,05 |
|
Total of Amounts to be distributed |
2.133.820,05 |
Dividends |
0,00 |
|
|
|
Other Applications |
0,00 |
Auditing
Auditors’ opinion: FAVOURABLE WITH RESERVATIONS
Auditor: PRICEWATERHOUSECOOPERS AUDITORES SL
Auditing exceptions:
DE ACUERDO CON LA NORMATIVA FISCAL VIGENTE, LA SOCIEDAD SE HA ACOGIDO A
DETERMINADAS DEDUCCIONES DE CARACTER TRIBUTARIO CUYA LEGALIDAD HA SIDO
CUESTIONADA Y RECURRIDA. A LA FECHA DE EMISION DEL PRESENTE INFORME NO ES
POSIBLE CUANTIFICAR, DE FORMA OBJETIVA, EL EFECTO QUE SOBRE LAS CUENTAS ANUALES
ADJUNTAS PUDIERA DERIVARSE DE ESTA SITUACION Y EXCEPTO POR LA OMISION DE LA
INFORMACION REQUERIDA POR EL ARTICULO 200, INDICACION DUODECIMA, DE LA LEY DE
SOCIEDADES ANONIMAS, CONTIENEN LA INFORMACION NECESARIA Y SUFICIENTE PARA SU
INTERPRETACION Y COMPRENSION ADECUADA.
COMPARATIVE SECTOR ANALYSIS
Values table
Figures expressed in %
|
|
COMPANY (2006) |
SECTOR |
DIFFERENCE |
DIFFERENCE RELATIVE |
|
|
|
|
|
|
BALANCE SHEET ANALYSIS: % on the total
assets |
|
|
|
|
|
|
|
|
|
|
OWN FUNDS |
54,87 |
43,89 |
10,98 |
25,01 |
|
|
|
|
|
|
DEBT |
45,13 |
56,11 |
-10,98 |
-19,57 |
|
|
|
|
|
|
FIXED ASSETS |
23,93 |
52,43 |
-28,50 |
-54,35 |
|
|
|
|
|
|
|
|
|
|
|
|
|
|
|
|
|
|
COMPANY (2006) |
SECTOR |
DIFFERENCE |
DIFFERENCE RELATIVE |
|
|
|
|
|
|
PROFIT AND LOSS ACCOUNT ANALYSIS: % on the total
operating income |
|
|
|
|
|
|
|
|
|
|
SALES |
98.414,47 |
99,68 |
98.314,79 |
98.628,42 |
|
|
|
|
|
|
ADDED VALUE |
11.205,16 |
17,39 |
11.187,77 |
64.345,59 |
|
|
|
|
|
|
EBIT |
2.848,43 |
5,64 |
2.842,79 |
50.395,08 |
|
|
|
|
|
|
NET RESULT |
1.788,33 |
3,68 |
1.784,66 |
48.535,66 |
|
|
|
|
|
Sector Composition
Compared sector (NACE): 271
Number of companies: 18
Size (Sales Figure) : > 40.000.000,00 Euros
Comments on the sectorial
comparative
Compared to its sector the assets of the companies show an inferior
proportion of fixed assets. Specifically the difference with the sector average
is -28,50% , which means a relative difference of -54,35% .
In liabilities composition the company appeals on a wider scale to self
financing, being the proportion of net worth of 10,98% superior, which means a
relative difference of 25,01% . As a consequence, external financing sources
are less used by the company in 10,98% less than the sector, which means a
difference of 19,57% .
The proportion that the sales mean to the company’s total ordinary
income is 98.414,47%, 98.314,79% higher than in the sector, which means a
relative difference of 98.628,42% .
The company’s EBIT was positive and was 2.848,43% with regard to the
total ordinary income, 2.842,79% higher than in the sector, which means a
relative difference of 50.395,08% .
The company’s capacity to generate operating income is equal to that of
the sector as its ratio EBIT/Sales is also equal.
The company’s net result was positive and equal to 1.788,33% with regard
to the total ordinary income, 1.784,66% less than the sector, which means a
relative difference of 48.535,66% .
ADDRESSES
Current Legal Seat Address:
STREET SAN FAUSTO, 6
48200 DURANGO VIZCAYA
Previous Seat Address:
AVENIDA ZUGATZARTE, 52
48930
GETXO VIZCAYA
Characteristics of the current address
Type of premises: office
Property: shared
Property Description: Laminacion y Derivados, S.A.
Local Situation: main
Branches 
|
STREET |
POSTAL CODE |
TOWN |
PROVINCE |
|
PASAJE MONTURIOL 7 |
08210 |
BARBERA DEL VALLES |
Barcelona |
1 branches registered
CORPORATE STRUCTURE
ADMINISTRATIVE LINKS
Main Board members, Directors and Auditor ![]()
|
POSITION |
SURNAMES AND
NAME |
APPOINTMENT DATE |
|
|
PRESIDENT |
VOLLEBERGH ANDRIAAN HERMAN JOSEPH |
26/05/2008 |
|
|
CHIEF OFFICER |
VAZQUEZ IRAOLA JOSE |
07/03/2005 |
|
|
CHIEF OFFICER |
PEREZ ARCE JOSE MANUEL |
17/09/2007 |
|
|
SECRETARY |
ALBA FERRE LUIS |
17/09/2007 |
|
|
AUDITOR |
APPOINTMENT DATE |
||
|
PRICEWATERHOUSECOOPERS AUDITORES SOCIEDAD LIMITADA |
29/04/2008 |
||
Functional Managers
|
POSITION |
SURNAMES AND
NAME |
|
General Manager |
PEREZ ARCE JOSE MANUEL |
|
Financial Manager |
ELORRIAGA INAKI |
|
Human Resources Manager |
PEREZ ARCE JOSE MANUEL |
|
Production Manager |
ARANCIBIA ALBERTO |
|
Commercial Manager |
GARAY AITOR |
FINANCIAL LINKS
|
|
BUSINESS NAME |
CIF / COUNTRY |
% |
SOURCE |
DATA INF. |
|
|
BRITISH STEEL HOLDINGS BV |
PAÍSES BAJOS |
100,00 |
OWN SOURCES |
26/03/2008 |
You can obtain business information of a foreign company at the
pageD&B International
CREDIT INFORMATION
Constitution Date: 12/03/1999
Business activity 
Activity: Iron & steel industry
NACE Code: 2710
NACE Activity: Manufacture of basic iron and steel and of
ferro-alloys (ECSC)
Business: FABRICACION, VENTA Y COMERCIALIZACION DE PRODUCTOS SIDERURGICOS.
SERVICIOS DE GESTION E INFORMACION, Y ADMINISTRACION DE EMPRESAS ADMINISTRACION
EN GENERAL, Y ENAJENACION DE BIENES MUEBLES, INMUEBLES Y VALORES MOBILIARIO
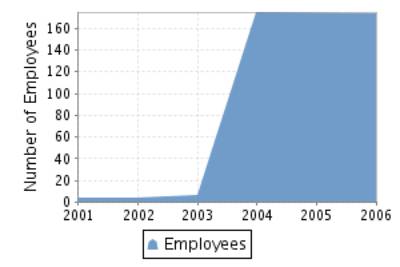
Employees 
Number of total employees: 173 (2008)
Number of fixed employees: 100,00%
Number of temporary employees: 0,00%
Employees evolution
COMMERCIAL OPERATIONS 
SALES
Collection (estimated):
National Distribution: 100%
Banks 
|
ENTITY |
BRANCH |
ADDRESS |
TOWN OR CITY |
PROVINCE |
|
BANCO BILBAO VIZCAYA ARGENTARIA, S.A. |
2400 |
AV. ZUMALAKARREGUI, 18 |
480270001 |
Vizcaya |
1 bank entities registered
Brands, Signs and Commercial
Names 
FORMER NAMES:
•
CORUS IBERIA SOCIEDAD LIMITADA.
•
BRITISH STEEL IBERIA SOCIEDAD LIMITADA.
Brand name: LAYDE (Valid)
Type: JOINT Date: 07/10/1994
Name: LAMINACION Y DERIVADOS, S.A. - LAYDE (Valid)
Type: DENOMINATIVE Date: 23/04/1996
LEGAL STRUCTURE
Constitution Data
Register Date: 12/03/1999
Register town: Vizcaya
Announcement number: 167219
Legal form: LIMITED LIABILITY COMPANY
Social Capital: 3.006 €
Current structure data 
Current Legal Form: LIMITED LIABILITY COMPANY
Current Capital: 24.146.000,00 €
Legal Aspects
Obligation to fill in Financial Statements: YES
Chamber census: YES (2006)
Listed on a Stock Exchange: NO
B.O.R.M.E.(Official Companies
Registry Gazette) 
Registered Proceedings
|
PROCEEDINGS |
DATE |
NOTICE NUM. |
TRADE REG. |
|
Resignations |
26/05/2008 |
260428 |
Vizcaya |
|
Appointments |
26/05/2008 |
260428 |
Vizcaya |
|
Re-elections |
29/04/2008 |
222628 |
Vizcaya |
|
Change of statutes |
29/04/2008 |
222628 |
Vizcaya |
|
Resignations |
19/03/2008 |
153123 |
Vizcaya |
Press articles

17/08/2001 EXPANSIÓN (INFORMATION ON LEGAL ANNOUNCE)
LAS JUNTAS GENERALES UNIVERSALES DE LAS SDADES. CORUS IBERIA, S.L.,
ANTES BRITISH STEEL IBERIA, S.L., (SDAD. ABSORBENTE) Y DE ACEROS NOBLES, S.A.
(SDAD. ABSORBIDA), CELEBRADAS EL 30/6/2001, ACORDARON LA FUSION DE LAS CITADAS
SDADES. MEDIANTE ABSORCION.
Complementary Information
Segun Borme seccion segunda de 17/08/01 esta
sociedad se encuentra en
proceso de absorber a ACEROS NOBLES SA con nif A08224941
Segun BORME (SECCION SEGUNDA) del 24/12/04 la sociedad esta en pro-
ceso de absorber a LAMINACION Y DERIVADOS SA NIF A48007470.
El balance cerrado a 31/12/2005 (Deposito 2005) esta disponible en
, pero no ha sido cargado por presentar en sus cuentas la si-
guiente anomalia: el resultado de explotacion es diferente al calcu-
lo de los Ingresos de Explotacion menos los Gastos de Explotacion.
FINANCIAL INFORMATION
The information on the last account contained in this report is
extracted from the Mercantile Register file of the legal address of the Company
and dated 29/10/2007.
BALANCE SHEET
Assets
Figures given in €
|
|
31/12/2003 (12) |
31/12/2004 (12) |
31/12/2006 (12) |
|
A) DUE FROM SHAREHOLDERS FOR UNCALLED CAPITAL |
|
|
|
|
B) FIXED ASSETS |
35.606.098,36 |
25.736.607,00 |
21.670.000,00 |
|
I. Incorporation costs |
|
|
|
|
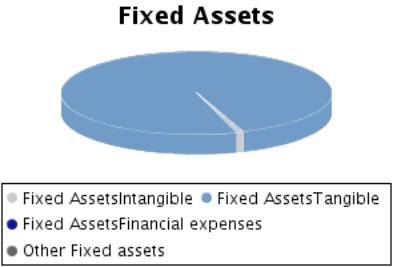
II. Intangible fixed assets |
|
19.562,00 |
166.000,00 |
|
III. Tangible fixed assets |
2.922,23 |
25.716.114,00 |
21.501.000,00 |
|
IV. Financial fixed assets |
35.603.176,13 |
931,00 |
3.000,00 |
|
V.Owners equity |
|
|
|
|
VI.Long term trade liabilities |
|
|
|
|
C) DEFERRED EXPENSES |
|
|
|
|
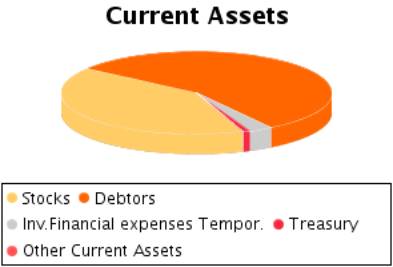
D) CURRENT ASSETS |
497.730,33 |
56.397.412,00 |
68.875.000,00 |
|
I. Shareholders by required outlays |
|
|
|
|
II. Stocks |
|
24.755.787,00 |
27.975.000,00 |
|
III. Debtors |
162.120,33 |
29.256.363,00 |
38.352.000,00 |
|
IV. Temporary financial investment |
104.557,17 |
|
1.901.000,00 |
|
V. Short-term own shares |
|
905.831,00 |
|
|
VI. Treasury |
231.052,83 |
1.128.981,00 |
645.000,00 |
|
VII. Periodification adjustments |
|
350.450,00 |
2.000,00 |
|
ASSETS (A + B + C + D) |
36.103.828,69 |
82.134.019,00 |
90.545.000,00 |
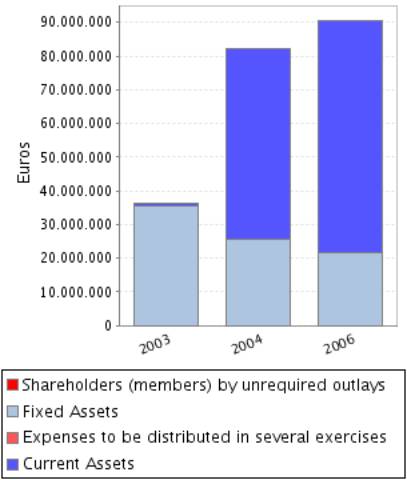
Assets composition
Liabilities
Figures given in €
|
|
31/12/2003 (12) |
31/12/2004 (12) |
31/12/2006 (12) |
|
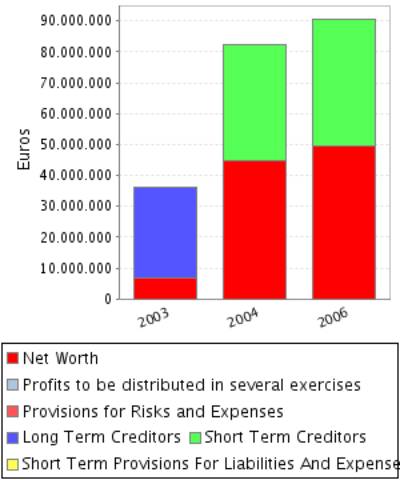
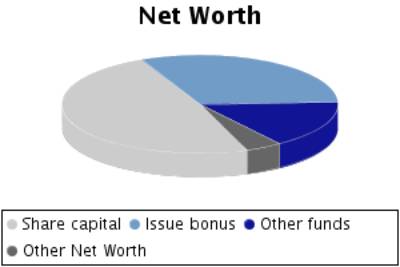
A) SHAREHOLDERS EQUITY |
6.937.593,88 |
44.683.142,00 |
49.684.000,00 |
|
I. Share capital |
6.000.000,00 |
24.145.533,00 |
24.146.000,00 |
|
II. Issue bonus |
3.872.001,15 |
15.581.923,00 |
15.582.000,00 |
|
III.Revaluation reserve |
|
|
|
|
IV.Reserves |
135.764,13 |
135.764,00 |
7.822.000,00 |
|
Capital adjustments in Euros |
|
|
|
|
Sundry reserves |
135.764,13 |
135.764,00 |
7.822.000,00 |
|
V.Results from previous years |
-2.171.966,38 |
-3.070.171,00 |
|
|
VI.Profit and Losses |
-898.205,02 |
7.890.093,00 |
2.134.000,00 |
|
VII.Dividend paid during the year |
|
|
|
|
VIII.Own shares for capital reduction |
|
|
|
|
B) DEFERRED INCOME |
|
|
|
|
C) PROVISIONS FOR LIABILITIES AND EXPENSES |
|
|
|
|
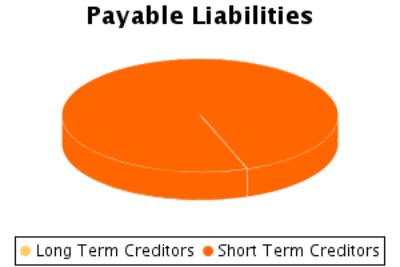
D) LONG TERM LIABILITIES |
29.023.030,97 |
|
|
|
E) SHORT TERM LIABILITIES |
143.203,84 |
37.450.877,00 |
40.861.000,00 |
|
F) SHORT TERM PROVISIONS FOR LIABILITIES AND
EXPENSES |
|
|
|
|
LIABILITIES (A + B + C + D + E + F) |
36.103.828,69 |
82.134.019,00 |
90.545.000,00 |
Liabilities
Composition
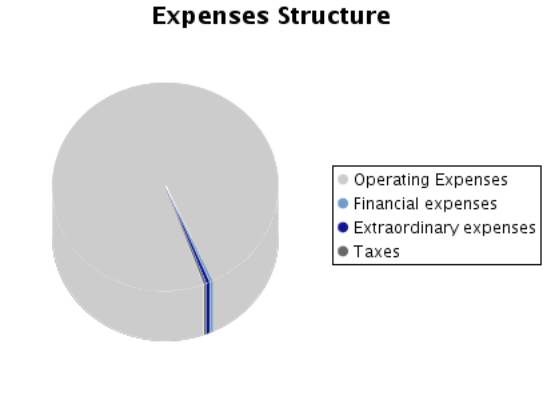
PROFIT AND LOSS ACCOUNT
Itams of the Profit
and Loss Account
Figures given in €
|
|
31/12/2003 (12) |
31/12/2004 (12) |
31/12/2006 (12) |
|
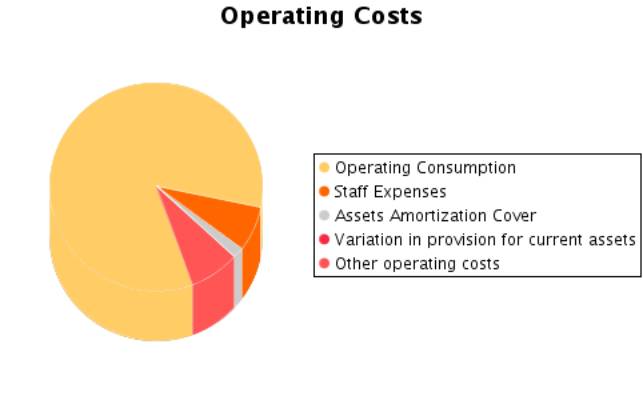
A) EXPENSES (A.1 a A.15) |
1.219.997,36 |
93.404.751,00 |
117.527.000,00 |
|
A.1.Operating costs |
|
73.752.782,00 |
97.195.000,00 |
|
A.2. Labour cost |
248.347,81 |
8.567.945,00 |
7.965.000,00 |
|
Wages |
210.253,09 |
8.567.945,00 |
6.145.000,00 |
|
Social security expenses |
38.094,72 |
|
1.820.000,00 |
|
A.3. Assets depreciation |
3.018,59 |
1.304.730,00 |
1.960.000,00 |
|
A.4. Variation in provision for current assets |
|
246.136,00 |
47.000,00 |
|
A.5. Other operating costs |
50.690,41 |
7.648.367,00 |
8.763.000,00 |
|
A.I. OPERATING RESULT (B.1-A.1-A.2-A.3-A.4-A.5) |
18.700,62 |
9.774.884,00 |
3.399.000,00 |
|
A.6.Financial expenses and similar |
917.940,55 |
1.106.073,00 |
626.000,00 |
|
Debts with related companies |
|
|
|
|
Debts with associated companies |
|
|
|
|
Other companies debts
By debts with third parties and similar expenses |
917.940,55 |
1.106.073,00 |
626.000,00 |
|
Losses from
financial investments |
|
|
|
|
A.7. Variation
in financial investment provision |
|
|
|
|
A.8.Negative
exchange difference |
|
|
|
|
A.II.POSITIVE
FINANCIAL RESULTS (B.2+B.3-A.6-A.7-A.8) |
|
|
|
|
A.III.PROFIT
FROM ORDINARY ACTIVITIES (A.I+A.II-B.I-B.II) |
|
8.668.811,00 |
2.804.000,00 |
|
A.9. Variation
in provision in fixed assets |
|
|
|
|
A.10. Losses in fixed assets |
|
|
|
|
A.11. Losses from own shares and bonds |
|
|
|
|
A.12. Extraordinary charges |
|
1.013.960,00 |
405.000,00 |
|
A.13.Other exercises’ expenses and losses |
|
|
162.000,00 |
|
A.IV.POSITIVE EXTRAORDINARY
RESULT (B.4+B.5+B.6+B.7+B.8-A.9-A.10-A.11-A.12-A.13) |
|
|
|
|
A.V.PROFIT BEFORE TAXES (A.III+A.IV-B.III-B.IV) |
|
7.654.851,00 |
2.538.000,00 |
|
A.14.Corporate Taxes |
|
-235.242,00 |
404.000,00 |
|
A.15. Other taxes |
|
|
|
|
A.VI.EXERCISE RESULT (PROFIT) (A.V-A.14-A.15) |
|
7.890.093,00 |
2.134.000,00 |
|
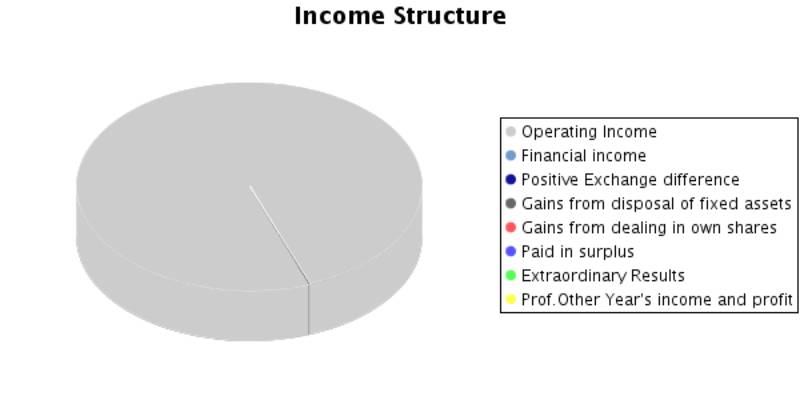
B) INCOMES (B.1 a B.8) |
321.792,34 |
101.294.844,00 |
119.661.000,00 |
|
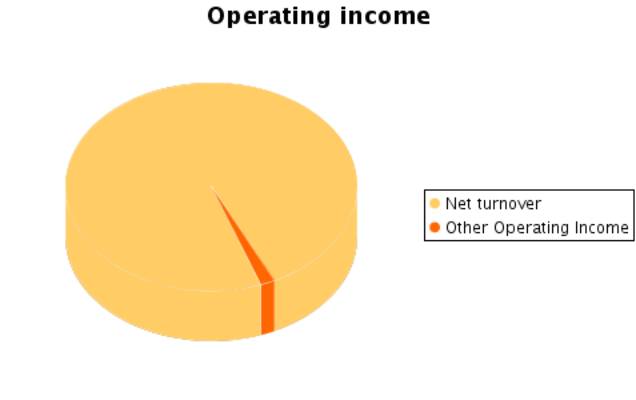
B.1.Operating income |
320.757,43 |
101.294.844,00 |
119.329.000,00 |
|
Turnover |
191.530,72 |
100.896.130,00 |
117.437.000,00 |
|
Other operating income |
129.226,71 |
398.714,00 |
1.892.000,00 |
|
B.I.OPERATING LOSSES (A.1+A.2+A.3+A.4+A.5-B.1) |
|
|
|
|
B.2.Financial Income |
1.034,91 |
|
31.000,00 |
|
From affiliated companies |
|
|
|
|
From associated companies |
|
|
|
|
Other |
1.034,91 |
|
31.000,00 |
|
Gains from investments |
|
|
|
|
B.3. Positive change difference |
|
|
|
|
B.II. NEGATIVE FINANCIAL RESULTS
(A.6+A.7+A.8-B.2-B.3) |
916.905,64 |
1.106.073,00 |
595.000,00 |
|
B.III.LOSSES FROM ORDINARY ACTIVITIES
(B.I+B.II-A.I-A.II) |
898.205,02 |
|
|
|
B.4.B.9. Gains from disposal of fixed assets |
|
|
301.000,00 |
|
B.5.Gains from dealing in own shares |
|
|
|
|
B.6. Paid in surplus |
|
|
|
|
B.7. Extraordinary income |
|
|
|
|
B.8.Other year’s income and profits |
|
|
|
|
B.IV.NEGATIVE
EXTRAORDINARY LOSSES (A.9+A.10+A.11+A.12+A.13-B.4-B.5-B.6-B.7-B.8) |
|
1.013.960,00 |
266.000,00 |
|
B.V.LOSS BEFORE TAXES (B.III+B.IV-A.III-A.IV) |
898.205,02 |
|
|
|
B.VI.EXERCISE RESULTS (LOSS) (B.V+A.14+A.15) |
898.205,02 |
|
|
Composition of the
Profit and Loss Account
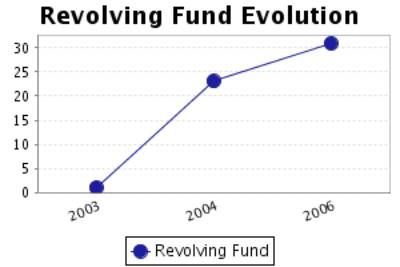
FINANCIAL BALANCE
Here the Main Capital Amounts of the company and the Revolving
Fund Evolution are analysed.
Financial Balance
Table
Figures given in €
|
|
31/12/2003 (12) |
% |
31/12/2004 (12) |
% |
31/12/2006 (12) |
% |
|
A) DUE FROM SHAREHOLDERS FOR UNCALLED CAPITAL |
|
|
|
|
|
|
|
B) FIXED ASSETS |
35.606.098,36 |
98,62 |
25.736.607,00 |
31,33 |
21.670.000,00 |
23,93 |
|
C) DEFERRED EXPENSES |
|
|
|
|
|
|
|
D) CURRENT ASSETS |
497.730,33 |
1,38 |
56.397.412,00 |
68,67 |
68.875.000,00 |
76,07 |
|
ASSETS (A + B + C + D) |
36.103.828,69 |
|
82.134.019,00 |
|
90.545.000,00 |
|
|
|
||||||
|
A) SHAREHOLDERS
EQUITY |
6.937.593,88 |
19,22 |
44.683.142,00 |
54,40 |
49.684.000,00 |
54,87 |
|
B) DEFERRED
INCOME |
|
|
|
|
|
|
|
C) PROVISIONS
FOR LIABILITIES AND EXPENSES |
|
|
|
|
|
|
|
D) LONG TERM
LIABILITIES |
29.023.030,97 |
80,39 |
|
|
|
|
|
E) SHORT TERM
LIABILITIES |
143.203,84 |
0,40 |
37.450.877,00 |
45,60 |
40.861.000,00 |
45,13 |
|
F) SHORT TERM PROVISIONS
FOR LIABILITIES AND EXPENSES |
|
|
|
|
|
|
|
LIABILITIES (A +
B + C + D + E + F) |
36.103.828,69 |
|
82.134.019,00 |
|
90.545.000,00 |
|
Financial Balance
Composition
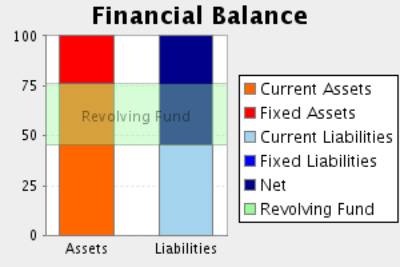
Comments on Financial
Balance
In the 2003, the assets of the company were formed in 98,62% of Fixed
Assets and in 1,38% of Current Assets.This assets were financed in 19,22% with own
capitals, and in 80,39% with long term debt and in 0,40% with current
liabilities.
The result of this financial structure is a positive turnover fund of
354.526,49 Euros, which is equivalent to 0,98% proportion of the
company’s total assets.
In the 2004, the assets of the company were formed in 31,33% of Fixed
Assets and in 68,67% of Current Assets.This assets were financed in 54,40% with
own capitals and in 45,60% with current liabilities.
The result of this financial structure is a positive turnover fund of
18.946.535,00 Euros, which is equivalent to 23,07% proportion of the
company’s total assets.
This measure has increased with respect to the previous exercise in
5.244,18% having also increased its proportion with respect to the total assets
of the company.
In the 2006, the assets of the company were formed in 23,93% of Fixed
Assets and in 76,07% of Current Assets.This assets were financed in 54,87% with
own capitals and in 45,13% with current liabilities.
The result of this financial structure is a positive turnover fund of
28.014.000,00 Euros, which is equivalent to 30,94% proportion of the
company’s total assets.
RATIOS
Main Ratios
|
|
31/12/2003 (12) |
31/12/2004 (12) |
31/12/2006 (12) |
|
STRUCTURAL RATIOS |
|
|
|
|
Management fund |
354.526,49 |
18.946.535,00 |
28.014.000,00 |
|
Management Fund Requirement |
|
|
40.484.000,00 |
|
Indebtedness (%) |
80,78 |
45,60 |
45,13 |
|
External Funds on Net Worth |
4,20 |
0,84 |
0,82 |
|
GENERAL ACTIVITY RATIO |
|
|
|
|
Turnover Increase (%) |
41,97 |
52.578,82 |
|
|
Added value growth (%) |
46,14 |
7.266,21 |
|
|
Cash Flow |
-895.186,43 |
9.440.959,00 |
4.141.000,00 |
|
Labour Productivity |
1,09 |
2,32 |
1,68 |
|
Assets turnover |
0,00 |
1,23 |
1,30 |
|
Breakdown Point |
302.056,81 |
65.344.545,51 |
101.004.284,00 |
|
Security Margin of the Breakdown Point (%) |
5,83 |
35,49 |
15,36 |
|
ACTIVITY RATIOS |
|
|
|
|
Average Payment Period |
|
|
31 |
|
Average Collection Period |
305 |
104 |
118 |
|
Inventory Turnover Period |
|
88 |
86 |
|
SOLVENCY RATIOS |
|
|
|
|
Payback Capacity |
-0,03 |
0,25 |
0,10 |
|
Assets Guarantee |
1,24 |
2,19 |
2,22 |
|
Short Term Debts Proportion (%) |
0,49 |
100,00 |
100,00 |
|
Interest Coverage |
-0,98 |
8,54 |
6,08 |
|
LIQUIDITY RATIOS |
|
|
|
|
Current Ratio |
3,48 |
1,51 |
1,69 |
|
Immediate liquidity |
2,34 |
0,03 |
0,06 |
|
Treasury |
|
|
-12.470.000,00 |
|
Sales on Current Assets |
139 |
644 |
614 |
Results Analysis
Ratios
|
|
31/12/2003 (12) |
31/12/2004 (12) |
31/12/2006 (12) |
|
Economic profitability (%) |
0,05 |
11,90 |
3,75 |
|
Operating Profitability (%) |
9,76 |
9,69 |
2,89 |
|
Equity gearing |
-249,96 |
1,63 |
1,50 |
|
Financial profitability (%) |
-12,95 |
17,66 |
4,30 |
|
General Profitability (%) |
-468,96 |
7,82 |
1,82 |
Comments on the
Results Analysis Ratios
The economic profitability in the year2004 achieved a 11,90% positive
level, due to a 9,69% economic margin and to an assets turnover of1,23%.
The economic profitability in the year has increased from 0,05% up to
11,90%. This growth is due to the assets turnover increase, from 0,00% to the
current 1,23, as operating profitability has dropped from 9,76% up to reaching
9,69%.
Financial profitability on 2004 achieved a 17,66%.
The company’s financial structure has instigated its economic
profitability with an indebtedness level of 1,63.
The general profitability on 2004 achieved a 7,82%.
SECTORIAL ANÁLYSIS
Large Capital Amounts
and Financial Balance
Figures given in %
|
|
COMPANY (2006) |
SECTOR |
DIFFERENCE |
DIFFERENCE RELATIVE |
|
|
|
|
|
|
ASSETS |
|
|
|
|
|
|
|
|
|
|
A) DUE FROM
SHAREHOLDERS FOR UNCALLED CAPITAL |
|
0,00 |
|
|
|
|
|
|
|
|
B) FIXED ASSETS |
23,93 |
52,43 |
-28,50 |
-54,36 |
|
|
|
|
|
|
C) DEFERRED
EXPENSES |
|
0,10 |
|
|
|
|
|
|
|
|
D) CURRENT ASSETS |
76,07 |
47,47 |
28,60 |
60,26 |
|
|
|
|
|
|
ASSETS (A + B + C + D) |
100 |
100 |
|
|
|
|
|
|
|
|
|
|
|
|
|
|
|
|
|
|
|
|
COMPANY (2006) |
SECTOR |
DIFFERENCE |
DIFFERENCE RELATIVE |
|
|
|
|
|
|
LIABILITIES |
|
|
|
|
|
|
|
|
|
|
A) SHAREHOLDERS
EQUITY |
54,87 |
43,65 |
11,22 |
25,70 |
|
|
|
|
|
|
B) DEFERRED INCOME |
|
0,24 |
|
|
|
|
|
|
|
|
C) PROVISIONS
FOR LIABILITIES AND EXPENSES |
|
2,44 |
|
|
|
|
|
|
|
|
D) LONG TERM
LIABILITIES |
|
16,06 |
|
|
|
|
|
|
|
|
E) SHORT TERM
LIABILITIES |
45,13 |
37,56 |
7,58 |
20,17 |
|
|
|
|
|
|
F) SHORT TERM PROVISIONS
FOR LIABILITIES AND EXPENSES |
|
0,05 |
|
|
|
|
|
|
|
|
LIABILITIES (A + B + C + D + E + F) |
100 |
100 |
|
|
|
|
|
|
|
Financial Balance
Composition
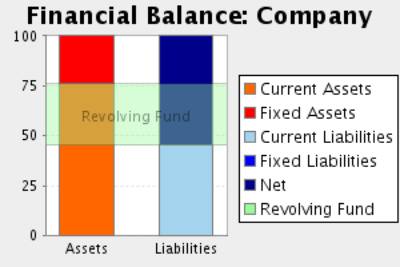
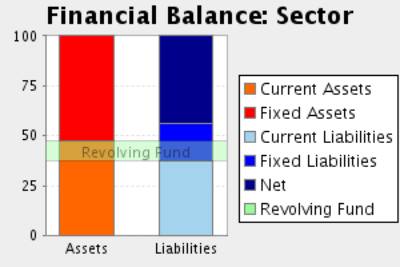
Comments to the
Sectorial Analysis
In the 2006, the assets of the company were formed in 23,93% of fixed
assets and in 76,07Current Assets % In the sector, the proportion of fixed
assets was of 52,53%, 54,45% superior, and the proportion of current assets was
of 47,47%, 60,26% inferior.
The assets were financed in the company in 54,87% with own capitals and
in 45,13% with current liabilities In the sector, the self financing
represented 43,89%, 25,01% inferior. On the other hand the long term debts
represented in the sector an average of 37,60% financing, with a relative
difference of 20,02% in favour of the company
The result of this company’s financial structure is a turnover fund that
represents 30,94% of the total assets; in the sector, this same proportion is
9,86%, therefore, we can say that the company’s turnover fund is 213,67% higher
than the one in of the sector.
Analytical Account of
Results
Figures given in %
|
|
COMPANY (2006) |
SECTOR |
DIFFERENCE |
DIFFERENCE RELATIVE |
|
Turnover |
98,41 |
99,68 |
-1,27 |
-1,28 |
|
Other operating income |
1,59 |
0,32 |
1,27 |
400,00 |
|
Production Value |
100,00 |
100,00 |
0,00 |
0,00 |
|
Operating expenses |
81,45 |
67,12 |
14,33 |
21,36 |
|
Other operation expenses |
7,34 |
15,50 |
-8,16 |
-52,63 |
|
Added value |
11,21 |
17,39 |
-6,18 |
-35,53 |
|
Labour cost |
6,67 |
7,73 |
-1,06 |
-13,76 |
|
Gross Economic Result |
4,53 |
9,65 |
-5,12 |
-53,07 |
|
Assets depreciation |
1,64 |
3,78 |
-2,14 |
-56,56 |
|
Variation in provision for current assets and bad debt losses |
0,04 |
0,24 |
-0,20 |
-83,12 |
|
Net Economic Result |
2,85 |
5,64 |
-2,79 |
-49,48 |
|
Financial income |
0,03 |
1,38 |
-1,35 |
-97,82 |
|
Financial Charges |
0,52 |
1,76 |
-1,24 |
-70,42 |
|
Variation in financial investment provision |
|
-0,02 |
|
|
|
Ordinary Activities Result |
2,35 |
5,28 |
-2,93 |
-55,47 |
|
Extraordinary income |
0,25 |
0,44 |
-0,19 |
-43,69 |
|
Extraordinary charges |
0,48 |
0,41 |
0,07 |
17,36 |
|
Variation in provision in fixed assets |
|
0,16 |
|
|
|
Results before Taxes |
2,13 |
5,15 |
-3,02 |
-58,66 |
|
Corporate taxes |
0,34 |
1,48 |
-1,14 |
-76,95 |
|
Net Result |
1,79 |
3,68 |
-1,89 |
-51,32 |
|
Assets depreciation |
1,64 |
3,78 |
-2,14 |
-56,56 |
|
Change of Provisions |
0,04 |
0,38 |
-0,34 |
-89,53 |
|
Net Self-Financing |
3,47 |
7,83 |
-4,36 |
-55,71 |
Main Ratios
|
|
COMPANY (2006) |
PTILE25 |
PTILE50 |
PTILE75 |
|
STRUCTURAL RATIOS |
|
|
|
|
|
Management fund |
28.014.000,00 |
-14.548,45 |
17.757,98 |
70.503,47 |
|
Management Fund Requirement |
40.484.000,00 |
-57.993,53 |
-18.607,05 |
15.485,98 |
|
Indebtedness (%) |
45,13 |
52,50 |
58,67 |
73,89 |
|
External Funds on Net Worth |
0,82 |
1,11 |
1,43 |
2,84 |
|
GENERAL ACTIVITY
RATIO |
|
|
|
|
|
Cash Flow |
4.141.000,00 |
7.966,56 |
19.473,74 |
38.938,96 |
|
Labour Productivity |
1,68 |
1,76 |
2,06 |
2,66 |
|
Assets turnover |
1,30 |
0,97 |
1,36 |
1,67 |
|
Breakdown Point |
101.004.284,00 |
156.503.369,46 |
214.712.105,03 |
412.083.371,73 |
|
Security Margin of the Breakdown Point (%) |
15,36 |
10,86 |
16,06 |
28,31 |
|
ACTIVITY RATIOS |
|
|
|
|
|
Average Payment Period |
31 |
41 |
93 |
103 |
|
Average Collection Period |
118 |
61 |
77 |
98 |
|
Inventory Turnover Period |
86 |
37 |
46 |
67 |
|
SOLVENCY RATIOS |
|
|
|
|
|
Payback Capacity |
0,10 |
0,09 |
0,16 |
0,25 |
|
Assets Guarantee |
2,22 |
1,35 |
1,71 |
1,90 |
|
Short Term Debts Proportion (%) |
100,00 |
58,07 |
78,61 |
96,66 |
|
Interest Coverage |
6,08 |
3,83 |
7,54 |
18,73 |
|
LIQUIDITY RATIOS |
|
|
|
|
|
Current Ratio |
1,69 |
0,91 |
1,29 |
1,40 |
|
Immediate liquidity |
0,06 |
0,00 |
0,01 |
0,36 |
|
Treasury |
-12.470.000,00 |
-26.371,82 |
-82,57 |
4.422,12 |
|
Sales on Current Assets |
614 |
738 |
862 |
998 |
Results Analysis
Ratios
|
|
COMPANY (2006) |
PTILE25 |
PTILE50 |
PTILE75 |
|
Economic profitability (%) |
3,75 |
3,65 |
5,65 |
14,37 |
|
Operating Profitability (%) |
2,89 |
3,10 |
5,57 |
9,17 |
|
Equity gearing |
1,50 |
2,10 |
2,37 |
3,68 |
|
Financial profitability (%) |
4,30 |
5,23 |
13,84 |
23,69 |
|
General Profitability (%) |
1,82 |
1,88 |
3,81 |
5,87 |
NOTES
The latest financial statement sheet in the
Mercantile Register is 2006 year.The information include in your enquiry is
correct.
FOREIGN EXCHANGE
RATES
|
Currency |
Unit
|
Indian Rupees |
|
US Dollar |
1 |
Rs.43.21 |
|
UK Pound |
1 |
Rs.85.72 |
|
Euro |
1 |
Rs.67.92 |
RATING
EXPLANATIONS
|
RATING |
STATUS |
PROPOSED CREDIT LINE |
|
|
>86 |
Aaa |
Possesses an extremely sound financial base with the strongest capability
for timely payment of interest and principal sums |
Unlimited |
|
71-85 |
Aa |
Possesses adequate working capital. No caution needed for credit
transaction. It has above average (strong) capability for payment of interest
and principal sums |
Large |
|
56-70 |
A |
Financial & operational base are regarded healthy. General
unfavourable factors will not cause fatal effect. Satisfactory capability for
payment of interest and principal sums |
Fairly Large |
|
41-55 |
Ba |
Overall operation is considered normal. Capable to meet normal
commitments. |
Satisfactory |
|
26-40 |
B |
Unfavourable & favourable factors carry similar weight in credit
consideration. Capability to overcome financial difficulties seems comparatively
below average. |
Small |
|
11-25 |
Ca |
Adverse factors are apparent. Repayment of interest and principal sums
in default or expected to be in default upon maturity |
Limited with
full security |
|
<10 |
C |
Absolute credit risk exists. Caution needed to be exercised |
Credit not
recommended |
|
NR |
In view of the lack of information, we have no basis upon which to
recommend credit dealings |
No Rating |
|
This score serves as a reference to assess SC’s credit risk
and to set the amount of credit to be extended. It is calculated from a
composite of weighted scores obtained from each of the major sections of this
report. The assessed factors and their relative weights (as indicated through
%) are as follows:
Financial
condition (40%) Ownership
background (20%) Payment
record (10%)
Credit history
(10%) Market trend
(10%) Operational
size (10%)