![]()
MIRA
INFORM REPORT
|
Report Date : |
03.07.2008 |
IDENTIFICATION
DETAILS
|
Name : |
GONVARRI INDUSTRIAL SL |
|
|
|
|
Registered Office : |
|
|
|
|
|
Country : |
Spain |
|
|
|
|
Financials (as on) : |
31.12.2006 |
|
|
|
|
Date of Incorporation : |
|
|
|
|
|
Legal Form : |
Limited Liability Company |
|
|
|
|
Line of Business : |
RATING &
COMMENTS
|
MIRA’s Rating : |
Aa |
|
RATING |
STATUS |
PROPOSED CREDIT LINE |
|
|
71-85 |
Aa |
Possesses adequate working capital. No caution needed for credit
transaction. It has above average (strong) capability for payment of interest
and principal sums |
Large |
|
Maximum Credit Limit : |
6.000.000,00 € |
|
|
|
|
Status : |
Very Good |
|
|
|
|
Payment Behaviour : |
Regular |
|
|
|
|
Litigation : |
Clear |
FINANCIAL
REPORT
GONVARRI INDUSTRIAL SL
TAX NUMBER: B28088045
EXECUTIVE SUMMARY
Identification
Current Business Name: GONVARRI INDUSTRIAL SL
Commercial Name: GONVARRI INDUSTRIAL, S.A. ( GONINSA )
Other names: YES
Current Address: STREET EMBAJADORES
(PROLONGACION), S/N, CP 28018 MADRID
Branches: 4
Telephone number: 913791900 Fax: 913791949
URL: www.gonvarri.com
Corporate e-mail: info@gonvarri.com
Commercial Risk
Credit Appraisal:
6.000.000,00 €
Legal Actions: NO
Financial Information
Latest Balance sheet sales (2006): 600.777.000,00 € (MERCANTILE REGISTER)
Result: 51.013.000 €
Total Assets: 646.568.000 €
Social Capital: 29.886.000,00 €
Employees: 627
Commercial Information
Constitution Date: 03/09/1958
Business activity: Wholesale of
minerals
NACE Code: 5152
International Operations: Exports
Corporate Structure
President:
Parent Company:
HOLDING
GONVARRI SOCIEDAD LIMITADA.
Participations: 11
Credit Appraisal
Maximum Credit (from 0 a 6,000,000 €):
6.000.000,00 €
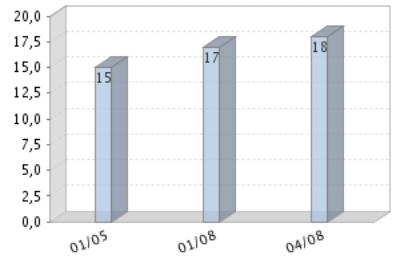
Rating Evolution
Financial Situation
Fiscal year2006
|
Treasury |
Excellent |
|
Indebtedness |
Very Weak |
|
Profitability |
Sufficient |
|
Balance |
Excellent |
Performance
|
Legal Actions |
None or Negligible |
|
Business
Trajectory |
Excellent |
INCIDENTS

Summary
LEGAL ACTIONS: No legal incidences registered
CLAIM FILED AGAINST THE ADMINISTRATION: No administrative
claims registered
AFFECTED BY:
5 Company / Companies in Insolvency Proceedings.
FINANCIAL ELEMENTS AND SECTORIAL
COMPARATIVE
FINANCIAL ELEMENTS
Figures given in thousands €
|
|
2004 (12) |
2005 (12) |
2006 (12) |
% ASSETS |
|
|
|
|
|
|
BALANCE SHEET ANALYSIS |
|
|
|
|
|
|
|
|
|
|
OWN FUNDS |
369.959,00 |
367.967,00 |
409.500,00 |
63,33 |
|
|
|
|
|
|
DEBT |
262.608,00 |
221.895,00 |
237.068,00 |
36,67 |
|
|
|
|
|
|
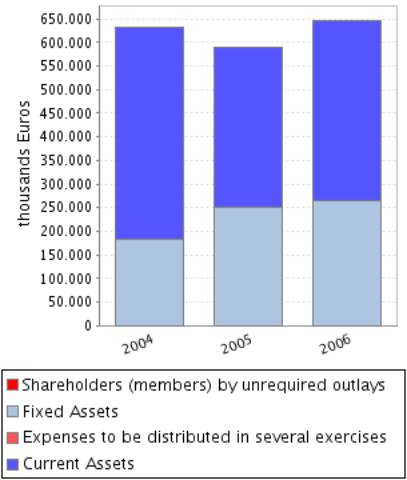
FIXED ASSETS |
182.587,00 |
249.613,00 |
265.450,00 |
41,06 |
|
|
|
|
|
|
TOTAL ASSETS |
632.567,00 |
589.862,00 |
646.568,00 |
|
|
|
|
|
|
|
|
|
|
|
|
|
|
|
|
|
|
|
2004 (12) |
2005 (12) |
2006 (12) |
% SALES |
|
|
|
|
|
|
PROFIT AND LOSS ACCOUNT ANALYSIS |
|
|
|
|
|
|
|
|
|
|
SALES |
563.018,00 |
541.227,00 |
600.777,00 |
|
|
|
|
|
|
|
ADDED VALUE |
111.308,00 |
80.155,00 |
100.411,00 |
16,71 |
|
|
|
|
|
|
EBITDA |
84.421,00 |
54.948,00 |
74.464,00 |
12,39 |
|
|
|
|
|
|
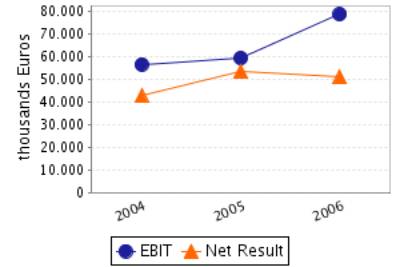
EBIT |
56.680,00 |
59.539,00 |
78.876,00 |
13,13 |
|
|
|
|
|
|
NET RESULT |
42.628,00 |
53.661,00 |
51.013,00 |
8,49 |
|
|
|
|
|
Balance Sheets Items
Analysis
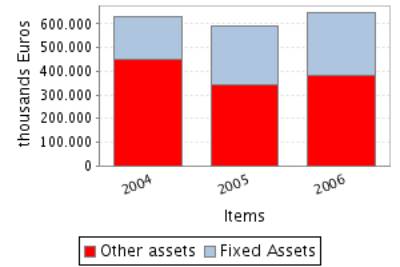
Balance Sheet
Comments
Total assets of the company decreased in 6,75% between 2004 and 2005.
In spite of the decrease in the amount of total assets, fixed assets
grew 36,71%.
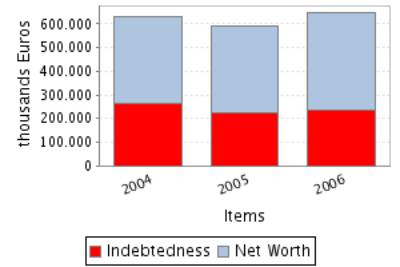
Assets reduction is partly explained by the net worth decrease of0,54%
nevertheless, the decrease of 15,50% in the indebtedness explains mainly this
reduction.
Total assets of the company grew 9,61% between 2005 and 2006.
This growth has been inferior in the case of the fixed assets that
increased just in 6,34%.
This growth has been financed, on a wider scale, with a Shareholders’
equity increase of 11,29% and in a smaller proportion with an debt increase of
6,84%.
Profit and Loss Account Analysis
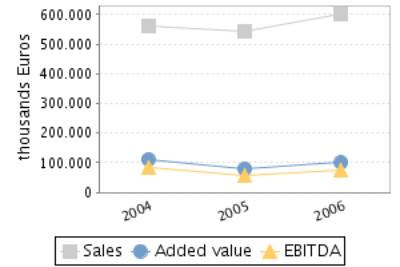
Profit and Loss
Account Comments
The company’s sales figure decreased in 3,87% between 2004 and 2005.
The company’s EBIT grew 5,04% between 2004 and 2005.
This evolution implies an increase in the company’s operating
profitability.
The result of these variations is an increase of the company’s Economic
Profitability of 12,65% in the analysed period, being this profitability of 10,09%
in the year 2005.
The company’s Net Result grew 25,88% between 2004 and 2005.
This evolution, compared to the EBIT’s performance, implies that the
financial and extraordinary activities have had a positive effect in the
company’s Financial Profitability.
The result of these variations is an increase of the company’s Economic
Profitability of 26,56% in the analysed period, being equal to 14,58% in the
year 2005.
The company’s sales figure grew 11,00% between 2005 and 2006.
The company’s EBIT grew 32,48% between 2005 and 2006.
This evolution implies an increase in the company’s operating
profitability.
The result of these variations is an increase of the company’s Economic
Profitability of 20,86% in the analysed period, being this profitability of
12,20% in the year 2006.
The company’s Net Result decreased in 4,93% between 2005 and 2006.
This evolution, compared to the EBIT’s performance, implies that the
financial and extraordinary activities have had a negative effect in the
company’s Financial Profitability.
The result of these variations is a reduction of the company’s
profitability of 14,58% in the analysed period, being equal to 12,46% in the
year 2006.
ANNUAL FINANCIAL REPORT
ADDITIONAL DATA
Source: annual financial report 2006
Results Distribution
Figures given in €
|
DISTRIBUTION
BASE |
DISTRIBUTION TO |
||
|
Profit and Loss |
51.013.000,00 |
Retained earnings |
0,00 |
|
Carry Over |
0,00 |
Voluntary Reserve |
6.013.000,00 |
|
Voluntary reserves |
0,00 |
Prior years losses |
0,00 |
|
Reserves |
0,00 |
Carry Over |
0,00 |
|
Other concepts |
0,00 |
Other funds |
0,00 |
|
Total of Amounts to be distributed |
51.013.000,00 |
Dividends |
45.000.000,00 |
|
|
|
Other Applications |
0,00 |
Auditing
Auditors’ opinion: FAVOURABLE WITH RESERVATIONS
Auditor: ERNST & YOUNG S.L.
Auditing exceptions:
LA SOCIEDAD VALORO LAS EXISTENCIAS DE MATERIAS PRIMAS AL CIERRE DEL
EJERCICIO 2005, INCLUYENDO LAS INCORPORADAS AL PRODUCTO TERMINADO, CONFORME A
SU VALOR DE REPOSICION, EL CUAL ERA INFERIOR AL PRECIO MEDIO DE ADQUISICION. LA
VALORACION ANTERIOR SE REALIZO SOBRE LA BASE DE LOS PRECIOS ESTIMADOS DE
REPOSICION DE LA MATERIA PRIMA DE ACUERDO CON LOS PEDIDOS EXISTENTES AL 30 DE
NOVIEMBRE DE 2005. DADO QUE NO DISPUSIMOS DE UN ESTUDIO ACTUALIZADO DE LOS
PRECIOS DE REPOSICION AL 31 DE DICIEMBRE DE 2005, NO NOS FUE POSIBLE VERIFICAR
EL EFECTO SOBRE EL VALOR DE LAS EXISTENCIAS AL CIERRE DEL EJERCICIO 2005. POR
CONSIGUIENTE NO NOS ES POSIBLE CUANTIFICAR EN EL EJERCICIO 2006 EL EFECTO QUE
ESTE HECHO TIENE EN LA CIFRA DE CONSUMOS DE MATERIAS PRIMAS Y OTRAS MATERIAS
CONSUMIBLES Y AUMENTO DE EXISTENCIAS DE PRODUCTO TERMINADO Y EN CURSO DE
FABRICACION DE LA CUENTA DE PERDIDAS Y GANANCIAS DEL EJERCICIO 2006 ADJUNTA.
FALTA DE INFORMACION SOBRE LOS ADMINISTRADORES REQUERIDA POR EL ARTICULON
COMPARATIVE SECTOR ANALYSIS
Values table
Figures expressed in %
|
|
COMPANY (2006) |
SECTOR |
DIFFERENCE |
DIFFERENCE RELATIVE |
|
|
|
|
|
|
BALANCE SHEET
ANALYSIS: % on the total assets |
|
|
|
|
|
|
|
|
|
|
OWN FUNDS |
63,33 |
40,28 |
23,06 |
57,25 |
|
|
|
|
|
|
DEBT |
36,67 |
59,72 |
-23,06 |
-38,61 |
|
|
|
|
|
|
FIXED ASSETS |
41,06 |
39,26 |
1,80 |
4,58 |
|
|
|
|
|
|
|
|
|
|
|
|
|
|
|
|
|
|
COMPANY (2006) |
SECTOR |
DIFFERENCE |
DIFFERENCE RELATIVE |
|
|
|
|
|
|
PROFIT AND LOSS
ACCOUNT ANALYSIS: % on the total operating income |
|
|
|
|
|
|
|
|
|
|
SALES |
97,68 |
99,44 |
-1,76 |
-1,77 |
|
|
|
|
|
|
ADDED VALUE |
16,33 |
5,38 |
10,94 |
203,17 |
|
|
|
|
|
|
EBIT |
12,82 |
2,14 |
10,68 |
499,27 |
|
|
|
|
|
|
NET RESULT |
8,29 |
1,76 |
6,54 |
372,33 |
|
|
|
|
|
Sector Composition
Compared sector (NACE): 515
Number of companies: 166
Size (Sales Figure) : > 40.000.000,00 Euros
Comments on the
sectorial comparative
Compared to its sector the assets of the companies show a greater
proportion of fixed assets. Specifically the difference with the sector average
is 1,80% , which means a relative difference of 4,58% .
In liabilities composition the company appeals on a wider scale to self
financing, being the proportion of net worth of 23,06% superior, which means a
relative difference of 57,25% . As a consequence, external financing sources
are less used by the company in 23,06% less than the sector, which means a
difference of 38,61% .
The proportion that the sales mean to the company’s total ordinary
income is 97,68%, 1,76% lower than in the sector, which means a relative
difference of 1,77% .
The company’s EBIT was positive and was 12,82% with regard to the total
ordinary income, 10,68% higher than in the sector, which means a relative difference
of 499,27% .
The company’s capacity to generate operating income is higher than the
one of the sector as its ratio EBIT/Sales is higher (ES Company versus ES
Sector).
The company’s net result was positive and equal to 8,29% with regard to
the total ordinary income, 6,54% higher than in the sector, which means a
relative difference of 372,33% .
The financial and extraordinary results and the tax impact have had a
negative impact on the Net result in the company with a worse behaviour than in
the sector; as a consequence, the company shows a worse Net Result/EBIT ratio
(REBEmpresa vs. REBSector).
ADDRESSES
Current Legal Seat Address:
STREET EMBAJADORES (PROLONGACION), S/N
28018
MADRID
Characteristics of
the current address
Type of premises: office
Property Description: Sin especificar
Local Situation: secondary
Branches 
|
STREET |
POSTAL CODE |
TOWN |
PROVINCE |
|
STREET MUELLE ARAGON S/N PUERTO DE TARRAGONA |
43004 |
TARRAGONA |
Tarragona |
|
POLIGONO INDUSTRIAL SAN VICENTE, S/N |
08755 |
CASTELLBISBAL |
Barcelona |
|
POLIGONO INDUSTRIAL DE GAMONAL-VILLIMAR, C/LA BU |
09007 |
BURGOS |
Burgos |
|
PARTIDA CALLE VILLA GRIS S/N |
46520 |
EL PUERTO |
Valencia |
4 branches registered
CORPORATE STRUCTURE
ADMINISTRATIVE LINKS
Main Board members,
Directors and Auditor ![]()
|
POSITION |
SURNAMES AND
NAME |
APPOINTMENT DATE |
|
|
PRESIDENT |
CORPORACION GESTAMP S.L |
17/01/2008 |
|
|
VICEPRESIDENT |
URQUIJO FERNANDEZ DE ARAOZ GONZALO |
17/01/2008 |
|
|
MANAGING DIRECTOR |
RIBERAS MERA JUAN MARIA |
17/01/2008 |
|
|
CHIEF OFFICER |
RIBERAS MERA FRANCISCO JOSE |
17/01/2008 |
|
|
CHIEF OFFICER |
ARRANZ ESPINO ANTONIO |
17/01/2008 |
|
|
CHIEF OFFICER |
DE LA RICA BASAGOITI JOSE MIGUEL |
17/01/2008 |
|
|
CHIEF OFFICER |
AGRICOLA LA VEGUILLA SA |
17/01/2008 |
|
|
CHIEF OFFICER |
DARMAYAN PHILIPPE |
17/01/2008 |
|
|
CHIEF OFFICER |
BAUDON PHILIPPE |
09/04/2008 |
|
|
AUDITOR |
APPOINTMENT DATE |
||
|
ERNST YOUNG SL |
16/02/2006 |
||
Functional Managers
|
POSITION |
SURNAMES AND
NAME |
|
Financial Manager |
PEINADO MORENO LUIS |
|
Commercial Manager |
DIAZ FERNANDEZ JOAQUIN |
|
Purchases Manager |
VILEZ ANTONIO |
|
Exports Manager |
GARCIA CEDILLO ANTONIO |
|
Quality Manager |
PALANCO PULIDO LUIS |
|
IT Manager |
KLETT PEDRO |
FINANCIAL LINKS
|
|
BUSINESS NAME |
CIF / COUNTRY |
% |
SOURCE |
DATA INF. |
|
|
HOLDING GONVARRI SOCIEDAD LIMITADA. |
ESPAÑA |
74,00 |
TRADE REG. |
31/12/2006 |
|
|
HOLDING GONVARRI NAVARRA S.L. |
ESPAÑA |
26,00 |
OWN SOURCES |
16/04/2008 |
|
|
BUSINESS NAME |
CIF / COUNTRY |
% |
SOURCE |
DATA INF. |
|
|
COMPANHIA DE SERV SIDERURGICOS |
PORTUGAL |
100,00 |
OWN SOURCES |
18/07/2005 |
|
|
GONVARRI I CENTRO DE SERVICIOS S.L. |
ESPAÑA |
99,00 |
TRADE REG. |
31/12/2006 |
|
|
GONVARRI
CORPORACION FINANCIERA SL. |
ESPAÑA |
92,08 |
TRADE REG. |
31/12/2006 |
|
|
HIERROS Y APLANACIONES SA |
ESPAÑA |
66,50 |
OWN SOURCES |
17/01/2008 |
|
|
EMILSIDER S.P.A. |
ITALY |
63,37 |
OWN SOURCES |
18/07/2005 |
|
|
GONVARRI ITALIA SPA |
ITALY |
30,00 |
OWN SOURCES |
18/07/2005 |
You can obtain business information of a foreign company at the
pageD&B International
CREDIT INFORMATION
Constitution Date: 03/09/1958
Business activity 
Activity: Wholesale of minerals
NACE Code: 5152
NACE Activity: Wholesale of metals and metal ores
Business: FABRICACION, TRANSFORMACION Y COMERCIALIZACION DE
PRODUCTOS SIDERURGICOS
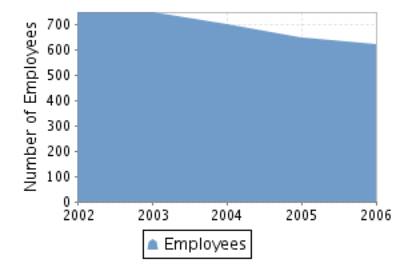
Employees 
Number of total employees: 627 (2006)
Number of fixed employees: 92,12%
Number of temporary employees: 7,88%
Employees evolution
COMMERCIAL OPERATIONS 
SUPPLIERS
|
BUSINESS NAME |
INTERNATIONAL |
|
GONVAUTO NAVARRA
SA |
NO |
|
GRUPO GESTAMP |
NO |
|
GRUPO SOLLAC |
NO |
|
GONVARRI
PRODUCTOS SIDERURGICOS SA |
NO |
|
INDUSTRIAL FERRO
DISTRIBUIDORA SA |
NO |
|
HIERROS Y
APLANACIONES SA |
NO |
|
COSIDER |
NO |
|
HOLDING GONVARRI
SL |
NO |
|
GONVARRI VIZCAYA
SL |
NO |
|
GONVARRI
TARRAGONA SL |
NO |
17 proveedores
CLIENTS
|
BUSINESS NAME |
INTERNATIONAL |
|
INDUSTRIAL FERRO
DISTRIBUIDORA SA |
NO |
|
GONVARRI ITALIA
SPA |
NO |
|
GONVARRI GALICIA
SA |
NO |
|
GRUPO ARCELOR |
NO |
|
EMILSIDER |
NO |
|
GONVARRI BRASIL
PRODUCTOS SIDERURGICOS SA |
YES |
|
HIERROS
VILLAVERDE SA |
NO |
|
GONVARRI BRASIL
SA |
YES |
|
GONVAUTO SA |
NO |
|
GONVAUTO
THÜRINGEN GMBH |
NO |
23 clientes
Banks 
|
ENTITY |
BRANCH |
ADDRESS |
TOWN OR CITY |
PROVINCE |
|
BANCO BILBAO
VIZCAYA ARGENTARIA, S.A. |
|
|
|
|
|
CAJA DE AHORROS
MUNICIPAL DE BURGOS |
|
|
|
|
|
BANCO POPULAR
ESPAÑOL, S.A. |
0039 |
MARIANO LUIÑA, 1 |
ELCHE / ELX |
Alicante |
|
BANKINTER, S.A. |
0010 |
PASEO DE LA CASTELLANA, 29 |
MADRID |
Madrid |
|
BANCO DE SABADELL, S.A. |
0085 |
AV GRAN VIA 000006 |
MADRID |
Madrid |
10 bank entities registered
Brands, Signs and Commercial
Names 
FORMER NAMES:
•
GONVARRI INDUSTRIAL SA
•
GONVARRI INDUSTRIAL SL
Brand name: GONVARRI (Valid)
Type: DENOMINATIVE Date: 17/09/1999
Name: GONVARRI INDUSTRIAL, S.A. ( GONINSA ) (Valid)
Type: DENOMINATIVE Date: 10/05/1991
LEGAL STRUCTURE
Constitution Data
Register Date: 03/09/1958
Current Legal Form: LIMITED LIABILITY
COMPANY
Current Capital:
29.886.000,00 €
Legal Aspects
Obligation to fill in Financial Statements: YES
Chamber census: YES (2006)
Listed on a Stock Exchange: NO
B.O.R.M.E.(Official Companies
Registry Gazette) 
Registered Proceedings
|
PROCEEDINGS |
DATE |
NOTICE NUM. |
TRADE REG. |
|
Resignations |
09/04/2008 |
186788 |
Madrid |
|
Appointments |
09/04/2008 |
186788 |
Madrid |
|
Resignations |
20/02/2008 |
93163 |
Madrid |
|
Change of legal form |
17/01/2008 |
24247 |
Madrid |
Other Proceedings published
|
PROCEEDINGS |
DATE |
NOTICE NUM. |
TRADE REG. |
|
Fusion by absorption project |
16/06/2008 |
170566 |
Madrid |
Press articles

16/06/2008 GACETA NEG (INFORMATION ON LEGAL ANNOUNCE)
LAS JUNTAS GRALES. DE LAS SDADES. GONVARRI INDUSTRIAL SL (SDAD.
ABSORBENTE) Y GONVARRI CORPORACION FINANCIERA SL (SDAD. ABSORBIDA), CELEBRADAS
EL DIA 10/06/08, APROBARON LA FUSION DE AMBAS CIAS.
17/11/2007 EXPANSIÓN (GENERAL INFORMATION)
EL GRUPO GONVARRI HA DECIDIDO DESPRENDERSE DE SU ACTIVIDAD INDUSTRIAL EN
ITALIA PARA CENTRAR SU EXPANSION INTERNACIONAL EN AMERICA Y EL ESTE DE EUROPA.
LA EMPRESA, QUE EN 2007 HA PUESTO EN MARCHA UNA PLANTA EN ALEMANIA, PRETENDE
CENTRAR SU CRECIMIENTO EXTERIOR EN BRASIL, MEXICO, POLONIA Y ESLOVAQUIA. EL
GRUPO HA VENDIDO LA RAMA DE ACTIVIDAD INDUSTRIAL DE SU FILIAL GONVARRI ITALIA A
LA SIDERURGICA ITALIANA COILS LAMIERE NASTRI (CLN). GONVARRI PODRIA MANTENER LA
PERSONALIDAD JURIDICA DE SU FILIAL EN ITALIA PARA DEDICARLA, A PARTIR DE AHORA,
A LA ACTIVIDAD INMOBILIARIA. LA FILIAL ITALIANA, CON UN VALOR CONTABLE DE 21
MM., FACTURO 90 MM. EN 2006 Y GANO 624.000 EUROS
Complementary Information
Por causas ajenas a nuestra voluntad el
deposito de cuentas del
ejercicio 2003, se ha recibido erroneamente, teniendo disponible el
deposito consolidado.
FINANCIAL INFORMATION
The information on the last account contained in this report is
extracted from the Mercantile Register file of the legal address of the Company
and dated 10/12/2007.
BALANCE SHEET
Assets
Figures given in thousands €
|
|
31/12/2004 (12) |
31/12/2005 (12) |
31/12/2006 (12) |
|
A) DUE FROM SHAREHOLDERS FOR UNCALLED CAPITAL |
|
|
|
|
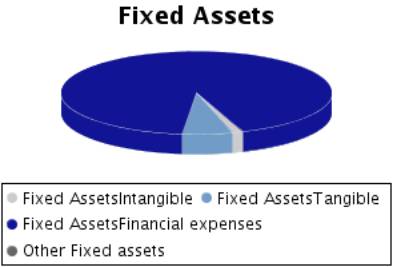
B) FIXED ASSETS |
182.587,00 |
249.613,00 |
265.450,00 |
|
I. Incorporation costs |
|
|
|
|
II. Intangible fixed assets |
4.293,00 |
1.456,00 |
3.278,00 |
|
R & D expenses |
|
|
2.609,00 |
|
Concessions,
patents, licences , trademarks |
1,00 |
1,00 |
|
|
Goodwill |
|
|
|
|
Acquired rights from finance leases |
|
|
|
|
Software |
9.198,00 |
7.023,00 |
7.061,00 |
|
Leasing |
5.250,00 |
|
1,00 |
|
Cash advance |
599,00 |
|
|
|
Provisions |
|
|
|
|
Depreciation |
-10.755,00 |
-5.568,00 |
-6.393,00 |
|
III. Tangible fixed assets |
18.507,00 |
17.801,00 |
15.889,00 |
|
Property, plant and equipment |
10.385,00 |
14.979,00 |
15.619,00 |
|
Machinery, equipment and other |
41.985,00 |
42.383,00 |
42.589,00 |
|
Other property plant and equipment |
23.760,00 |
24.029,00 |
23.999,00 |
|
Prepaid expenses on fixed assets |
46,00 |
475,00 |
71,00 |
|
Other assets |
5.882,00 |
4.824,00 |
4.725,00 |
|
Provisions |
|
|
|
|
Depreciation |
-63.551,00 |
-68.889,00 |
-71.114,00 |
|
IV. Financial fixed assets |
159.787,00 |
230.356,00 |
246.283,00 |
|
Shares in affiliated companies |
38.256,00 |
38.241,00 |
38.245,00 |
|
Receivables in affiliated companies |
120.832,00 |
191.467,00 |
207.850,00 |
|
Shares in associated companies |
|
|
|
|
Loans to associated companies |
|
|
|
|
Securities |
|
|
|
|
Other loans |
674,00 |
608,00 |
150,00 |
|
Long term deposits and guarantees |
40,00 |
40,00 |
38,00 |
|
Provisions |
-15,00 |
|
|
|
Taxes receivable |
|
|
|
|
V.Owners equity |
|
|
|
|
VI.Long term trade liabilities |
|
|
|
|
C) DEFERRED EXPENSES |
7,00 |
|
|
|
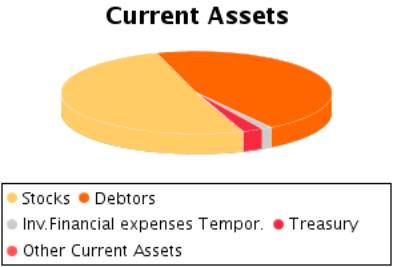
D) CURRENT ASSETS |
449.973,00 |
340.249,00 |
381.118,00 |
|
I. Shareholders by required outlays |
|
|
|
|
II. Stocks |
189.550,00 |
170.437,00 |
193.632,00 |
|
Goods available for sale |
208.231,00 |
|
|
|
Raw material inventory |
2.817,00 |
153.333,00 |
157.581,00 |
|
Work in Progress |
|
36.607,00 |
47.557,00 |
|
Finished goods |
|
|
|
|
Subproducts and recycled materials |
|
|
|
|
Cash advance |
49,00 |
5,00 |
|
|
Provisions |
-21.547,00 |
-19.508,00 |
-11.506,00 |
|
III. Debtors |
153.462,00 |
154.090,00 |
173.022,00 |
|
Clients |
87.156,00 |
79.229,00 |
91.922,00 |
|
Amounts owned by affiliated companies |
77.879,00 |
75.545,00 |
20.386,00 |
|
Amounts owned by associated companies |
|
|
61.087,00 |
|
Other debts |
1.257,00 |
552,00 |
331,00 |
|
Staff Expenses |
249,00 |
209,00 |
341,00 |
|
Government |
2.234,00 |
5.981,00 |
6.218,00 |
|
Provisions |
-15.313,00 |
-7.426,00 |
-7.263,00 |
|
IV. Temporary financial investment |
102.345,00 |
11.639,00 |
4.937,00 |
|
Shares in affiliated companies |
|
|
|
|
Receivables in affiliated companies |
102.044,00 |
11.638,00 |
3.444,00 |
|
Shares in associated companies |
|
|
1.403,00 |
|
Loans to associated companies |
|
|
|
|
Short term investment |
89,00 |
|
|
|
Other loans |
360,00 |
114,00 |
90,00 |
|
Short Term Deposit and guarantees |
|
|
|
|
Provisions |
-148,00 |
-113,00 |
|
|
V. Short-term own shares |
|
|
|
|
VI. Treasury |
4.505,00 |
4.083,00 |
9.526,00 |
|
VII. Periodification adjustments |
111,00 |
|
1,00 |
|
ASSETS (A + B + C + D) |
632.567,00 |
589.862,00 |
646.568,00 |
Assets composition
Liabilities
Figures given in thousands €
|
|
31/12/2004 (12) |
31/12/2005 (12) |
31/12/2006 (12) |
|
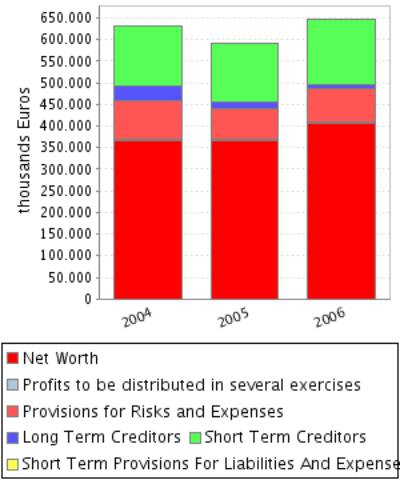
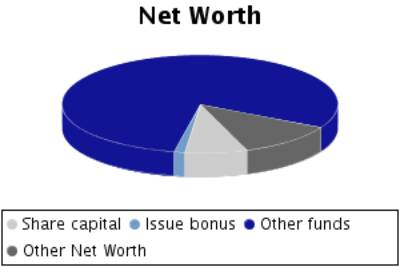
A) SHAREHOLDERS EQUITY |
366.110,00 |
365.060,00 |
406.073,00 |
|
I. Share capital |
29.886,00 |
29.886,00 |
29.886,00 |
|
II. Issue bonus |
5.040,00 |
5.040,00 |
5.040,00 |
|
III.Revaluation reserve |
5.727,00 |
5.727,00 |
5.727,00 |
|
IV.Reserves |
282.829,00 |
297.246,00 |
324.407,00 |
|
Retained earnings |
6.641,00 |
6.641,00 |
6.641,00 |
|
Sinking fund from owner equity |
|
|
|
|
Reserve for the parent company capital |
|
|
|
|
Statutory reserve |
|
|
|
|
Other funds |
276.188,00 |
290.605,00 |
317.766,00 |
|
Capital adjustments in Euros |
|
|
|
|
V.Results from previous years |
|
|
|
|
Carry Over |
|
|
|
|
Prior years losses |
|
|
|
|
Loans from
partners for losses compensation |
|
|
|
|
VI.Profit and Losses |
42.628,00 |
53.661,00 |
51.013,00 |
|
VII.Dividend paid during the year |
|
-26.500,00 |
-10.000,00 |
|
VIII.Own shares for capital reduction |
|
|
|
|
B) DEFERRED INCOME |
3.849,00 |
2.907,00 |
3.427,00 |
|
Capital grants |
830,00 |
635,00 |
1.846,00 |
|
Positive change difference |
|
|
3,00 |
|
Other deferred income |
3.019,00 |
2.272,00 |
1.578,00 |
|
Fiscal deferred income |
|
|
|
|
C) PROVISIONS FOR LIABILITIES AND EXPENSES |
90.086,00 |
72.167,00 |
76.783,00 |
|
Provision for pensions plans |
|
|
|
|
Provision for taxes |
34.980,00 |
36.189,00 |
75.562,00 |
|
Other provisions |
55.106,00 |
35.978,00 |
1.221,00 |
|
Reversion fund |
|
|
|
|
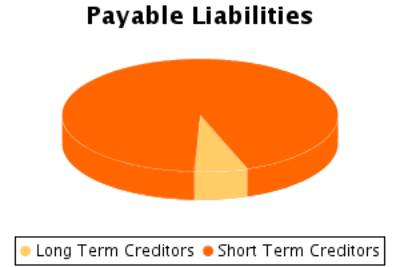
D) LONG TERM LIABILITIES |
33.113,00 |
15.833,00 |
9.904,00 |
|
I.Negotiable
bonds and other negotiable values |
|
|
|
|
Non convertible securities |
|
|
|
|
Convertible securities |
|
|
|
|
Other convertible debentures |
|
|
|
|
II.Debt with bank entities |
21.624,00 |
14.416,00 |
8.419,00 |
|
Long term bank loans |
21.624,00 |
14.416,00 |
8.419,00 |
|
Leasing |
|
|
|
|
III.Debts with associated and affiliated
companies |
11.390,00 |
1.231,00 |
1.231,00 |
|
With affiliated companies |
1.231,00 |
1.231,00 |
1.231,00 |
|
Associated companies |
10.159,00 |
|
|
|
IV. Other creditors |
99,00 |
186,00 |
254,00 |
|
Bills payable |
|
|
|
|
Other debts |
|
|
|
|
Long term deposit and guaranties |
|
87,00 |
87,00 |
|
Taxes receivable |
99,00 |
99,00 |
167,00 |
|
V. Deferred debts on shares |
|
|
|
|
From affiliated companies |
|
|
|
|
From associated companies |
|
|
|
|
Other companies |
|
|
|
|
VI. Long term debt with creditor |
|
|
|
|
E) SHORT TERM LIABILITIES |
139.365,00 |
133.895,00 |
150.381,00 |
|
I.Negotiable
bonds and other negotiable values |
|
|
|
|
Non convertible securities |
|
|
|
|
Convertible securities |
|
|
|
|
Other convertible debentures |
|
|
|
|
Interests from bonds |
|
|
|
|
II.Debt with bank entities |
43.466,00 |
56.473,00 |
52.822,00 |
|
Loans and other debts |
42.739,00 |
56.406,00 |
52.747,00 |
|
Debt interest |
89,00 |
67,00 |
75,00 |
|
Leasing |
638,00 |
|
|
|
III. Short term debts with associated and
affiliated companies |
45.752,00 |
53.474,00 |
65.535,00 |
|
With affiliated companies |
16.322,00 |
20.760,00 |
37.737,00 |
|
Associated companies |
29.430,00 |
32.714,00 |
27.798,00 |
|
IV. Commercial creditors |
46.949,00 |
20.947,00 |
29.159,00 |
|
Accounts payable |
|
|
|
|
Expenses |
46.949,00 |
20.947,00 |
29.159,00 |
|
Bills payable |
|
|
|
|
V. Other non-commercial debt |
3.198,00 |
2.963,00 |
2.839,00 |
|
Government |
1.547,00 |
1.423,00 |
1.336,00 |
|
Bills payable |
|
|
|
|
Other debts |
385,00 |
200,00 |
227,00 |
|
Accounts receivable |
1.266,00 |
1.340,00 |
1.276,00 |
|
Short term deposits and guarantees |
|
|
|
|
VI. Provisions for current assets |
|
38,00 |
|
|
VII. Periodification adjustments |
|
|
26,00 |
|
F) SHORT TERM PROVISIONS FOR LIABILITIES AND
EXPENSES |
44,00 |
|
|
|
LIABILITIES (A + B + C + D + E + F) |
632.567,00 |
589.862,00 |
646.568,00 |
Liabilities
Composition
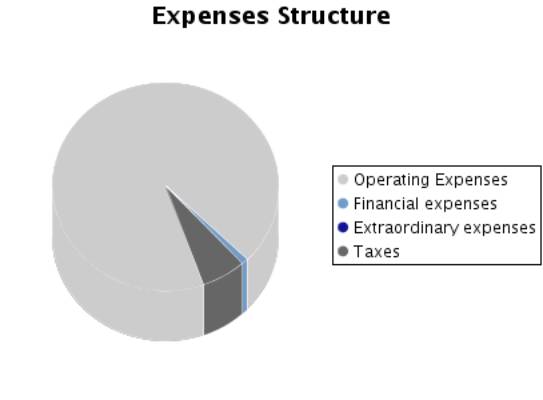
PROFIT AND LOSS ACCOUNT
Itams of the Profit
and Loss Account
Figures given in thousands €
|
|
31/12/2004 (12) |
31/12/2005 (12) |
31/12/2006 (12) |
|
A) EXPENSES (A.1 a A.16) |
557.708,00 |
528.987,00 |
588.922,00 |
|
A.1.Reduction in stocks of finished goods and
work in progress |
|
|
|
|
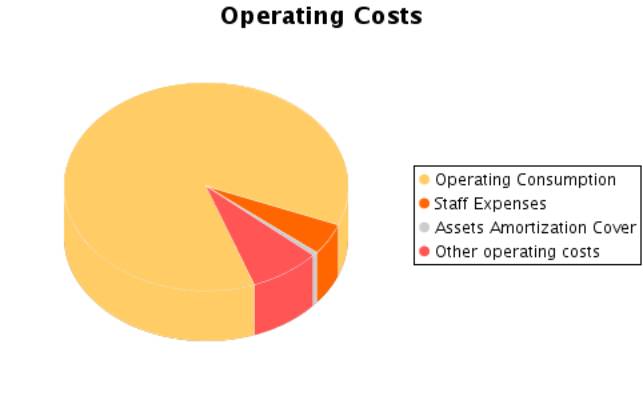
A.2.Supplies |
413.915,00 |
446.685,00 |
482.204,00 |
|
Material consumed |
409.733,00 |
444.154,00 |
478.277,00 |
|
Raw materials consumed |
|
|
|
|
Other expenses |
4.182,00 |
2.531,00 |
3.927,00 |
|
A.3. Labour cost |
26.887,00 |
25.207,00 |
25.947,00 |
|
Wages |
20.160,00 |
18.777,00 |
19.330,00 |
|
Social security expenses |
6.727,00 |
6.430,00 |
6.617,00 |
|
A.4. Assets depreciation |
5.661,00 |
3.828,00 |
3.399,00 |
|
A.5.Variance in the traffic provisions |
22.080,00 |
-8.419,00 |
-7.811,00 |
|
Variance in provision for inventory |
12.133,00 |
-2.040,00 |
-7.610,00 |
|
Variance in provision for bad debts |
2.440,00 |
-6.374,00 |
-163,00 |
|
Variance in provision for other current assets |
7.507,00 |
-5,00 |
-38,00 |
|
A.6. Other operating costs |
46.399,00 |
43.730,00 |
43.387,00 |
|
External costs |
45.800,00 |
43.162,00 |
42.766,00 |
|
Taxes |
599,00 |
568,00 |
621,00 |
|
Other day to day expenses |
|
|
|
|
Allowance to reversion fund |
|
|
|
|
A.I.OPERATING RESULT
(B.1+B.2+B.3+B.4-A.1-A.2-A.3-A.4-A.5-A.6) |
56.680,00 |
59.539,00 |
78.876,00 |
|
A.7.Financial expenses and similar |
3.477,00 |
3.857,00 |
3.860,00 |
|
Debts with related companies |
929,00 |
476,00 |
600,00 |
|
Debts with associated companies |
2.548,00 |
|
743,00 |
|
Other companies debts By debts with third parties and similar expenses |
|
3.381,00 |
2.517,00 |
|
Losses from financial investments |
|
|
|
|
A.8. Variation in financial investment provision |
-2,00 |
|
|
|
A.9.Negative exchange difference |
1.620,00 |
145,00 |
1.161,00 |
|
A.II.POSITIVE FINANCIAL RESULTS
(B.5+B.6+B.7+B.8-A.7-A.8-A.9) |
1.349,00 |
3.446,00 |
5.285,00 |
|
A.III.PROFIT FROM ORDINARY ACTIVITIES
(A.I+A.II-B.I-B.II) |
58.029,00 |
62.985,00 |
84.161,00 |
|
A.10. Variation in provision in fixed assets |
-1.056,00 |
|
|
|
A.11. Losses in fixed assets |
1,00 |
3,00 |
13,00 |
|
A.12. Losses from own shares and bonds |
|
265,00 |
5,00 |
|
A.13. Extraordinary charges |
21.803,00 |
|
|
|
A.14.Other
exercises’ expenses and losses |
73,00 |
881,00 |
149,00 |
|
A.IV.POSITIVE
EXTRAORDINARY RESULT (B.9+B.10+B.11+B.12+B.13-A.10-A.11-A.12-A.13-A.14) |
1.449,00 |
3.481,00 |
3.460,00 |
|
A.V.PROFIT BEFORE TAXES (A.III+A.IV-B.III-B.IV) |
59.478,00 |
66.466,00 |
87.621,00 |
|
A.15.Corporate Taxes |
16.850,00 |
12.805,00 |
36.608,00 |
|
A.16. Other taxes |
|
|
|
|
A.VI.EXERCISE RESULT (PROFIT) (A.V-A.14-A.15) |
42.628,00 |
53.661,00 |
51.013,00 |
|
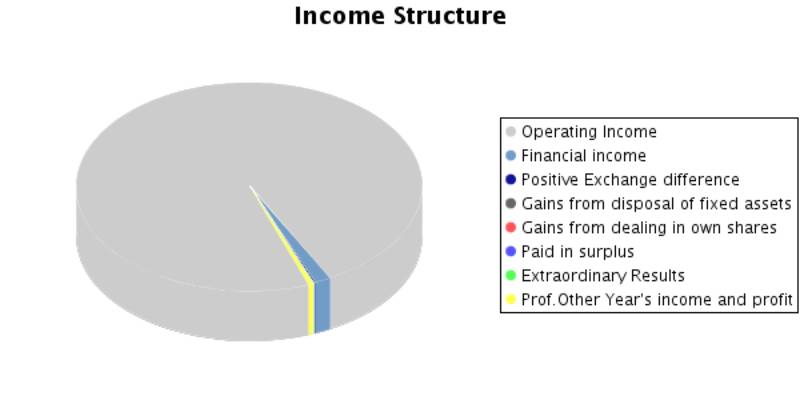
B) INCOMES (B.1 a B13) |
600.336,00 |
582.648,00 |
639.935,00 |
|
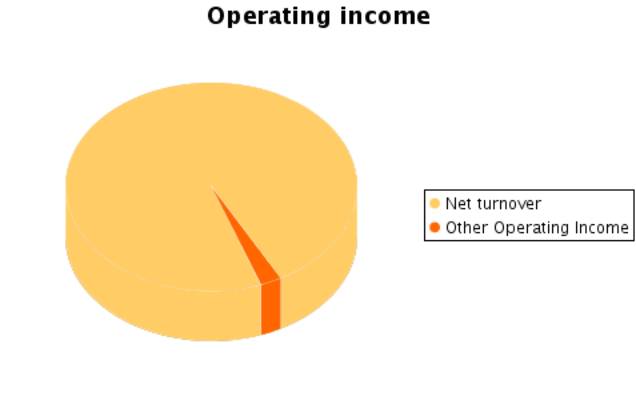
B.1. Turnover |
563.018,00 |
541.227,00 |
600.777,00 |
|
Sales |
563.380,00 |
541.559,00 |
601.594,00 |
|
Services provided |
2.300,00 |
2.286,00 |
4.548,00 |
|
Refunds and sale reminders |
-2.662,00 |
-2.618,00 |
-5.365,00 |
|
B.2.Increase in inventory of finished goods and
works in progress |
|
2.765,00 |
10.950,00 |
|
B.3.Expenses capitalized |
|
|
1.700,00 |
|
B.4. Other operating income |
8.604,00 |
26.578,00 |
12.575,00 |
|
Other incomes |
8.464,00 |
6.734,00 |
8.190,00 |
|
Grants |
8,00 |
24,00 |
67,00 |
|
Excess in provision for liabilities and charges |
132,00 |
19.820,00 |
4.318,00 |
|
B.I.OPERATING LOSSES
(A.1+A.2+A.3+A.4+A.5+A.6-B.1-B.2-B.3-B.4) |
|
|
|
|
B.5.Incomes from share participations |
3,00 |
2,00 |
|
|
From affiliated companies |
|
|
|
|
From associated companies |
|
|
|
|
From other companies |
3,00 |
2,00 |
|
|
B.6.Income from other securities and credits to
fixed assets |
833,00 |
424,00 |
229,00 |
|
From affiliated companies |
782,00 |
395,00 |
203,00 |
|
From associated companies |
|
|
26,00 |
|
Other companies |
51,00 |
29,00 |
|
|
B.7.Other interests and similar |
4.306,00 |
5.982,00 |
9.341,00 |
|
From affiliated companies |
2.107,00 |
4.076,00 |
7.686,00 |
|
From associated companies |
1.243,00 |
1.167,00 |
1.023,00 |
|
Other Interests |
880,00 |
732,00 |
632,00 |
|
Profits from investments |
76,00 |
7,00 |
|
|
B.8. Positive change difference |
1.302,00 |
1.040,00 |
736,00 |
|
B.II. NEGATIVE FINANCIAL RESULTS
(A.7+A.8+A.9-B.5-B.6-B.7-B.8) |
|
|
|
|
B.III.LOSSES FROM ORDINARY ACTIVITIES (B.I+B.II-A.I-A.II) |
|
|
|
|
B.9.B.9. Gains from disposal of fixed assets |
19.195,00 |
21,00 |
25,00 |
|
B.10.Gains from dealing in own shares |
|
|
|
|
B.11. Paid in surplus |
252,00 |
195,00 |
167,00 |
|
B.12. Extraordinary income |
1.477,00 |
2.691,00 |
435,00 |
|
B.13.Other year’s income and profits |
1.346,00 |
1.723,00 |
3.000,00 |
|
B.IV.NEGATIVE EXTRAORDINARY LOSSES
(A.10+A.11+A.12+A.13+A.14-B.9-B.10-B.11-B.12-B.13) |
|
|
|
|
B.V.LOSS BEFORE TAXES (B.III+B.IV-A.III-A.IV) |
|
|
|
|
B.VI.EXERCISE RESULTS (LOSS) (B.V+A.14+A.15) |
|
|
|
Composition of the
Profit and Loss Account
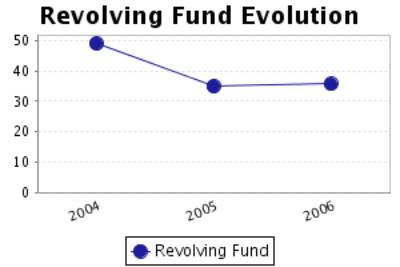
FINANCIAL BALANCE
Here the Main Capital Amounts of the company and the Revolving Fund
Evolution are analysed.
Financial Balance
Table
Figures given in thousands €
|
|
31/12/2004 (12) |
% |
31/12/2005 (12) |
% |
31/12/2006 (12) |
% |
|
A) DUE FROM
SHAREHOLDERS FOR UNCALLED CAPITAL |
|
|
|
|
|
|
|
B) FIXED ASSETS |
182.587,00 |
28,86 |
249.613,00 |
42,32 |
265.450,00 |
41,06 |
|
C) DEFERRED EXPENSES |
7,00 |
0,00 |
|
|
|
|
|
D) CURRENT
ASSETS |
449.973,00 |
71,13 |
340.249,00 |
57,68 |
381.118,00 |
58,94 |
|
ASSETS (A + B + C + D) |
632.567,00 |
|
589.862,00 |
|
646.568,00 |
|
|
|
||||||
|
A) SHAREHOLDERS
EQUITY |
366.110,00 |
57,88 |
365.060,00 |
61,89 |
406.073,00 |
62,80 |
|
B) DEFERRED INCOME |
3.849,00 |
0,61 |
2.907,00 |
0,49 |
3.427,00 |
0,53 |
|
C) PROVISIONS
FOR LIABILITIES AND EXPENSES |
90.086,00 |
14,24 |
72.167,00 |
12,23 |
76.783,00 |
11,88 |
|
D) LONG TERM
LIABILITIES |
33.113,00 |
5,23 |
15.833,00 |
2,68 |
9.904,00 |
1,53 |
|
E) SHORT TERM LIABILITIES |
139.365,00 |
22,03 |
133.895,00 |
22,70 |
150.381,00 |
23,26 |
|
F) SHORT TERM PROVISIONS FOR LIABILITIES AND EXPENSES |
44,00 |
0,01 |
|
|
|
|
|
LIABILITIES (A + B + C + D + E + F) |
632.567,00 |
|
589.862,00 |
|
646.568,00 |
|
Financial Balance
Composition
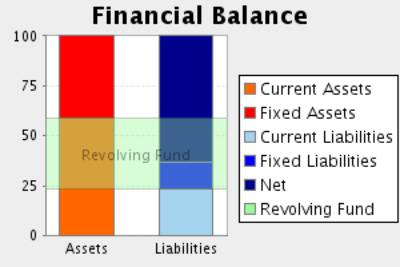
Comments on Financial
Balance
In the 2004, the assets of the company were formed in 28,87% of Fixed
Assets and in 71,13% of Current Assets.This assets were financed in 58,49% with
own capitals, and in 19,48% with long term debt and in 22,04% with current
liabilities.
The result of this financial structure is a positive turnover fund of
310.564,00 Euros, which is equivalent to 49,10% proportion of the
company’s total assets.
In the 2005, the assets of the company were formed in 42,32% of Fixed
Assets and in 57,68% of Current Assets.This assets were financed in 62,38% with
own capitals, and in 14,92% with long term debt and in 22,70% with current
liabilities.
The result of this financial structure is a positive turnover fund of
206.354,00 Euros, which is equivalent to 34,98% proportion of the
company’s total assets.
This measure has diminished with respect to the previous exercise in
33,56% having also diminished its proportion with respect to the total assets
of the company.
In the 2006, the assets of the company were formed in 41,06% of Fixed
Assets and in 58,94% of Current Assets.This assets were financed in 63,33% with
own capitals, and in 13,41% with long term debt and in 23,26% with current
liabilities.
The result of this financial structure is a positive turnover fund of
230.737,00 Euros, which is equivalent to 35,69% proportion of the
company’s total assets.
This measure has increased with respect to the previous exercise in
11,82% having also increased its proportion with respect to the total assets of
the company.
RATIOS
Main Ratios
|
|
31/12/2004 (12) |
31/12/2005 (12) |
31/12/2006 (12) |
|
STRUCTURAL RATIOS |
|
|
|
|
Management fund |
310.564,00 |
206.354,00 |
230.737,00 |
|
Management Fund Requirement |
247.180,00 |
247.105,00 |
269.096,00 |
|
Indebtedness (%) |
41,52 |
37,62 |
36,67 |
|
External Funds on Net Worth |
0,71 |
0,60 |
0,58 |
|
GENERAL ACTIVITY RATIO |
|
|
|
|
Turnover Increase (%) |
14,87 |
-3,87 |
11,00 |
|
Added value growth (%) |
42,16 |
-27,99 |
25,27 |
|
Cash Flow |
69.311,00 |
49.070,00 |
46.601,00 |
|
Labour Productivity |
4,14 |
3,18 |
3,87 |
|
Assets turnover |
0,89 |
0,92 |
0,93 |
|
Breakdown Point |
366.180,68 |
294.918,52 |
277.684,02 |
|
Security Margin of the Breakdown Point (%) |
35,94 |
48,06 |
54,85 |
|
ACTIVITY RATIOS |
|
|
|
|
Average Payment Period |
41 |
17 |
22 |
|
Average Collection Period |
98 |
102 |
104 |
|
Inventory Turnover Period |
121 |
113 |
116 |
|
SOLVENCY RATIOS |
|
|
|
|
Payback Capacity |
0,26 |
0,22 |
0,20 |
|
Assets Guarantee |
2,41 |
2,66 |
2,73 |
|
Short Term Debts Proportion (%) |
53,09 |
60,34 |
63,43 |
|
Interest Coverage |
11,98 |
8,87 |
5,63 |
|
LIQUIDITY RATIOS |
|
|
|
|
Current Ratio |
3,23 |
2,54 |
2,53 |
|
Immediate liquidity |
0,77 |
0,12 |
0,10 |
|
Treasury |
63.384,00 |
-40.751,00 |
-38.359,00 |
|
Sales on Current Assets |
450 |
573 |
567 |
Results Analysis
Ratios
|
|
31/12/2004 (12) |
31/12/2005 (12) |
31/12/2006 (12) |
|
Economic profitability (%) |
8,96 |
10,09 |
12,20 |
|
Operating Profitability (%) |
10,07 |
11,00 |
13,13 |
|
Equity gearing |
1,75 |
1,70 |
1,68 |
|
Financial profitability (%) |
11,52 |
14,58 |
12,46 |
|
General Profitability (%) |
7,57 |
9,92 |
8,49 |
Comments on the
Results Analysis Ratios
The economic profitability in the year2005 achieved a 10,09% positive
level, due to a 11,00% economic margin and to an assets turnover of0,92%.
The economic profitability in the year has increased from 8,96% up to
10,09%. This growth is due to the economic margin increase, from 10,07% to the
current 11,00Y%, and to the assets turnover index, which in the last period has
achieved 0,92, compared to 0,89 del 2004.
Financial profitability on 2005 achieved a 14,58%.
The company’s financial structure has instigated its economic
profitability with an indebtedness level of 1,70.
The general profitability on 2005 achieved a 9,92%.
The economic profitability in the year2006 achieved a 12,20% positive
level, due to a 13,13% economic margin and to an assets turnover of0,93%.
The economic profitability in the year has increased from 10,09% up to
12,20%. This growth is due to the economic margin increase, from 11,00% to the
current 13,13Y%, and to the assets turnover index, which in the last period has
achieved 0,93, compared to 0,92 del 2005.
Financial profitability on 2006 achieved a 12,46%.
The company’s financial structure has instigated its economic
profitability with an indebtedness level of 1,68.
The general profitability on 2006 achieved a 8,49%.
SECTORIAL ANÁLYSIS
Large Capital Amounts
and Financial Balance
Figures given in %
|
|
COMPANY (2006) |
SECTOR |
DIFFERENCE |
DIFFERENCE RELATIVE |
|
|
|
|
|
|
ASSETS |
|
|
|
|
|
|
|
|
|
|
A) DUE FROM
SHAREHOLDERS FOR UNCALLED CAPITAL |
|
0,00 |
|
|
|
|
|
|
|
|
B) FIXED ASSETS |
41,06 |
39,26 |
1,80 |
4,59 |
|
|
|
|
|
|
C) DEFERRED
EXPENSES |
|
0,83 |
|
|
|
|
|
|
|
|
D) CURRENT ASSETS |
58,94 |
59,91 |
-0,97 |
-1,62 |
|
|
|
|
|
|
ASSETS (A + B + C + D) |
100 |
100 |
|
|
|
|
|
|
|
|
|
|
|
|
|
|
|
|
|
|
|
|
COMPANY (2006) |
SECTOR |
DIFFERENCE |
DIFFERENCE RELATIVE |
|
|
|
|
|
|
LIABILITIES |
|
|
|
|
|
|
|
|
|
|
A) SHAREHOLDERS
EQUITY |
62,80 |
40,02 |
22,78 |
56,91 |
|
|
|
|
|
|
B) DEFERRED INCOME |
0,53 |
0,25 |
0,28 |
110,32 |
|
|
|
|
|
|
C) PROVISIONS
FOR LIABILITIES AND EXPENSES |
11,88 |
1,91 |
9,97 |
522,64 |
|
|
|
|
|
|
D) LONG TERM
LIABILITIES |
1,53 |
8,00 |
-6,47 |
-80,87 |
|
|
|
|
|
|
E) SHORT TERM
LIABILITIES |
23,26 |
49,62 |
-26,36 |
-53,12 |
|
|
|
|
|
|
F) SHORT TERM
PROVISIONS FOR LIABILITIES AND EXPENSES |
|
0,20 |
|
|
|
|
|
|
|
|
LIABILITIES (A + B + C + D + E + F) |
100 |
100 |
|
|
|
|
|
|
|
Financial Balance
Composition
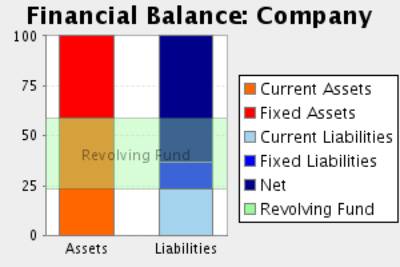
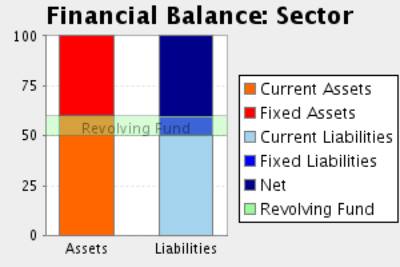
Comments to the
Sectorial Analysis
In the 2006, the assets of the company were formed in 41,06% of fixed
assets and in 58,94Current Assets % In the sector, the proportion of fixed
assets was of 40,09%, 2,42% inferior, and the proportion of current assets was
of 59,91%, 1,62% superior.
The assets were financed in the company in 63,33% with own capitals , in
13,41% with fixed liabilities and in 23,26% with current liabilities In the
sector, the self financing represented 40,28%, 57,24% inferior. On the other
hand the long term debts represented in the sector an average of 9,90%
financing, with a relative difference of 35,40% in favour of the companyAnd,
short term liabilities represented in the sector an average of 49,82%
financing, with a relative difference of 53,31% favourable to the sector
The result of this company’s financial structure is a turnover fund that
represents 35,69% of the total assets; in the sector, this same proportion is
10,09%, therefore, we can say that the company’s turnover fund is 253,75%
higher than the one in of the sector.
Analytical Account of
Results
Figures given in %
|
|
COMPANY (2006) |
SECTOR |
DIFFERENCE |
DIFFERENCE RELATIVE |
|
Turnover |
97,68 |
99,44 |
-1,76 |
-1,77 |
|
Other operating income |
2,32 |
0,56 |
1,76 |
315,03 |
|
Production Value |
100,00 |
100,00 |
0,00 |
0,00 |
|
Operating expenses |
76,62 |
87,52 |
-10,90 |
-12,45 |
|
Other operation expenses |
7,05 |
7,10 |
-0,05 |
-0,65 |
|
Added value |
16,33 |
5,38 |
10,94 |
203,25 |
|
Labour cost |
4,22 |
2,37 |
1,85 |
77,91 |
|
Gross Economic Result |
12,11 |
3,01 |
9,10 |
301,92 |
|
Assets depreciation |
0,55 |
0,82 |
-0,27 |
-33,01 |
|
Variation in provision for current assets and bad debt losses |
-1,27 |
0,05 |
-1,32 |
-2.542,31 |
|
Net Economic Result |
12,82 |
2,14 |
10,68 |
499,07 |
|
Financial income |
1,68 |
0,79 |
0,89 |
111,59 |
|
Financial Charges |
0,82 |
0,48 |
0,34 |
69,42 |
|
Variation in financial investment provision |
|
0,00 |
|
|
|
Ordinary Activities Result |
13,68 |
2,45 |
11,23 |
458,82 |
|
Extraordinary income |
0,59 |
0,19 |
0,40 |
210,53 |
|
Extraordinary charges |
0,03 |
0,13 |
-0,10 |
-76,92 |
|
Variation in provision in fixed assets |
|
0,06 |
|
|
|
Results before Taxes |
14,25 |
2,45 |
11,80 |
481,87 |
|
Corporate taxes |
5,95 |
0,69 |
5,26 |
758,59 |
|
Net Result |
8,29 |
1,76 |
6,53 |
372,10 |
|
Assets depreciation |
0,55 |
0,82 |
-0,27 |
-33,01 |
|
Change of Provisions |
-1,27 |
0,11 |
-1,38 |
-1.223,89 |
|
Net Self-Financing |
7,58 |
2,69 |
4,89 |
181,78 |
Main Ratios
|
|
COMPANY (2006) |
PTILE25 |
PTILE50 |
PTILE75 |
|
STRUCTURAL RATIOS |
|
|
|
|
|
Management fund |
230.737,00 |
2.000,94 |
5.767,84 |
14.304,14 |
|
Management Fund
Requirement |
269.096,00 |
-9.292,82 |
-977,36 |
5.397,65 |
|
Indebtedness (%) |
36,67 |
54,88 |
66,33 |
77,50 |
|
External Funds on Net Worth |
0,58 |
1,22 |
1,97 |
3,44 |
|
GENERAL ACTIVITY
RATIO |
|
|
|
|
|
Turnover Increase (%) |
11,00 |
0,51 |
6,97 |
17,97 |
|
Added value growth (%) |
25,27 |
-17,11 |
-1,23 |
12,22 |
|
Cash Flow |
46.601,00 |
1.019,88 |
2.693,90 |
5.671,22 |
|
Labour Productivity |
3,87 |
1,48 |
2,02 |
3,20 |
|
Assets turnover |
0,93 |
1,49 |
1,90 |
2,92 |
|
Breakdown Point |
277.684,02 |
40.272.149,61 |
56.058.838,07 |
85.937.635,89 |
|
Security Margin
of the Breakdown Point (%) |
54,85 |
9,38 |
19,54 |
34,50 |
|
ACTIVITY RATIOS |
|
|
|
|
|
Average Payment
Period |
22 |
21 |
46 |
75 |
|
Average
Collection Period |
104 |
54 |
92 |
121 |
|
Inventory
Turnover Period |
116 |
15 |
31 |
51 |
|
SOLVENCY RATIOS |
|
|
|
|
|
Payback Capacity |
0,20 |
0,04 |
0,09 |
0,17 |
|
Assets Guarantee |
2,73 |
1,28 |
1,50 |
1,82 |
|
Short Term Debts
Proportion (%) |
63,43 |
84,33 |
96,45 |
99,64 |
|
Interest Coverage |
5,63 |
0,91 |
3,60 |
12,50 |
|
LIQUIDITY RATIOS |
|
|
|
|
|
Current Ratio |
2,53 |
1,08 |
1,24 |
1,63 |
|
Immediate liquidity |
0,10 |
0,02 |
0,07 |
0,26 |
|
Treasury |
-38.359,00 |
-7.995,37 |
-50,87 |
2.849,99 |
|
Sales on Current Assets |
567 |
713 |
877 |
1.404 |
Results Analysis
Ratios
|
|
COMPANY (2006) |
PTILE25 |
PTILE50 |
PTILE75 |
|
Economic profitability (%) |
12,20 |
2,45 |
5,22 |
10,75 |
|
Operating Profitability (%) |
13,13 |
1,03 |
2,81 |
5,90 |
|
Equity gearing |
1,68 |
1,81 |
2,81 |
4,04 |
|
Financial profitability (%) |
12,46 |
4,50 |
11,86 |
21,27 |
|
General Profitability (%) |
8,49 |
0,65 |
1,78 |
3,90 |
NOTES
In answer to your request of a Financial
Report on the above-mentioned company,
we inform you that the requested product cannot be processed as the necessary
accounts haven’t been published yet.
Last Accounts published in Borme are those from the exercise: 2006.
For any other question or suggestion, please contact our Department of customer
service:
Tel: 902 17 60 76
Fax: 91 661 90 60
FOREIGN EXCHANGE
RATES
|
Currency |
Unit
|
Indian Rupees |
|
US Dollar |
1 |
Rs.43.21 |
|
UK Pound |
1 |
Rs.85.72 |
|
Euro |
1 |
Rs.67.92 |
RATING
EXPLANATIONS
|
RATING |
STATUS |
PROPOSED CREDIT LINE |
|
|
>86 |
Aaa |
Possesses an extremely sound financial base with the strongest
capability for timely payment of interest and principal sums |
Unlimited |
|
71-85 |
Aa |
Possesses adequate working capital. No caution needed for credit transaction.
It has above average (strong) capability for payment of interest and
principal sums |
Large |
|
56-70 |
A |
Financial & operational base are regarded healthy. General unfavourable
factors will not cause fatal effect. Satisfactory capability for payment of
interest and principal sums |
Fairly Large |
|
41-55 |
Ba |
Overall operation is considered normal. Capable to meet normal
commitments. |
Satisfactory |
|
26-40 |
B |
Unfavourable & favourable factors carry similar weight in credit
consideration. Capability to overcome financial difficulties seems
comparatively below average. |
Small |
|
11-25 |
Ca |
Adverse factors are apparent. Repayment of interest and principal sums
in default or expected to be in default upon maturity |
Limited with
full security |
|
<10 |
C |
Absolute credit risk exists. Caution needed to be exercised |
Credit not
recommended |
|
NR |
In view of the lack of information, we have no basis upon which to
recommend credit dealings |
No Rating |
|
This score serves as a reference to assess SC’s credit risk
and to set the amount of credit to be extended. It is calculated from a composite
of weighted scores obtained from each of the major sections of this report. The
assessed factors and their relative weights (as indicated through %) are as
follows:
Financial
condition (40%) Ownership
background (20%) Payment
record (10%)
Credit history
(10%) Market trend
(10%) Operational
size (10%)