![]()
MIRA
INFORM REPORT
|
Report Date : |
03.07.2008 |
IDENTIFICATION
DETAILS
|
Name : |
NOBERPLAST SL |
|
|
|
|
Registered Office : |
Street Avicola, 106, Cp 28860, Paracuellos De
Jarama Madrid |
|
|
|
|
Country : |
Spain |
|
|
|
|
Financials (as on) : |
31.12.2006 |
|
|
|
|
Date of Incorporation : |
|
|
|
|
|
Legal Form : |
Limited Liability Company |
|
|
|
|
Line of Business : |
Wholesale of Other Products |
RATING &
COMMENTS
|
MIRA’s Rating : |
B |
|
RATING |
STATUS |
PROPOSED CREDIT LINE |
|
|
26-40 |
B |
Unfavourable & favourable factors carry similar weight in credit consideration.
Capability to overcome financial difficulties seems comparatively below
average. |
Small |
|
Maximum Credit Limit : |
18.499,15 € |
|
|
|
|
Status : |
Small Company |
|
|
|
|
Payment Behaviour : |
No Complaints |
|
|
|
|
Litigation : |
Clear |
FINANCIAL
REPORT
NOBERPLAST SL
TAX NUMBER: B78500709
EXECUTIVE SUMMARY
Identification
Current Business Name: NOBERPLAST SL
Other names: YES
Current Address: STREET AVICOLA, 106, CP 28860, PARACUELLOS
DE JARAMA MADRID
Branches: 1
Telephone number: 916584242 Fax: 916583055
URL:
www.noberplast.com Corporate e-mail: noberplast@noberplast.com
Commercial Risk
Credit Appraisal: 18.499,15 €
Legal
Actions: NO
Financial Information
Latest Balance sheet sales (2006): 5.605.165,13 € (MERCANTILE REGISTER)
Result: 17.583,4 €
Total Assets: 3.909.460,36 €
Social Capital: 69.102,98 €
Employees: 19
Commercial Information
Constitution Date: 04/06/1987
Business activity: Wholesale of
other products
NACE Code: 5170
International Operations: No business
relationships registered
Corporate Structure
Administrator:
Other Complementary Information
Latest proceeding published in BORME: 02/11/2007 Registration
of accounts
Bank Entities: Yes
Credit Appraisal
Maximum Credit (from 0 a 6,000,000 €):
18.499,15 €
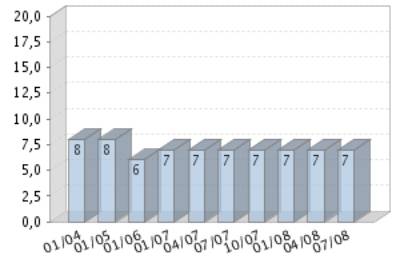
Rating Evolution
Financial Situation
Fiscal year2006
|
Treasury |
Tense |
|
Indebtedness |
Heavy |
|
Profitability |
Null |
|
Balance |
Very Degraded |
Performance
|
Legal Actions |
None or Negligible |
|
Business
Trajectory |
Excellent |
INCIDENTS

Summary
LEGAL ACTIONS: No legal incidences registered
CLAIM FILED AGAINST THE ADMINISTRATION: No administrative
claims registered
AFFECTED BY: No significant element.
FINANCIAL ELEMENTS AND SECTORIAL
COMPARATIVE
FINANCIAL ELEMENTS
Figures given in €
|
|
2004 (12) |
2005 (12) |
2006 (12) |
% ASSETS |
|
|
|
|
|
|
BALANCE SHEET
ANALYSIS |
|
|
|
|
|
|
|
|
|
|
OWN FUNDS |
131.752,32 |
145.857,25 |
163.440,65 |
4,18 |
|
|
|
|
|
|
DEBT |
2.184.005,73 |
2.833.448,79 |
3.746.019,71 |
95,82 |
|
|
|
|
|
|
FIXED ASSETS |
761.713,85 |
839.675,13 |
856.319,32 |
21,90 |
|
|
|
|
|
|
TOTAL ASSETS |
2.315.758,05 |
2.979.306,04 |
3.909.460,36 |
|
|
|
|
|
|
|
|
|
|
|
|
|
|
|
|
|
|
|
2004 (12) |
2005 (12) |
2006 (12) |
% SALES |
|
|
|
|
|
|
PROFIT AND LOSS
ACCOUNT ANALYSIS |
|
|
|
|
|
|
|
|
|
|
SALES |
3.435.273,04 |
4.628.059,88 |
5.605.165,13 |
|
|
|
|
|
|
|
ADDED VALUE |
383.640,80 |
410.656,79 |
402.635,74 |
7,18 |
|
|
|
|
|
|
EBITDA |
75.080,82 |
77.083,17 |
41.647,62 |
0,74 |
|
|
|
|
|
|
EBIT |
35.151,76 |
32.751,59 |
41.647,62 |
0,74 |
|
|
|
|
|
|
NET RESULT |
12.856,25 |
14.068,72 |
17.583,40 |
0,31 |
|
|
|
|
|
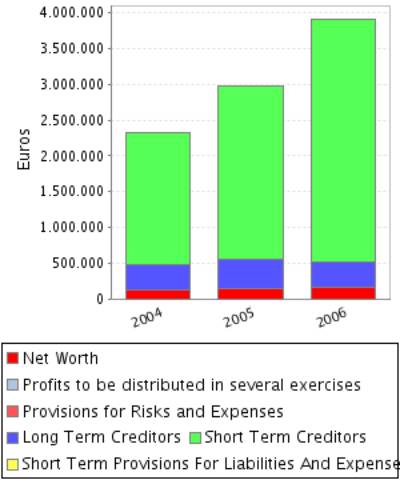
Balance Sheets Items Analysis
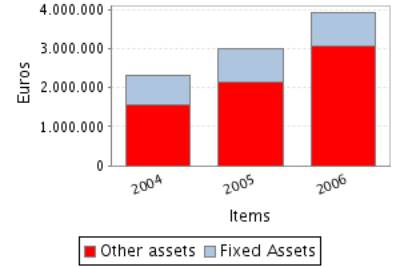
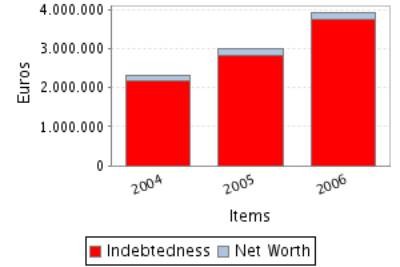
Balance Sheet
Comments
Total assets of the company grew 28,65% between 2004 and 2005.
This growth has been inferior in the case of the fixed assets that
increased just in 10,23%.
This growth has been mainly financed with a debt increase of 29,74%.
Nevertheless the net worth increased 10,71%.
Total assets of the company grew 31,22% between 2005 and 2006.
This growth has been inferior in the case of the fixed assets that
increased just in 1,98%.
This growth has been mainly financed with a debt increase of 32,21%.
Nevertheless the net worth increased 12,06%.
Profit and Loss Account Analysis

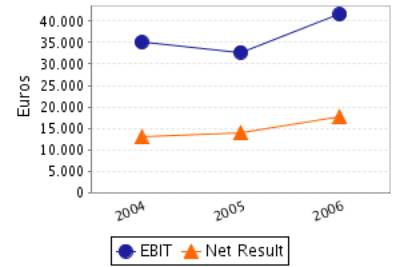
Profit and Loss
Account Comments
The company’s sales figure grew 34,72% between 2004 and 2005.
The company’s EBIT decreased in 6,83% between 2004 and 2005.
This evolution implies a reduction in the company’s operating
profitability.
The result of these variations is a decrease of the company’s Economic
Profitability of 27,58% in the analysed period, being this profitability of
1,10% in the year 2005.
The company’s Net Result grew 9,43% between 2004 and 2005.
This evolution, compared to the EBIT’s performance, implies that the
financial and extraordinary activities have had a positive effect in the
company’s Financial Profitability.
The result of these variations is a reduction of the company’s
profitability of 1,15% in the analysed period, being equal to 9,65% in the year
2005.
The company’s sales figure grew 21,11% between 2005 and 2006.
The company’s EBIT grew 27,16% between 2005 and 2006.
This evolution implies an increase in the company’s operating
profitability.
The result of these variations is a decrease of the company’s Economic
Profitability of 3,09% in the analysed period, being this profitability of
1,07% in the year 2006.
The company’s Net Result grew 24,98% between 2005 and 2006.
This evolution, compared to the EBIT’s performance, implies that the
financial and extraordinary activities have had a negative effect in the
company’s Financial Profitability.
The result of these variations is an increase of the company’s Economic
Profitability of 11,54% in the analysed period, being equal to 10,76% in the
year 2006.
ANNUAL FINANCIAL REPORT
ADDITIONAL DATA
Source: annual financial report 2006
Results Distribution
Figures given in €
|
DISTRIBUTION
BASE |
DISTRIBUTION TO |
||
|
Profit and Loss |
17.583,40 |
Retained earnings |
1.758,34 |
|
Carry Over |
0,00 |
Voluntary Reserve |
15.825,06 |
|
Voluntary reserves |
0,00 |
Prior years losses |
0,00 |
|
Reserves |
0,00 |
Carry Over |
0,00 |
|
Other concepts |
0,00 |
Other funds |
0,00 |
|
Total of Amounts to be distributed |
17.583,40 |
Dividends |
0,00 |
|
|
|
Other Applications |
0,00 |
COMPARATIVE SECTOR
ANALYSIS
Values table
Figures expressed in %
|
|
COMPANY (2006) |
SECTOR |
DIFFERENCE |
DIFFERENCE RELATIVE |
|
|
|
|
|
|
BALANCE SHEET
ANALYSIS: % on the total assets |
|
|
|
|
|
|
|
|
|
|
OWN FUNDS |
4,18 |
37,06 |
-32,88 |
-88,72 |
|
|
|
|
|
|
DEBT |
95,82 |
62,94 |
32,88 |
52,24 |
|
|
|
|
|
|
FIXED ASSETS |
21,90 |
22,65 |
-0,75 |
-3,31 |
|
|
|
|
|
|
|
|
|
|
|
|
|
|
|
|
|
|
COMPANY (2006) |
SECTOR |
DIFFERENCE |
DIFFERENCE RELATIVE |
|
|
|
|
|
|
PROFIT AND LOSS
ACCOUNT ANALYSIS: % on the total operating income |
|
|
|
|
|
|
|
|
|
|
SALES |
99,99 |
98,78 |
1,21 |
1,23 |
|
|
|
|
|
|
ADDED VALUE |
7,18 |
18,82 |
-11,63 |
-61,83 |
|
|
|
|
|
|
EBIT |
0,74 |
5,31 |
-4,57 |
-86,02 |
|
|
|
|
|
|
NET RESULT |
0,31 |
3,58 |
-3,27 |
-91,24 |
|
|
|
|
|
Sector Composition
Compared sector (NACE): 517
Number of companies: 361
Size (Sales Figure) : 2.800.000,00 - 7.000.000,00 Euros
Comments on the
sectorial comparative
Compared to its sector the assets of the companies show an inferior
proportion of fixed assets. Specifically the difference with the sector average
is -0,75% , which means a relative difference of -3,31% .
In liabilities composition the company appeals on a wider scale to self
financing, being the proportion of net worth of 32,88% inferior, which means a
relative difference of 88,72% 32,88% more than the sector, which means a
difference of 52,24% .
The proportion that the sales mean to the company’s total ordinary
income is 99,99%, 1,21% higher than in the sector, which means a relative
difference of 1,23% .
The company’s EBIT was positive and was 0,74% with regard to the total
ordinary income, 4,57% less than the sector, which means a relative difference
of 86,02% .
The company’s capacity to generate operating income is equal to that of
the sector as its ratio EBIT/Sales is also equal.
The company’s net result was positive and equal to 0,31% with regard to
the total ordinary income, 3,27% less than the sector, which means a relative
difference of 91,24% .
The financial and extraordinary results and the tax impact have had a
negative impact on the Net result in the company with a worse behaviour than in
the sector; as a consequence, the company shows a worse Net Result/EBIT ratio
(REBEmpresa vs. REBSector).
ADDRESSES
Current Legal Seat Address:
STREET AVICOLA, 106
28860 PARACUELLOS DE JARAMA MADRID
Previous Seat Address:
STREET MIGUEL YUSTE, 9
28037
MADRID
Characteristics of
the current address
Type of premises: office, warehouse
Local Situation: secondary
Branches 
|
STREET |
POSTAL CODE |
TOWN |
PROVINCE |
|
STREET MIGUEL YUSTE 9 |
28037 |
MADRID |
Madrid |
1 branches registered
CORPORATE STRUCTURE
ADMINISTRATIVE LINKS
Main Board members,
Directors and Auditor ![]()
|
POSITION |
SURNAMES AND
NAME |
APPOINTMENT DATE |
|
ADMINISTRATOR |
LEAL ALVAREZ JOSE LUIS |
24/04/1996 |
|
ADMINISTRATOR |
SAORIN RUIZ JOSE |
24/04/1996 |
Functional Managers
|
POSITION |
SURNAMES AND
NAME |
|
General Manager |
LEAL ALVAREZ JOSE LUIS |
|
Financial Manager |
SAORIN RUIZ JOSE |
FINANCIAL LINKS
|
|
BUSINESS NAME |
CIF / COUNTRY |
% |
SOURCE |
DATA INF. |
|
|
SAORIN PINERA JOSE |
ESPAÑA |
33,00 |
OWN SOURCES |
22/03/2007 |
|
|
SAORIN RUIZ JOSE |
ESPAÑA |
33,00 |
OWN SOURCES |
22/03/2007 |
|
|
LEAL ALVAREZ JOSE LUIS |
ESPAÑA |
33,00 |
OWN SOURCES |
24/04/2006 |
CREDIT INFORMATION
Constitution Date: 04/06/1987
Business activity 
Activity: Wholesale of other products
NACE Code: 5170
NACE Activity: Other wholesale
Business: DISTRIBUCION DE PLASTICOS, ALUMINIOS, ETC
(Enlargement)REDACCION Y DIRECCION DE PROYECTOS TECNICOS DE OBRAS E
INDUSTRIALES, ASI COMO LA CONTRATACION O EJECUCION DE OBRAS. PROMOCION DE
EDIFICACIONES, SERVICIOS RELATIVOS A LA PROPIEDAD INMOBILIARIA Y A LA PROPIEDAD
INDUSTRIAL.
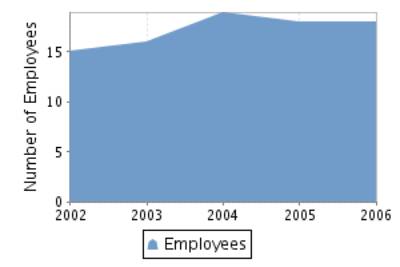
Employees 
Number of total employees: 19 (2008)
Number of fixed employees: 100,00%
Number of temporary employees: 0,00%
Employees evolution
COMMERCIAL OPERATIONS 
SALES
Collection (estimated):
Cash sales percentage: 50%
On a credit basis: 50%
Local Distribution: 100%
Banks 
|
ENTITY |
BRANCH |
ADDRESS |
TOWN OR CITY |
PROVINCE |
|
BANCO POPULAR
ESPAÑOL, S.A. |
0045 |
PLAZA DE CANALEJAS, 6 |
SOLANA (LA) |
Ciudad Real |
|
M.P.C.A. RONDA,
CADIZ, ALMERIA, MALAGA Y ANTEQUERA |
|
|
|
|
2 bank entities registered
Brands, Signs and Commercial
Names 
Brand name: EL PLASTICO NO CONTAMINA TU SI. N RECICLA
! (Valid)
Type: JOINT Date: 23/10/2002
LEGAL STRUCTURE
Constitution Data
Register Date: 04/06/1987
Current structure data 
Current Legal Form: LIMITED LIABILITY COMPANY
Current Capital: 69.102,98 €
Legal Aspects
Obligation to fill in Financial Statements: YES
Chamber census: YES (2006)
Listed on a Stock Exchange: NO
B.O.R.M.E.(Official Companies
Registry Gazette) 
Registered Proceedings
|
PROCEEDINGS |
DATE |
NOTICE NUM. |
TRADE REG. |
|
Activity extension |
21/08/2007 |
430965 |
Madrid |
Other Proceedings published
|
PROCEEDINGS |
DATE |
NOTICE NUM. |
TRADE REG. |
|
Registration of
accounts (2006) Individual |
02/11/2007 |
940260 |
Madrid |
|
Registration of
accounts (2005) Individual |
14/11/2006 |
878788 |
Madrid |
|
Registration of
accounts (2004) Individual |
24/10/2005 |
786887 |
Madrid |
|
Registration of
accounts (2003) Individual |
03/11/2004 |
755552 |
Madrid |
FINANCIAL INFORMATION
The information on the last account contained in this report is
extracted from the Mercantile Register file of the legal address of the Company
and dated 04/01/2008.
BALANCE SHEET
Assets
Figures given in €
|
|
31/12/2004 (12) |
31/12/2005 (12) |
31/12/2006 (12) |
|
A) DUE FROM SHAREHOLDERS FOR UNCALLED CAPITAL |
|
|
|
|
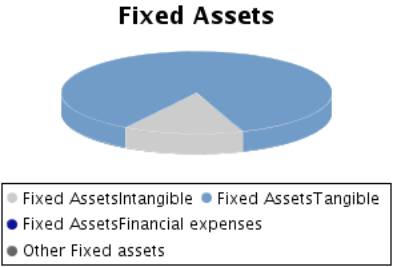
B) FIXED ASSETS |
761.713,85 |
839.675,13 |
856.319,32 |
|
I. Incorporation costs |
|
|
|
|
II. Intangible fixed assets |
21.604,80 |
100.319,85 |
123.047,87 |
|
III. Tangible fixed assets |
737.765,10 |
739.355,28 |
733.271,45 |
|
IV. Financial fixed assets |
2.343,95 |
|
|
|
V.Owners equity |
|
|
|
|
VI.Long term trade liabilities |
|
|
|
|
C) DEFERRED EXPENSES |
1.492,93 |
7.722,36 |
7.036,47 |
|
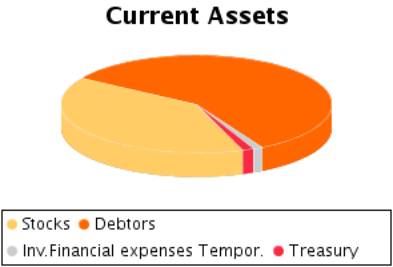
D) CURRENT ASSETS |
1.552.551,27 |
2.131.908,55 |
3.046.104,57 |
|
I. Shareholders by required outlays |
|
|
|
|
II. Stocks |
759.282,04 |
910.898,00 |
1.205.343,67 |
|
III. Debtors |
711.663,63 |
1.152.660,28 |
1.763.992,70 |
|
IV. Temporary financial investment |
5.233,33 |
6.376,68 |
36.376,68 |
|
V. Short-term own shares |
|
|
|
|
VI. Treasury |
76.372,27 |
61.973,59 |
40.391,52 |
|
VII. Periodification adjustments |
|
|
|
|
ASSETS (A + B + C + D) |
2.315.758,05 |
2.979.306,04 |
3.909.460,36 |
Assets composition
Liabilities
Figures given in €
|
|
31/12/2004 (12) |
31/12/2005 (12) |
31/12/2006 (12) |
|
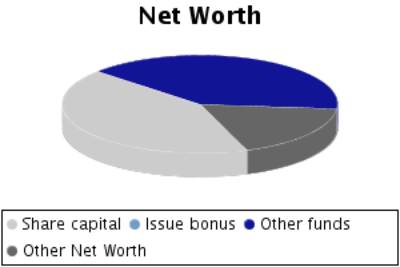
A) SHAREHOLDERS EQUITY |
131.752,32 |
145.857,25 |
163.440,65 |
|
I. Share capital |
69.102,98 |
69.102,98 |
69.102,98 |
|
II. Issue bonus |
|
|
|
|
III.Revaluation reserve |
|
|
|
|
IV.Reserves |
49.775,65 |
51.114,93 |
65.183,65 |
|
Capital adjustments in Euros |
|
|
|
|
Sundry reserves |
49.775,65 |
51.114,93 |
65.183,65 |
|
V.Results from previous years |
17,44 |
11.570,62 |
11.570,62 |
|
VI.Profit and Losses |
12.856,25 |
14.068,72 |
17.583,40 |
|
VII.Dividend paid during the year |
|
|
|
|
VIII.Own shares for capital reduction |
|
|
|
|
B) DEFERRED INCOME |
|
|
|
|
C) PROVISIONS FOR LIABILITIES AND EXPENSES |
|
|
|
|
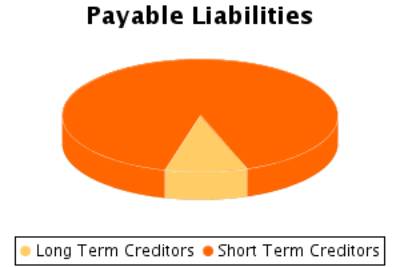
D) LONG TERM LIABILITIES |
344.201,66 |
402.420,82 |
361.959,24 |
|
E) SHORT TERM LIABILITIES |
1.839.804,07 |
2.431.027,97 |
3.384.060,47 |
|
F) SHORT TERM PROVISIONS FOR LIABILITIES AND
EXPENSES |
|
|
|
|
LIABILITIES (A + B + C + D + E + F) |
2.315.758,05 |
2.979.306,04 |
3.909.460,36 |
Liabilities
Composition
PROFIT AND LOSS ACCOUNT
Itams of the Profit
and Loss Account
Figures given in €
|
|
31/12/2004 (12) |
31/12/2005 (12) |
31/12/2006 (12) |
|
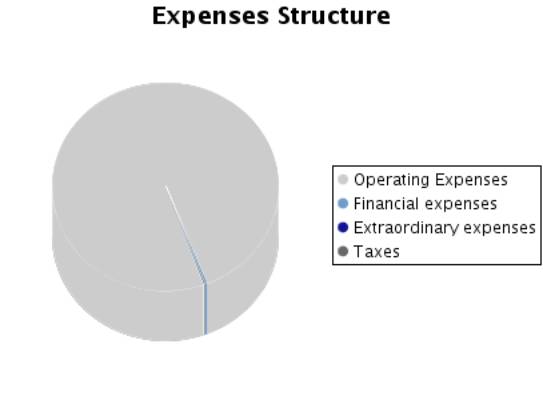
A) EXPENSES (A.1 a A.15) |
3.427.375,82 |
4.620.028,04 |
5.590.335,54 |
|
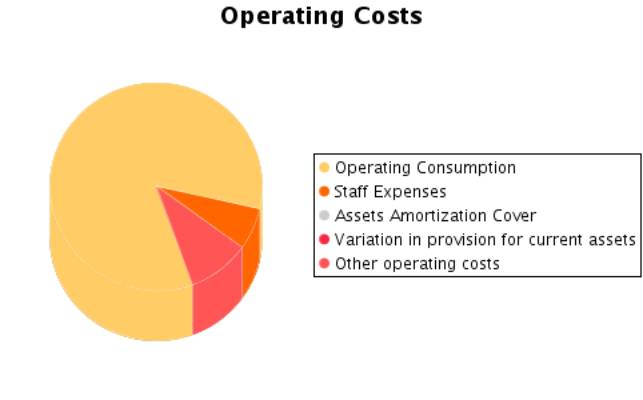
A.1.Operating costs |
2.671.031,42 |
3.803.641,83 |
4.675.692,26 |
|
A.2. Labour cost |
308.559,98 |
333.573,62 |
360.988,12 |
|
Wages |
256.672,22 |
277.971,89 |
314.900,76 |
|
Social security
expenses |
51.887,76 |
55.601,73 |
46.087,36 |
|
A.3. Assets
depreciation |
39.929,06 |
44.331,58 |
|
|
A.4. Variation
in provision for current assets |
|
|
|
|
A.5. Other
operating costs |
385.484,92 |
419.375,01 |
527.267,79 |
|
A.I. OPERATING
RESULT (B.1-A.1-A.2-A.3-A.4-A.5) |
35.151,76 |
32.751,59 |
41.647,62 |
|
A.6.Financial
expenses and similar |
16.860,62 |
13.076,55 |
18.851,62 |
|
Debts with
related companies |
|
13.076,55 |
|
|
Debts with
associated companies |
|
|
|
|
Other companies
debts By debts with third parties and similar expenses |
16.860,62 |
|
18.851,62 |
|
Losses from
financial investments |
|
|
|
|
A.7. Variation
in financial investment provision |
|
|
|
|
A.8.Negative
exchange difference |
|
|
|
|
A.II.POSITIVE
FINANCIAL RESULTS (B.2+B.3-A.6-A.7-A.8) |
|
|
|
|
A.III.PROFIT
FROM ORDINARY ACTIVITIES (A.I+A.II-B.I-B.II) |
18.366,07 |
20.098,17 |
23.142,11 |
|
A.9. Variation
in provision in fixed assets |
|
|
|
|
A.10. Losses in
fixed assets |
|
|
|
|
A.11. Losses from own shares and bonds |
|
|
|
|
A.12. Extraordinary charges |
|
|
|
|
A.13.Other
exercises’ expenses and losses |
|
|
|
|
A.IV.POSITIVE EXTRAORDINARY
RESULT (B.4+B.5+B.6+B.7+B.8-A.9-A.10-A.11-A.12-A.13) |
|
|
1.977,04 |
|
A.V.PROFIT
BEFORE TAXES (A.III+A.IV-B.III-B.IV) |
18.366,07 |
20.098,17 |
25.119,15 |
|
A.14.Corporate
Taxes |
5.509,82 |
6.029,45 |
7.535,75 |
|
A.15. Other
taxes |
|
|
|
|
A.VI.EXERCISE
RESULT (PROFIT) (A.V-A.14-A.15) |
12.856,25 |
14.068,72 |
17.583,40 |
|
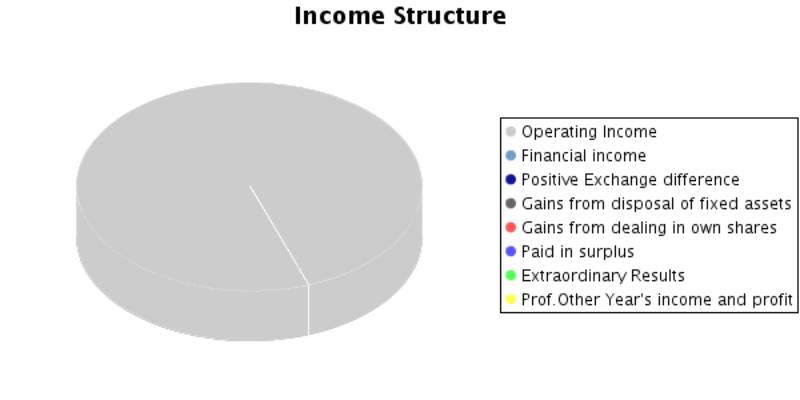
B) INCOMES (B.1
a B.8) |
3.440.232,07 |
4.634.096,76 |
5.607.918,94 |
|
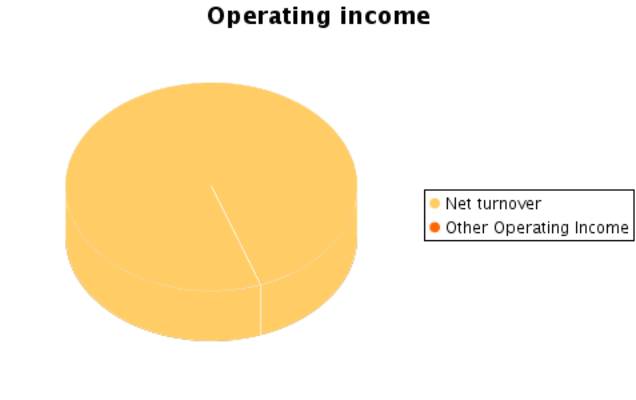
B.1.Operating
income |
3.440.157,14 |
4.633.673,63 |
5.605.595,79 |
|
Turnover |
3.435.273,04 |
4.628.059,88 |
5.605.165,13 |
|
Other operating
income |
4.884,10 |
5.613,75 |
430,66 |
|
B.I.OPERATING
LOSSES (A.1+A.2+A.3+A.4+A.5-B.1) |
|
|
|
|
B.2.Financial Income |
74,93 |
423,13 |
346,11 |
|
From affiliated companies |
|
1,44 |
|
|
From associated companies |
|
|
|
|
Other |
74,93 |
421,69 |
346,11 |
|
Gains from
investments |
|
|
|
|
B.3. Positive
change difference |
|
|
|
|
B.II. NEGATIVE
FINANCIAL RESULTS (A.6+A.7+A.8-B.2-B.3) |
16.785,69 |
12.653,42 |
18.505,51 |
|
B.III.LOSSES
FROM ORDINARY ACTIVITIES (B.I+B.II-A.I-A.II) |
|
|
|
|
B.4.B.9. Gains
from disposal of fixed assets |
|
|
960,30 |
|
B.5.Gains from
dealing in own shares |
|
|
|
|
B.6. Paid in
surplus |
|
|
|
|
B.7.
Extraordinary income |
|
|
1.016,74 |
|
B.8.Other year’s
income and profits |
|
|
|
|
B.IV.NEGATIVE
EXTRAORDINARY LOSSES (A.9+A.10+A.11+A.12+A.13-B.4-B.5-B.6-B.7-B.8) |
|
|
|
|
B.V.LOSS BEFORE
TAXES (B.III+B.IV-A.III-A.IV) |
|
|
|
|
B.VI.EXERCISE RESULTS (LOSS) (B.V+A.14+A.15) |
|
|
|
Composition of the
Profit and Loss Account
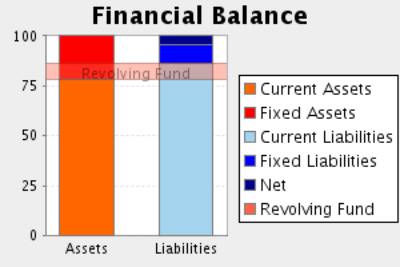
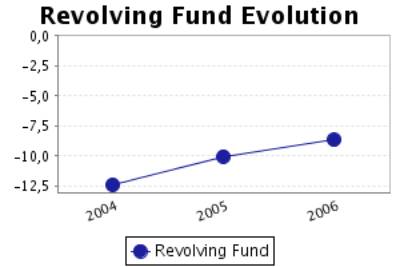
FINANCIAL BALANCE
Here the Main Capital Amounts of the company and the Revolving Fund
Evolution are analysed.
Financial Balance
Table
Figures given in €
|
|
31/12/2004 (12) |
% |
31/12/2005 (12) |
% |
31/12/2006 (12) |
% |
|
A) DUE FROM
SHAREHOLDERS FOR UNCALLED CAPITAL |
|
|
|
|
|
|
|
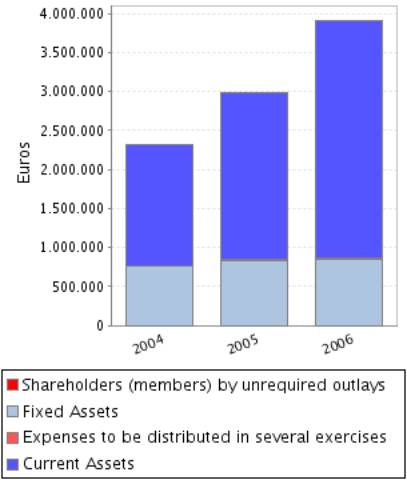
B) FIXED ASSETS |
761.713,85 |
32,89 |
839.675,13 |
28,18 |
856.319,32 |
21,90 |
|
C) DEFERRED
EXPENSES |
1.492,93 |
0,06 |
7.722,36 |
0,26 |
7.036,47 |
0,18 |
|
D) CURRENT
ASSETS |
1.552.551,27 |
67,04 |
2.131.908,55 |
71,56 |
3.046.104,57 |
77,92 |
|
ASSETS (A + B +
C + D) |
2.315.758,05 |
|
2.979.306,04 |
|
3.909.460,36 |
|
|
|
||||||
|
A) SHAREHOLDERS
EQUITY |
131.752,32 |
5,69 |
145.857,25 |
4,90 |
163.440,65 |
4,18 |
|
B) DEFERRED
INCOME |
|
|
|
|
|
|
|
C) PROVISIONS
FOR LIABILITIES AND EXPENSES |
|
|
|
|
|
|
|
D) LONG TERM
LIABILITIES |
344.201,66 |
14,86 |
402.420,82 |
13,51 |
361.959,24 |
9,26 |
|
E) SHORT TERM
LIABILITIES |
1.839.804,07 |
79,45 |
2.431.027,97 |
81,60 |
3.384.060,47 |
86,56 |
|
F) SHORT TERM
PROVISIONS FOR LIABILITIES AND EXPENSES |
|
|
|
|
|
|
|
LIABILITIES (A +
B + C + D + E + F) |
2.315.758,05 |
|
2.979.306,04 |
|
3.909.460,36 |
|
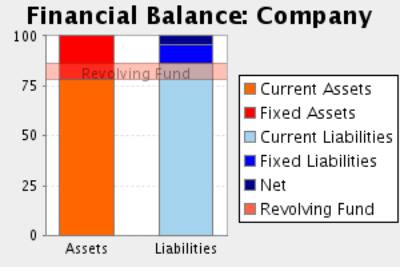
Financial Balance
Composition
Comments on Financial
Balance
In the 2004, the assets of the company were formed in 32,96% of Fixed
Assets and in 67,04% of Current Assets.This assets were financed in 5,69% with own
capitals, and in 14,86% with long term debt and in 79,45% with current
liabilities.
The result of this financial structure is a negative turnover fund of
-287.252,80 Euros, which is equivalent to -12,40% proportion of the company’s
total assets.
In the 2005, the assets of the company were formed in 28,44% of Fixed
Assets and in 71,56% of Current Assets.This assets were financed in 4,90% with
own capitals, and in 13,51% with long term debt and in 81,60% with current
liabilities.
The result of this financial structure is a negative turnover fund of
-299.119,42 Euros, which is equivalent to -10,04% proportion of the company’s
total assets.
This measure has diminished with respect to the previous exercise in
4,13% having, however, increased its proportion with respect to the total
assets of the company.
In the 2006, the assets of the company were formed in 22,08% of Fixed
Assets and in 77,92% of Current Assets.This assets were financed in 4,18% with
own capitals, and in 9,26% with long term debt and in 86,56% with current
liabilities.
The result of this financial structure is a negative turnover fund of
-337.955,90 Euros, which is equivalent to -8,64% proportion of the company’s
total assets.
This measure has diminished with respect to the previous exercise in
12,98% having, however, increased its proportion with respect to the total
assets of the company.
RATIOS
Main Ratios
|
|
31/12/2004 (12) |
31/12/2005 (12) |
31/12/2006 (12) |
|
STRUCTURAL RATIOS |
|
|
|
|
Management fund |
-287.252,80 |
-299.119,42 |
-337.955,90 |
|
Indebtedness (%) |
94,31 |
95,10 |
95,82 |
|
External Funds on Net Worth |
16,58 |
19,43 |
22,92 |
|
GENERAL ACTIVITY RATIO |
|
|
|
|
Turnover Increase (%) |
6,87 |
34,72 |
21,11 |
|
Added value growth (%) |
13,04 |
7,04 |
-1,95 |
|
Cash Flow |
52.785,31 |
58.400,30 |
17.583,40 |
|
Labour Productivity |
1,24 |
1,23 |
1,12 |
|
Assets turnover |
1,48 |
1,55 |
1,43 |
|
Breakdown Point |
3.282.929,82 |
4.450.837,05 |
5.354.537,79 |
|
Security Margin of the Breakdown Point (%) |
4,57 |
3,95 |
4,48 |
|
ACTIVITY RATIOS |
|
|
|
|
Average Collection Period |
75 |
90 |
113 |
|
Inventory Turnover Period |
80 |
71 |
77 |
|
SOLVENCY RATIOS |
|
|
|
|
Payback Capacity |
0,02 |
0,02 |
0,00 |
|
Assets Guarantee |
1,06 |
1,05 |
1,04 |
|
Short Term Debts Proportion (%) |
84,24 |
85,80 |
90,34 |
|
Interest Coverage |
3,13 |
4,43 |
0,81 |
|
LIQUIDITY RATIOS |
|
|
|
|
Current Ratio |
0,84 |
0,88 |
0,90 |
|
Immediate liquidity |
0,04 |
0,03 |
0,02 |
|
Sales on Current Assets |
797 |
782 |
662 |
Results Analysis
Ratios
|
|
31/12/2004 (12) |
31/12/2005 (12) |
31/12/2006 (12) |
|
Economic profitability (%) |
1,52 |
1,10 |
1,06 |
|
Operating Profitability (%) |
1,02 |
0,71 |
0,74 |
|
Equity gearing |
9,18 |
12,54 |
13,29 |
|
Financial profitability (%) |
9,76 |
9,65 |
10,76 |
|
General Profitability (%) |
0,37 |
0,30 |
0,31 |
Comments on the
Results Analysis Ratios
The economic profitability in the year2005 achieved a 1,10% positive level,
due to a 0,71% economic margin and to an assets turnover of1,55%.
The economic profitability in the year has reduced from 1,52% up to
1,10% of2005, even if it remains positive. Assets turnover increase whose index
has passed from 1,48 to 1,55, could not compensate operating profitability
reduction from1,02% to the current level of 0,71%.
Financial profitability on 2005 achieved a 9,65%.
The company’s financial structure has instigated its economic
profitability with an indebtedness level of 12,54.
The general profitability on 2005 achieved a 0,30%.
The economic profitability in the year2006 achieved a 1,06% positive
level, due to a 0,74% economic margin and to an assets turnover of1,43%.
The economic profitability in the year has reduced from 1,10% up to
1,06% of2006, even if it remains positive. The decrease in assets turnover from
1,55% to the current level of 1,43has provoked this drop, which has not been
compensated by the parallel increase of the economic margin from 0,74% to
0,71%.
Financial profitability on 2006 achieved a 10,76%.
The company’s financial structure has instigated its economic
profitability with an indebtedness level of 13,29.
The general profitability on 2006 achieved a 0,31%.
SECTORIAL ANÁLYSIS
Large Capital Amounts
and Financial Balance
Figures given in %
|
|
COMPANY (2006) |
SECTOR |
DIFFERENCE |
DIFFERENCE RELATIVE |
|
|
|
|
|
|
ASSETS |
|
|
|
|
|
|
|
|
|
|
A) DUE FROM SHAREHOLDERS FOR UNCALLED CAPITAL |
|
0,03 |
|
|
|
|
|
|
|
|
B) FIXED ASSETS |
21,90 |
22,65 |
-0,75 |
-3,32 |
|
|
|
|
|
|
C) DEFERRED EXPENSES |
0,18 |
0,50 |
-0,32 |
-64,14 |
|
|
|
|
|
|
D) CURRENT ASSETS |
77,92 |
76,81 |
1,11 |
1,44 |
|
|
|
|
|
|
ASSETS (A + B + C + D) |
100 |
100 |
|
|
|
|
|
|
|
|
|
|
|
|
|
|
|
|
|
|
|
|
COMPANY (2006) |
SECTOR |
DIFFERENCE |
DIFFERENCE RELATIVE |
|
|
|
|
|
|
LIABILITIES |
|
|
|
|
|
|
|
|
|
|
A) SHAREHOLDERS
EQUITY |
4,18 |
36,88 |
-32,70 |
-88,67 |
|
|
|
|
|
|
B) DEFERRED
INCOME |
|
0,18 |
|
|
|
|
|
|
|
|
C) PROVISIONS
FOR LIABILITIES AND EXPENSES |
|
0,10 |
|
|
|
|
|
|
|
|
D) LONG TERM
LIABILITIES |
9,26 |
10,42 |
-1,16 |
-11,17 |
|
|
|
|
|
|
E) SHORT TERM
LIABILITIES |
86,56 |
52,36 |
34,20 |
65,30 |
|
|
|
|
|
|
F) SHORT TERM
PROVISIONS FOR LIABILITIES AND EXPENSES |
|
0,04 |
|
|
|
|
|
|
|
|
LIABILITIES (A + B + C + D + E + F) |
100 |
100 |
|
|
|
|
|
|
|
Financial Balance
Composition
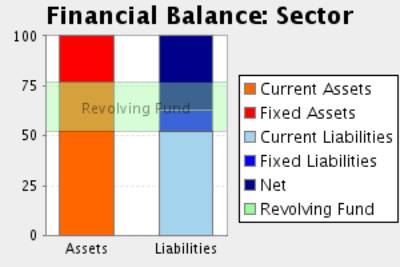
Comments to the
Sectorial Analysis
In the 2006, the assets of the company were formed in 22,08% of fixed
assets and in 77,92Current Assets % In the sector, the proportion of fixed
assets was of 23,19%, 4,77% superior, and the proportion of current assets was
of 76,81%, 1,44% inferior.
The assets were financed in the company in 4,18% with own capitals , in
9,26% with fixed liabilities and in 86,56% with current liabilities In the
sector, the self financing represented 37,06%, 88,72% superior. On the other
hand the long term debts represented in the sector an average of 10,53%
financing, with a relative difference of 12,05% favourable to the sectorAnd,
short term liabilities represented in the sector an average of 52,41%
financing, with a relative difference of 65,17% in favour of the company
The result of this company’s financial structure is a turnover fund that
represents -8,64% of the total assets; in the sector, this same proportion is
24,40%, therefore, we can say that the company’s turnover fund is 135,40%
smaller than the sector one.
Analytical Account of Results
Figures given in %
|
|
COMPANY (2006) |
SECTOR |
DIFFERENCE |
DIFFERENCE RELATIVE |
|
Turnover |
99,99 |
98,78 |
1,21 |
1,23 |
|
Other operating income |
0,01 |
1,22 |
-1,21 |
-99,18 |
|
Production Value |
100,00 |
100,00 |
0,00 |
0,00 |
|
Operating expenses |
83,41 |
68,93 |
14,48 |
21,01 |
|
Other operation expenses |
9,41 |
12,25 |
-2,84 |
-23,20 |
|
Added value |
7,18 |
18,82 |
-11,64 |
-61,84 |
|
Labour cost |
6,44 |
11,68 |
-5,24 |
-44,86 |
|
Gross Economic Result |
0,74 |
7,14 |
-6,40 |
-89,63 |
|
Assets depreciation |
|
1,48 |
|
|
|
Variation in provision for current assets and bad debt losses |
|
0,34 |
|
|
|
Net Economic Result |
0,74 |
5,31 |
-4,57 |
-86,07 |
|
Financial income |
0,01 |
0,40 |
-0,39 |
-97,51 |
|
Financial Charges |
0,34 |
1,13 |
-0,79 |
-69,94 |
|
Variation in financial investment provision |
|
-0,02 |
|
|
|
Ordinary
Activities Result |
0,41 |
4,60 |
-4,19 |
-91,09 |
|
Extraordinary
income |
0,04 |
0,75 |
-0,71 |
-94,64 |
|
Extraordinary
charges |
|
0,18 |
|
|
|
Variation in provision
in fixed assets |
|
0,05 |
|
|
|
Results before
Taxes |
0,45 |
5,13 |
-4,68 |
-91,22 |
|
Corporate taxes |
0,13 |
1,55 |
-1,42 |
-91,60 |
|
Net Result |
0,31 |
3,58 |
-3,27 |
-91,34 |
|
Assets depreciation |
|
1,48 |
|
|
|
Change of Provisions |
|
0,37 |
|
|
|
Net Self-Financing |
0,31 |
5,43 |
-5,12 |
-94,29 |
Main Ratios
|
|
COMPANY (2006) |
PTILE25 |
PTILE50 |
PTILE75 |
|
STRUCTURAL RATIOS |
|
|
|
|
|
Management fund |
-337.955,90 |
138,98 |
439,71 |
874,08 |
|
Indebtedness (%) |
95,82 |
51,91 |
70,03 |
82,30 |
|
External Funds
on Net Worth |
22,92 |
1,08 |
2,34 |
4,65 |
|
GENERAL ACTIVITY
RATIO |
|
|
|
|
|
Turnover
Increase (%) |
21,11 |
-1,79 |
7,21 |
19,37 |
|
Added value
growth (%) |
-1,95 |
-3,92 |
8,35 |
21,05 |
|
Cash Flow |
17.583,40 |
82,48 |
158,35 |
294,82 |
|
Labour
Productivity |
1,12 |
1,30 |
1,57 |
2,06 |
|
Assets turnover |
1,43 |
1,15 |
1,56 |
2,08 |
|
Breakdown Point |
5.354.537,79 |
2.596.719,03 |
3.202.200,38 |
4.013.684,17 |
|
Security Margin
of the Breakdown Point (%) |
4,48 |
7,66 |
15,01 |
25,72 |
|
ACTIVITY RATIOS |
|
|
|
|
|
Average
Collection Period |
113 |
64 |
102 |
140 |
|
Inventory
Turnover Period |
77 |
20 |
41 |
71 |
|
SOLVENCY RATIOS |
|
|
|
|
|
Payback Capacity |
0,00 |
0,04 |
0,10 |
0,21 |
|
Assets Guarantee |
1,04 |
1,21 |
1,43 |
1,91 |
|
Short Term Debts Proportion (%) |
90,34 |
80,09 |
94,04 |
99,82 |
|
Interest Coverage |
0,81 |
1,39 |
4,37 |
15,46 |
|
LIQUIDITY RATIOS |
|
|
|
|
|
Current Ratio |
0,90 |
1,09 |
1,31 |
1,78 |
|
Immediate liquidity |
0,02 |
0,05 |
0,15 |
0,37 |
|
Sales on Current Assets |
662 |
551 |
703 |
922 |
Results Analysis
Ratios
|
|
COMPANY (2006) |
PTILE25 |
PTILE50 |
PTILE75 |
|
Economic profitability (%) |
1,06 |
3,28 |
6,48 |
10,66 |
|
Operating Profitability (%) |
0,74 |
1,95 |
4,34 |
7,38 |
|
Equity gearing |
13,29 |
1,66 |
2,47 |
3,96 |
|
Financial profitability (%) |
10,76 |
6,83 |
13,84 |
22,66 |
|
General Profitability (%) |
0,31 |
1,01 |
2,38 |
4,99 |
NOTES
ABOUT YOUR REQUEST: The number included in
your enquiry (913272832 ) belongs to the fax number of a branch of the company
located in c/Miguel Yuste, 9 Madrid
28.037.
FOREIGN EXCHANGE
RATES
|
Currency |
Unit
|
Indian Rupees |
|
US Dollar |
1 |
Rs.43.21 |
|
UK Pound |
1 |
Rs.85.72 |
|
Euro |
1 |
Rs.67.92 |
RATING
EXPLANATIONS
|
RATING |
STATUS |
PROPOSED CREDIT LINE |
|
|
>86 |
Aaa |
Possesses an extremely sound financial base with the strongest capability
for timely payment of interest and principal sums |
Unlimited |
|
71-85 |
Aa |
Possesses adequate working capital. No caution needed for credit
transaction. It has above average (strong) capability for payment of interest
and principal sums |
Large |
|
56-70 |
A |
Financial & operational base are regarded healthy. General
unfavourable factors will not cause fatal effect. Satisfactory capability for
payment of interest and principal sums |
Fairly Large |
|
41-55 |
Ba |
Overall operation is considered normal. Capable to meet normal
commitments. |
Satisfactory |
|
26-40 |
B |
Unfavourable & favourable factors carry similar weight in credit
consideration. Capability to overcome financial difficulties seems comparatively
below average. |
Small |
|
11-25 |
Ca |
Adverse factors are apparent. Repayment of interest and principal sums
in default or expected to be in default upon maturity |
Limited with
full security |
|
<10 |
C |
Absolute credit risk exists. Caution needed to be exercised |
Credit not
recommended |
|
NR |
In view of the lack of information, we have no basis upon which to
recommend credit dealings |
No Rating |
|
This score serves as a reference to assess SC’s credit risk
and to set the amount of credit to be extended. It is calculated from a
composite of weighted scores obtained from each of the major sections of this
report. The assessed factors and their relative weights (as indicated through
%) are as follows:
Financial
condition (40%) Ownership
background (20%) Payment
record (10%)
Credit history
(10%) Market trend
(10%) Operational
size (10%)