![]()
MIRA
INFORM REPORT
|
Report Date : |
12.07.2008 |
IDENTIFICATION
DETAILS
|
Name : |
NUEVAS COLECCIONES JOVIMA SL |
|
|
|
|
Registered Office : |
|
|
|
|
|
Country : |
Spain |
|
|
|
|
Date of Incorporation : |
|
|
|
|
|
Legal Form : |
Limited Liability Company |
|
|
|
|
Line of Business : |
Manufacture of Jewellery and Related Articles |
RATING &
COMMENTS
|
MIRA’s Rating : |
Ba |
|
RATING |
STATUS |
PROPOSED CREDIT LINE |
|
|
41-55 |
Ba |
Overall operation is considered normal. Capable to meet normal
commitments. |
Satisfactory |
|
Status : |
Satisfactory |
|
|
|
|
Payment Behaviour : |
Regular |
|
|
|
|
Litigation : |
Clear |
FINANCIAL
REPORT
NUEVAS COLECCIONES JOVIMA SL
TAX NUMBER: B97510127
EXECUTIVE SUMMARY
Identification
Current Business Name: NUEVAS COLECCIONES
JOVIMA SL
Other names: YES
Current Address: AVENIDA DOCTOR
PESET ALEIXANDRE, 1, CP 46009 VALENCIA
Branches: 1
Telephone number: 963658847 Fax: 963658847
Commercial Risk
RAI: NO
Legal
Actions: NO
Financial Information
Latest Balance sheet sales (2006): 2.696.240,08 € (MERCANTILE REGISTER)
Result: 39.730,89 €
Total Assets: 1.402.775,73 €
Social Capital: 54.000,00 €
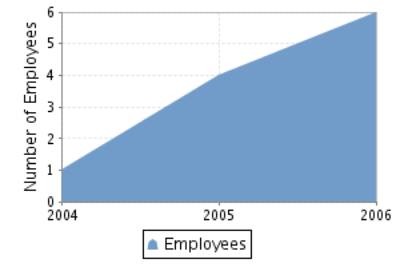
Employees: 6
Commercial Information
Constitution Date: 08/10/2004
Business activity: Jewellery
NACE Code: 3622
International Operations: Imports and
Exports
Corporate Structure
Administrator:
Other Complementary Information
Latest proceeding published in BORME: 12/12/2007 Registration
of accounts
Bank Entities: No
Rating Evolution
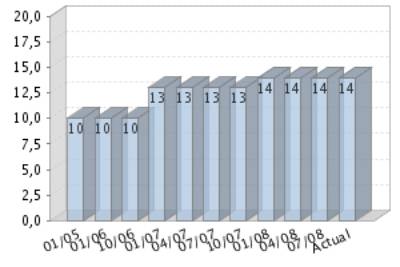
Financial Situation
Fiscal year2006
|
Treasury |
Average |
|
Indebtedness |
Heavy |
|
Profitability |
Average |
|
Balance |
Excellent |
Performance
|
Legal Actions |
None or Negligible |
|
Business
Trajectory |
Excellent |
RAI 
COMPANY NOT REGISTERED IN THE R.A.I.
This company is not registered in the Disputed Bills register (R.A.I.)
DATE AND TIME OF THE CONSULTATION: 10/07/2008
11:07:53
INCIDENTS

Summary
LEGAL ACTIONS: No legal incidences registered
CLAIM FILED AGAINST THE ADMINISTRATION: No administrative
claims registered
AFFECTED BY: No significant element.
FINANCIAL ELEMENTS AND SECTORIAL
COMPARATIVE
FINANCIAL ELEMENTS
Figures given in €
|
|
2004 (3) |
2005 (12) |
2006 (12) |
% ASSETS |
|
|
|
|
|
|
BALANCE SHEET ANALYSIS |
|
|
|
|
|
|
|
|
|
|
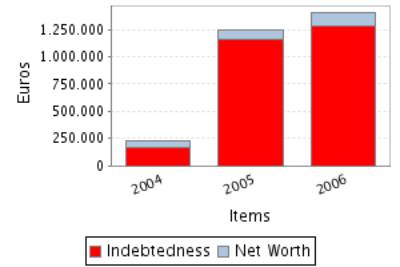
OWN FUNDS |
51.578,85 |
82.984,62 |
122.715,51 |
8,75 |
|
|
|
|
|
|
DEBT |
172.048,51 |
1.165.036,27 |
1.280.060,22 |
91,25 |
|
|
|
|
|
|
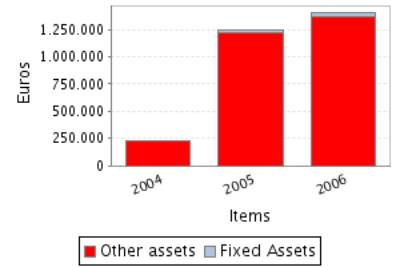
FIXED ASSETS |
|
32.539,99 |
31.304,19 |
2,23 |
|
|
|
|
|
|
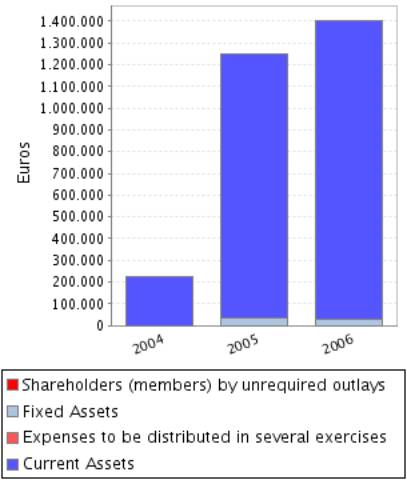
TOTAL ASSETS |
223.627,36 |
1.248.020,89 |
1.402.775,73 |
|
|
|
|
|
|
|
|
|
|
|
|
|
|
|
|
|
|
|
2004 (3) |
2005 (12) |
2006 (12) |
% SALES |
|
|
|
|
|
|
PROFIT AND LOSS ACCOUNT ANALYSIS |
|
|
|
|
|
|
|
|
|
|
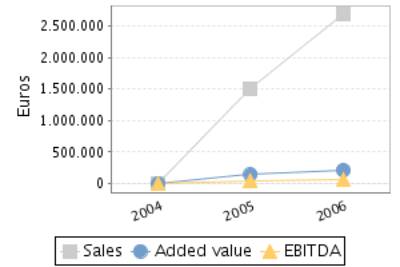
SALES |
5.581,89 |
1.507.484,74 |
2.696.240,08 |
|
|
|
|
|
|
|
ADDED VALUE |
-1.058,78 |
144.944,97 |
215.507,68 |
7,99 |
|
|
|
|
|
|
EBITDA |
-3.458,78 |
49.162,57 |
56.234,23 |
2,09 |
|
|
|
|
|
|
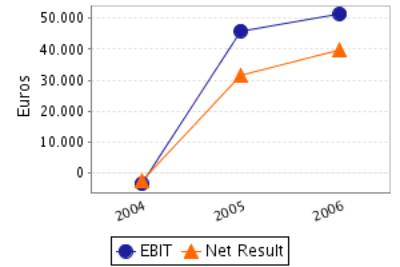
EBIT |
-3.458,78 |
45.993,62 |
51.480,80 |
1,91 |
|
|
|
|
|
|
NET RESULT |
-2.421,15 |
31.405,77 |
39.730,89 |
1,47 |
|
|
|
|
|
Balance Sheets Items
Analysis
Balance Sheet Comments
Total assets of the company grew 12,40% between and 2006.
In spite of the assets’ growth, the fixed assets decreased 3,80%.
This growth has been financed, on a wider scale, with a Shareholders’
equity increase of 47,88% and in a smaller proportion with an debt increase of
9,87%.
Profit and Loss Account Analysis
Profit and Loss Account Comments
The company’s sales figure grew 78,86% between and 2006.
The company’s EBIT grew 11,93% between and 2006.
This evolution implies a reduction in the company’s operating
profitability.
The result of these variations is a decrease of the company’s Economic
Profitability of 0,42% in the analysed period, being this profitability of
3,67% in the year 2006.
The company’s Net Result grew 26,51% between and 2006.
This evolution, compared to the EBIT’s performance, implies that the
financial and extraordinary activities have had a positive effect in the
company’s Financial Profitability.
The result of these variations is a reduction of the company’s
profitability of 14,45% in the analysed period, being equal to 32,38% in the
year 2006.
ANNUAL FINANCIAL REPORT
ADDITIONAL DATA
Source: annual financial report 2004
Results Distribution
Figures given in €
|
DISTRIBUTION
BASE |
DISTRIBUTION TO |
||
|
Profit and Loss |
-2.421,15 |
Retained earnings |
0,00 |
|
Carry Over |
0,00 |
Voluntary Reserve |
0,00 |
|
Voluntary reserves |
0,00 |
Prior years losses |
-2.421,15 |
|
Reserves |
0,00 |
Carry Over |
0,00 |
|
Other concepts |
0,00 |
Other funds |
0,00 |
|
Total of Amounts to be distributed |
-2.421,15 |
Dividends |
0,00 |
|
|
|
Other Applications |
0,00 |
COMPARATIVE SECTOR ANALYSIS
Values table
Figures expressed in %
|
|
COMPANY (2006) |
SECTOR |
DIFFERENCE |
DIFFERENCE RELATIVE |
|
|
|
|
|
|
BALANCE SHEET
ANALYSIS: % on the total assets |
|
|
|
|
|
|
|
|
|
|
OWN FUNDS |
8,75 |
38,82 |
-30,07 |
-77,46 |
|
|
|
|
|
|
DEBT |
91,25 |
61,18 |
30,07 |
49,14 |
|
|
|
|
|
|
FIXED ASSETS |
2,23 |
26,23 |
-24,00 |
-91,49 |
|
|
|
|
|
|
|
|
|
|
|
|
|
|
|
|
|
|
COMPANY (2006) |
SECTOR |
DIFFERENCE |
DIFFERENCE RELATIVE |
|
|
|
|
|
|
PROFIT AND LOSS ACCOUNT
ANALYSIS: % on the total operating income |
|
|
|
|
|
|
|
|
|
|
SALES |
100,00 |
99,41 |
0,59 |
0,59 |
|
|
|
|
|
|
ADDED VALUE |
7,99 |
32,53 |
-24,54 |
-75,43 |
|
|
|
|
|
|
EBIT |
1,91 |
2,18 |
-0,27 |
-12,50 |
|
|
|
|
|
|
NET RESULT |
1,47 |
0,82 |
0,65 |
78,83 |
|
|
|
|
|
Sector Composition
Compared sector (NACE): 362
Number of companies: 138
Size (Sales Figure) : 0 - 2.800.000,00 Euros
Comments on the sectorial comparative
Compared to its sector the assets of the companies show an inferior
proportion of fixed assets. Specifically the difference with the sector average
is -24,00% , which means a relative difference of -91,49% .
In liabilities composition the company appeals on a wider scale to self
financing, being the proportion of net worth of 30,07% inferior, which means a
relative difference of 77,46% 30,07% more than the sector, which means a
difference of 49,14% .
The proportion that the sales mean to the company’s total ordinary
income is 100,00%, 0,59% higher than in the sector, which means a relative
difference of 0,59% .
The company’s EBIT was positive and was 1,91% with regard to the total
ordinary income, 0,27% less than the sector, which means a relative difference
of 12,50% .
The company’s capacity to generate operating income is equal to that of
the sector as its ratio EBIT/Sales is also equal.
The company’s net result was positive and equal to 1,47% with regard to
the total ordinary income, 0,65% higher than in the sector, which means a
relative difference of 78,83% .
The financial and extraordinary results and the tax impact have had a
less negative impact on the Net result in the company than in the sector; as a
consequence, the company shows a better Net Result/EBIT ratio (REBEmpresa vs.
REBSector).
ADDRESSES
Current Legal Seat Address:
AVENIDA DOCTOR PESET ALEIXANDRE, 1
46009 VALENCIA
Previous Seat Address:
STREET CIUTAT DE XIXON (PG INDUSTRIAL FUENTE DEL 0), 8
46980
PATERNA VALENCIA
Characteristics of the current address
Type of premises: store
Property: owned; with
no official confirmation
Local Situation: main
Branches 
|
STREET |
POSTAL CODE |
TOWN |
PROVINCE |
|
AVENIDA DOCTOR PESET ALEIXANDRA 1 |
46009 |
VALENCIA |
Valencia |
1 branches registered
CORPORATE STRUCTURE
ADMINISTRATIVE LINKS
Main Board members, Directors and Auditor ![]()
|
POSITION |
SURNAMES AND
NAME |
APPOINTMENT DATE |
|
ADMINISTRATOR |
PEREZ JIMENEZ RAUL |
10/12/2004 |
|
ADMINISTRATOR |
PEREZ VILLALBA EFIGENIO |
10/12/2004 |
|
ADMINISTRATOR |
PEREZ JIMENEZ PABLO |
07/12/2005 |
Functional Managers
|
POSITION |
SURNAMES AND
NAME |
|
General Manager |
PEREZ JIMENEZ RAUL |
FINANCIAL LINKS
|
|
BUSINESS NAME |
CIF / COUNTRY |
% |
SOURCE |
DATA INF. |
|
|
PEREZ JIMENEZ RAUL |
|
Indet. |
OWN SOURCES |
23/05/2008 |
|
|
PEREZ JIMENEZ PABLO |
|
Indet. |
OWN SOURCES |
23/05/2008 |
|
|
PEREZ VILLALBA EFIGENIO |
|
Indet. |
OWN SOURCES |
23/05/2008 |
CREDIT INFORMATION
Constitution Date: 08/10/2004
Business activity 
Activity: Jewellery
NACE Code: 3622
NACE Activity: Manufacture of jewellery and related articles
n.e.c.
Business: FABRICACION Y COMERCIALIZACION AL PRO MAYOR Y MENOR
DE ARTICULOS DE JOYERIA Y BISUTERIA, METALES PRECIOSOS, PIEDRAS PRECIOSAS Y
ARTICULOS DE RELOJERIA
Employees 
Number of total employees: 6 (2008)
Number of fixed employees: 100,00%
Number of temporary employees: 0,00%
Employees evolution
Brands, Signs and Commercial
Names 
Brand name: NCJ (Valid)
Type: JOINT Date: 28/10/2004
LEGAL STRUCTURE
Constitution Data
Register Date: 08/10/2004
Register town: Valencia
Announcement number: 514895
Register Data:
Volume 7950, Book 5245, Folio 206, Section 8, Sheet 100108
Legal form: LIMITED LIABILITY COMPANY
Social Capital: 54.000 €
Current structure data 
Current Legal Form: LIMITED LIABILITY COMPANY
Current Capital: 54.000,00 €
Legal Aspects
Obligation to fill in Financial Statements: YES
Chamber census: YES (2006)
Listed on a Stock Exchange: NO
B.O.R.M.E.(Official Companies
Registry Gazette) 
Registered Proceedings
|
PROCEEDINGS |
DATE |
NOTICE NUM. |
TRADE REG. |
|
Appointments |
07/12/2005 |
519074 |
Valencia |
|
Change of address |
07/12/2005 |
519074 |
Valencia |
Other Proceedings published
|
PROCEEDINGS |
DATE |
NOTICE NUM. |
TRADE REG. |
|
Registration of accounts (2006) Individual |
12/12/2007 |
1172938 |
Valencia |
|
Registration of accounts (2005) Individual |
28/11/2006 |
940105 |
Valencia |
|
Registration of accounts (2004) Individual |
15/09/2005 |
420196 |
Valencia |
Complementary Information
25/10/06.BLOQUE DE INVESTIGACION:
La actividad concreta es la venta al mayor de metales preciosos y arti
culos de jopyeria.
Establecimientos
Local en propiedad (sin verificacion registral).
----------------------------------------------------------------------
El Bloque de Investigacion no esta sujeto a actulizaciones sistemati
cas. Los datos mostrados fueron aportados por las fuentes consultadas
en la fecha del encabezamiento.
FINANCIAL INFORMATION
The information on the last account contained in this report is
extracted from the Mercantile Register file of the legal address of the Company
and dated 07/12/2007.
BALANCE SHEET
Assets
Figures given in €
|
|
31/12/2004 (3) |
31/12/2005 (12) |
31/12/2006 (12) |
|
A) DUE FROM SHAREHOLDERS FOR UNCALLED CAPITAL |
|
|
|
|
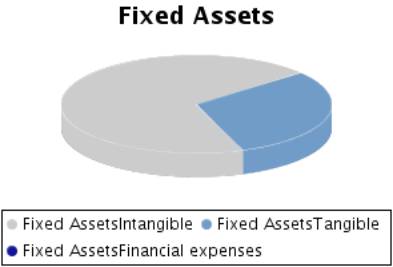
B) FIXED ASSETS |
|
32.539,99 |
31.304,19 |
|
I. Incorporation costs |
|
|
|
|
II. Intangible fixed assets |
|
26.539,99 |
21.786,56 |
|
III. Tangible fixed assets |
|
6.000,00 |
9.517,63 |
|
IV. Financial fixed assets |
|
|
|
|
V.Owners equity |
|
|
|
|
VI.Long term trade liabilities |
|
|
|
|
C) DEFERRED EXPENSES |
|
401,44 |
|
|
D) CURRENT ASSETS |
223.627,36 |
1.215.079,46 |
1.371.471,54 |
|
I. Shareholders by required outlays |
|
|
|
|
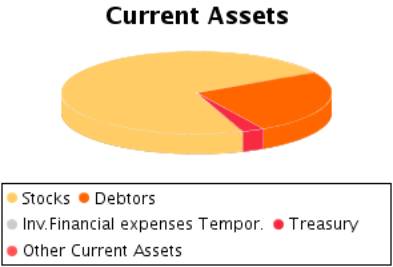
II. Stocks |
156.586,00 |
892.473,23 |
991.223,44 |
|
III. Debtors |
31.405,89 |
306.378,04 |
343.091,67 |
|
IV. Temporary financial investment |
|
|
|
|
V. Short-term own shares |
|
|
|
|
VI. Treasury |
35.635,47 |
16.228,19 |
37.156,43 |
|
VII. Periodification adjustments |
|
|
|
|
ASSETS (A + B + C + D) |
223.627,36 |
1.248.020,89 |
1.402.775,73 |
Assets composition
Liabilities
Figures given in €
|
|
31/12/2004 (3) |
31/12/2005 (12) |
31/12/2006 (12) |
|
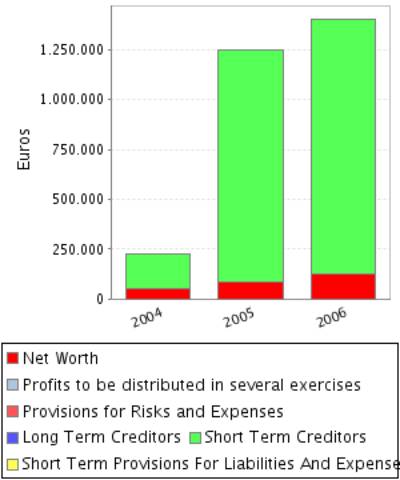
A) SHAREHOLDERS EQUITY |
51.578,85 |
82.984,62 |
122.715,51 |
|
I. Share capital |
54.000,00 |
54.000,00 |
54.000,00 |
|
II. Issue bonus |
|
|
|
|
III.Revaluation reserve |
|
|
|
|
IV.Reserves |
|
|
|
|
Capital adjustments in Euros |
|
|
|
|
Sundry reserves |
|
|
|
|
V.Results from previous years |
|
-2.421,15 |
28.984,62 |
|
VI.Profit and Losses |
-2.421,15 |
31.405,77 |
39.730,89 |
|
VII.Dividend paid during the year |
|
|
|
|
VIII.Own shares for capital reduction |
|
|
|
|
B) DEFERRED INCOME |
|
|
|
|
C) PROVISIONS FOR LIABILITIES AND EXPENSES |
|
|
|
|
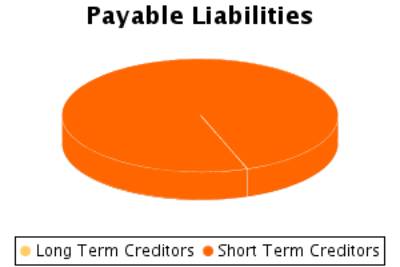
D) LONG TERM LIABILITIES |
|
4.912,76 |
|
|
E) SHORT TERM LIABILITIES |
172.048,51 |
1.160.123,51 |
1.280.060,22 |
|
F) SHORT TERM PROVISIONS FOR LIABILITIES AND
EXPENSES |
|
|
|
|
LIABILITIES (A + B + C + D + E + F) |
223.627,36 |
1.248.020,89 |
1.402.775,73 |
Liabilities
Composition
PROFIT AND LOSS ACCOUNT
Itams of the Profit
and Loss Account
Figures given in €
|
|
31/12/2004 (3) |
31/12/2005 (12) |
31/12/2006 (12) |
|
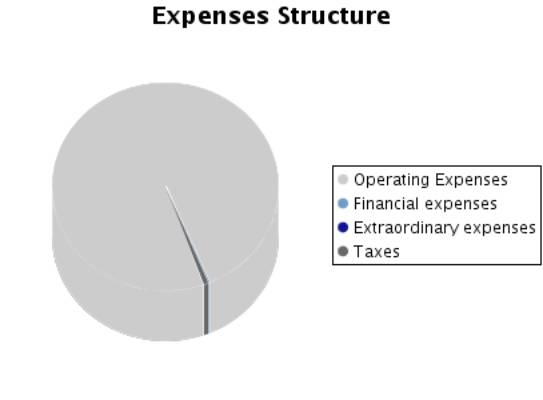
A) EXPENSES (A.1 a A.15) |
8.003,04 |
1.476.344,94 |
2.666.829,07 |
|
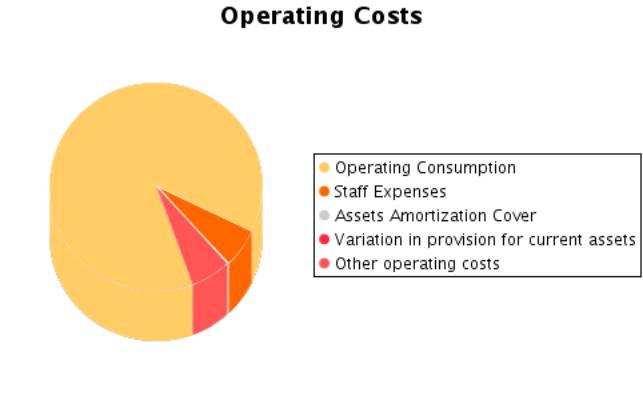
A.1.Operating costs |
5.550,68 |
1.262.429,68 |
2.319.378,95 |
|
A.2. Labour cost |
2.400,00 |
95.782,40 |
159.273,45 |
|
Wages |
2.400,00 |
90.235,62 |
144.097,67 |
|
Social security expenses |
|
5.546,78 |
15.175,78 |
|
A.3. Assets depreciation |
|
3.168,95 |
4.753,43 |
|
A.4. Variation in provision for current assets |
|
|
|
|
A.5. Other operating costs |
1.089,99 |
100.110,09 |
161.353,45 |
|
A.I. OPERATING RESULT (B.1-A.1-A.2-A.3-A.4-A.5) |
|
45.993,62 |
51.480,80 |
|
A.6.Financial expenses and similar |
|
1.394,20 |
4.911,36 |
|
Debts with related companies |
|
1.314,56 |
4.573,57 |
|
Debts with associated companies |
|
|
|
|
Other companies debts By debts with third parties and similar expenses |
|
79,64 |
337,79 |
|
Losses from financial investments |
|
|
|
|
A.7. Variation in financial investment provision |
|
|
|
|
A.8.Negative exchange difference |
|
|
130,99 |
|
A.II.POSITIVE FINANCIAL RESULTS
(B.2+B.3-A.6-A.7-A.8) |
|
|
4.450,63 |
|
A.III.PROFIT FROM ORDINARY ACTIVITIES
(A.I+A.II-B.I-B.II) |
|
44.865,39 |
55.931,43 |
|
A.9. Variation in provision in fixed assets |
|
|
|
|
A.10. Losses in fixed assets |
|
|
|
|
A.11. Losses from own shares and bonds |
|
|
|
|
A.12. Extraordinary charges |
|
|
|
|
A.13.Other exercises’ expenses and losses |
|
|
|
|
A.IV.POSITIVE EXTRAORDINARY RESULT
(B.4+B.5+B.6+B.7+B.8-A.9-A.10-A.11-A.12-A.13) |
|
|
826,90 |
|
A.V.PROFIT BEFORE TAXES (A.III+A.IV-B.III-B.IV) |
|
44.865,39 |
56.758,33 |
|
A.14.Corporate Taxes |
-1.037,63 |
13.459,62 |
17.027,44 |
|
A.15. Other taxes |
|
|
|
|
A.VI.EXERCISE RESULT (PROFIT) (A.V-A.14-A.15) |
|
31.405,77 |
39.730,89 |
|
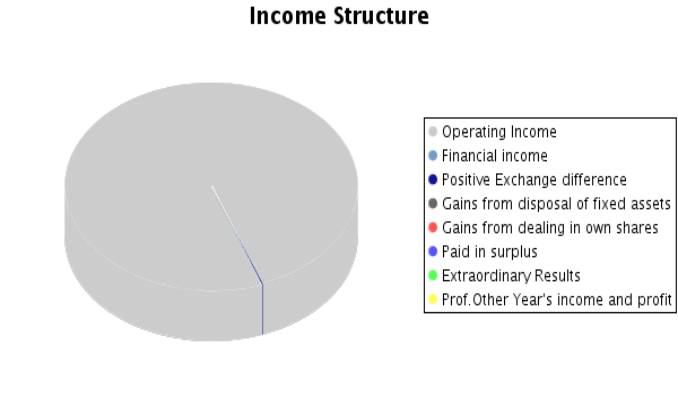
B) INCOMES (B.1 a B.8) |
5.581,89 |
1.507.750,71 |
2.706.559,96 |
|
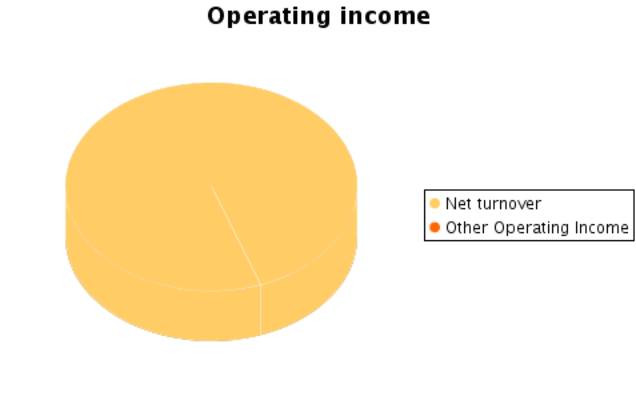
B.1.Operating income |
5.581,89 |
1.507.484,74 |
2.696.240,08 |
|
Turnover |
5.581,89 |
1.507.484,74 |
2.696.240,08 |
|
Other operating income |
|
|
|
|
B.I.OPERATING LOSSES (A.1+A.2+A.3+A.4+A.5-B.1) |
3.458,78 |
|
|
|
B.2.Financial Income |
|
|
|
|
From affiliated companies |
|
|
|
|
From associated companies |
|
|
|
|
Other |
|
|
|
|
Gains from investments |
|
|
|
|
B.3. Positive change difference |
|
265,97 |
9.492,98 |
|
B.II. NEGATIVE FINANCIAL RESULTS
(A.6+A.7+A.8-B.2-B.3) |
|
1.128,23 |
|
|
B.III.LOSSES FROM ORDINARY ACTIVITIES
(B.I+B.II-A.I-A.II) |
3.458,78 |
|
|
|
B.4.B.9. Gains from disposal of fixed assets |
|
|
|
|
B.5.Gains from dealing in own shares |
|
|
|
|
B.6. Paid in surplus |
|
|
|
|
B.7. Extraordinary income |
|
|
826,90 |
|
B.8.Other year’s income and profits |
|
|
|
|
B.IV.NEGATIVE EXTRAORDINARY LOSSES
(A.9+A.10+A.11+A.12+A.13-B.4-B.5-B.6-B.7-B.8) |
|
|
|
|
B.V.LOSS BEFORE TAXES (B.III+B.IV-A.III-A.IV) |
3.458,78 |
|
|
|
B.VI.EXERCISE RESULTS (LOSS) (B.V+A.14+A.15) |
2.421,15 |
|
|
Composition of the
Profit and Loss Account
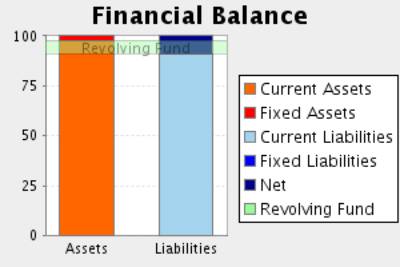
FINANCIAL BALANCE
Here the Main Capital Amounts of the company and the Revolving Fund
Evolution are analysed.
Financial Balance Table
Figures given in €
|
|
31/12/2004 (3) |
% |
31/12/2005 (12) |
% |
31/12/2006 (12) |
% |
|
A) DUE FROM
SHAREHOLDERS FOR UNCALLED CAPITAL |
|
|
|
|
|
|
|
B) FIXED ASSETS |
|
|
32.539,99 |
2,61 |
31.304,19 |
2,23 |
|
C) DEFERRED EXPENSES |
|
|
401,44 |
0,03 |
|
|
|
D) CURRENT ASSETS |
223.627,36 |
100,00 |
1.215.079,46 |
97,36 |
1.371.471,54 |
97,77 |
|
ASSETS (A + B + C + D) |
223.627,36 |
|
1.248.020,89 |
|
1.402.775,73 |
|
|
|
||||||
|
A) SHAREHOLDERS
EQUITY |
51.578,85 |
23,06 |
82.984,62 |
6,65 |
122.715,51 |
8,75 |
|
B) DEFERRED INCOME |
|
|
|
|
|
|
|
C) PROVISIONS
FOR LIABILITIES AND EXPENSES |
|
|
|
|
|
|
|
D) LONG TERM
LIABILITIES |
|
|
4.912,76 |
0,39 |
|
|
|
E) SHORT TERM
LIABILITIES |
172.048,51 |
76,94 |
1.160.123,51 |
92,96 |
1.280.060,22 |
91,25 |
|
F) SHORT TERM
PROVISIONS FOR LIABILITIES AND EXPENSES |
|
|
|
|
|
|
|
LIABILITIES (A + B + C + D + E + F) |
223.627,36 |
|
1.248.020,89 |
|
1.402.775,73 |
|
Financial Balance
Composition
Comments on Financial
Balance
In the 2004, the assets of the company were formed in 100,00% of Current
Assets.This assets were financed in 23,06% with own capitals and in 76,94% with
current liabilities.
The result of this financial structure is a positive turnover fund of
51.578,85 Euros, which is equivalent to 23,06% proportion of the
company’s total assets.
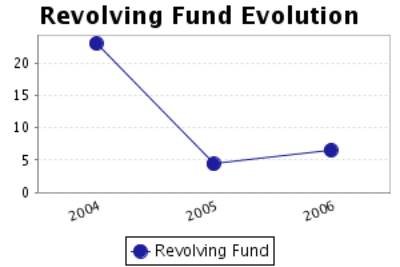
In the 2005, the assets of the company were formed in 2,64% of Fixed
Assets and in 97,36% of Current Assets.This assets were financed in 6,65% with
own capitals, and in 0,39% with long term debt and in 92,96% with current
liabilities.
The result of this financial structure is a positive turnover fund of
54.955,95 Euros, which is equivalent to 4,40% proportion of the company’s
total assets.
In the 2006, the assets of the company were formed in 2,23% of Fixed
Assets and in 97,77% of Current Assets.This assets were financed in 8,75% with
own capitals and in 91,25% with current liabilities.
The result of this financial structure is a positive turnover fund of
91.411,32 Euros, which is equivalent to 6,52% proportion of the company’s
total assets.
This measure has increased with respect to the previous exercise in
66,34% having also increased its proportion with respect to the total assets of
the company.
RATIOS
Main Ratios
|
|
31/12/2004 (3) |
31/12/2005 (12) |
31/12/2006 (12) |
|
STRUCTURAL RATIOS |
|
|
|
|
Management fund |
51.578,85 |
54.955,95 |
91.411,32 |
|
Indebtedness (%) |
76,94 |
93,35 |
91,25 |
|
External Funds on Net Worth |
3,34 |
14,04 |
10,43 |
|
GENERAL ACTIVITY RATIO |
|
|
|
|
Turnover Increase (%) |
|
|
78,86 |
|
Added value growth (%) |
|
|
48,68 |
|
Cash Flow |
-2.421,15 |
34.574,72 |
44.484,32 |
|
Labour Productivity |
-0,44 |
1,51 |
1,35 |
|
Assets turnover |
0,02 |
1,21 |
1,92 |
|
Breakdown Point |
624.182,64 |
1.224.549,63 |
2.327.922,46 |
|
Security Margin of the Breakdown Point (%) |
-11.082,28 |
18,77 |
13,66 |
|
ACTIVITY RATIOS |
|
|
|
|
Average Collection Period |
2.026 |
73 |
46 |
|
Inventory Turnover Period |
10.099 |
213 |
132 |
|
SOLVENCY RATIOS |
|
|
|
|
Payback Capacity |
-0,01 |
0,03 |
0,04 |
|
Assets Guarantee |
1,30 |
1,07 |
1,10 |
|
Short Term Debts Proportion (%) |
100,00 |
99,58 |
100,00 |
|
Interest Coverage |
|
24,61 |
6,96 |
|
LIQUIDITY RATIOS |
|
|
|
|
Current Ratio |
1,30 |
1,05 |
1,07 |
|
Immediate liquidity |
0,21 |
0,01 |
0,03 |
|
Sales on Current Assets |
9 |
447 |
708 |
Results Analysis
Ratios
|
|
31/12/2004 (3) |
31/12/2005 (12) |
31/12/2006 (12) |
|
Economic profitability (%) |
-1,55 |
3,68 |
3,67 |
|
Operating Profitability (%) |
-61,96 |
3,05 |
1,91 |
|
Equity gearing |
4,34 |
14,67 |
12,42 |
|
Financial profitability (%) |
-4,69 |
37,84 |
32,38 |
|
General Profitability (%) |
-43,38 |
2,08 |
1,47 |
Comments on the
Results Analysis Ratios
The economic profitability in the year2006 achieved a 3,67% positive
level, due to a 1,91% economic margin and to an assets turnover of1,92%.
The economic profitability in the year has reduced from 3,68% up to 3,67%
of2006, even if it remains positive. Assets turnover increase whose index has
passed from 1,21 to 1,92, could not compensate operating profitability
reduction from3,05% to the current level of 1,91%.
Financial profitability on 2006 achieved a 32,38%.
The company’s financial structure has instigated its economic
profitability with an indebtedness level of 12,42.
The general profitability on 2006 achieved a 1,47%.
SECTORIAL ANÁLYSIS
Large Capital Amounts and Financial Balance
Figures given in %
|
|
COMPANY (2006) |
SECTOR |
DIFFERENCE |
DIFFERENCE RELATIVE |
|
|
|
|
|
|
ASSETS |
|
|
|
|
|
|
|
|
|
|
A) DUE FROM
SHAREHOLDERS FOR UNCALLED CAPITAL |
|
0,09 |
|
|
|
|
|
|
|
|
B) FIXED ASSETS |
2,23 |
26,23 |
-24,00 |
-91,50 |
|
|
|
|
|
|
C) DEFERRED
EXPENSES |
|
0,66 |
|
|
|
|
|
|
|
|
D) CURRENT
ASSETS |
97,77 |
73,02 |
24,75 |
33,89 |
|
|
|
|
|
|
ASSETS (A + B +
C + D) |
100 |
100 |
|
|
|
|
|
|
|
|
|
|
|
|
|
|
|
|
|
|
|
|
COMPANY (2006) |
SECTOR |
DIFFERENCE |
DIFFERENCE RELATIVE |
|
|
|
|
|
|
LIABILITIES |
|
|
|
|
|
|
|
|
|
|
A) SHAREHOLDERS
EQUITY |
8,75 |
38,45 |
-29,70 |
-77,25 |
|
|
|
|
|
|
B) DEFERRED
INCOME |
|
0,36 |
|
|
|
|
|
|
|
|
C) PROVISIONS FOR
LIABILITIES AND EXPENSES |
|
0,29 |
|
|
|
|
|
|
|
|
D) LONG TERM
LIABILITIES |
|
15,13 |
|
|
|
|
|
|
|
|
E) SHORT TERM
LIABILITIES |
91,25 |
45,26 |
45,99 |
101,62 |
|
|
|
|
|
|
F) SHORT TERM
PROVISIONS FOR LIABILITIES AND EXPENSES |
|
0,51 |
|
|
|
|
|
|
|
|
LIABILITIES (A +
B + C + D + E + F) |
100 |
100 |
|
|
|
|
|
|
|
Financial Balance
Composition
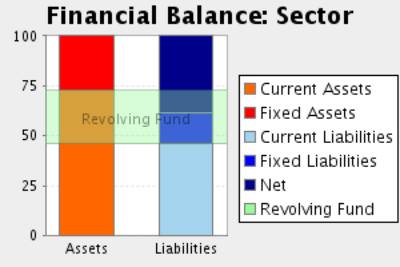
Comments to the Sectorial Analysis
In the 2006, the assets of the company were formed in 2,23% of fixed
assets and in 97,77Current Assets % In the sector, the proportion of fixed
assets was of 26,98%, 91,73% superior, and the proportion of current assets was
of 73,02%, 33,89% inferior.
The assets were financed in the company in 8,75% with own capitals and
in 91,25% with current liabilities In the sector, the self financing
represented 38,82%, 77,46% superior. On the other hand the long term debts
represented in the sector an average of 45,77% financing, with a relative
difference of 99,38% in favour of the company
The result of this company’s financial structure is a turnover fund that
represents 6,52% of the total assets; in the sector, this same proportion is
27,25%, therefore, we can say that the company’s turnover fund is 76,08%
smaller than the sector one.
Analytical Account of
Results
Figures given in %
|
|
COMPANY (2006) |
SECTOR |
DIFFERENCE |
DIFFERENCE RELATIVE |
|
Turnover |
100,00 |
99,41 |
0,59 |
0,59 |
|
Other operating income |
|
0,59 |
|
|
|
Production Value |
100,00 |
100,00 |
0,00 |
0,00 |
|
Operating expenses |
86,02 |
52,96 |
33,06 |
62,42 |
|
Other operation expenses |
5,98 |
14,51 |
-8,53 |
-58,78 |
|
Added value |
7,99 |
32,53 |
-24,54 |
-75,44 |
|
Labour cost |
5,91 |
28,17 |
-22,26 |
-79,02 |
|
Gross Economic Result |
2,09 |
4,36 |
-2,27 |
-52,06 |
|
Assets depreciation |
0,18 |
2,00 |
-1,82 |
-91,02 |
|
Variation in provision for current assets and bad debt losses |
|
0,17 |
|
|
|
Net Economic Result |
1,91 |
2,18 |
-0,27 |
-12,47 |
|
Financial income |
0,35 |
0,61 |
-0,26 |
-42,72 |
|
Financial Charges |
0,19 |
2,56 |
-2,37 |
-92,58 |
|
Variation in financial investment provision |
|
0,00 |
|
|
|
Ordinary Activities Result |
2,07 |
0,23 |
1,84 |
784,62 |
|
Extraordinary income |
0,03 |
1,75 |
-1,72 |
-98,29 |
|
Extraordinary charges |
|
0,27 |
|
|
|
Variation in provision in fixed assets |
|
0,00 |
|
|
|
Results before Taxes |
2,11 |
1,72 |
0,39 |
22,96 |
|
Corporate taxes |
0,63 |
0,89 |
-0,26 |
-29,45 |
|
Net Result |
1,47 |
0,82 |
0,65 |
78,40 |
|
Assets depreciation |
0,18 |
2,00 |
-1,82 |
-91,02 |
|
Change of Provisions |
|
0,17 |
|
|
|
Net Self-Financing |
1,65 |
3,00 |
-1,35 |
-45,04 |
Main Ratios
|
|
COMPANY (2006) |
PTILE25 |
PTILE50 |
PTILE75 |
|
STRUCTURAL RATIOS |
|
|
|
|
|
Management fund |
91.411,32 |
18,01 |
77,52 |
226,10 |
|
Indebtedness (%) |
91,25 |
42,39 |
65,05 |
80,99 |
|
External Funds on Net Worth |
10,43 |
0,74 |
1,86 |
4,26 |
|
GENERAL ACTIVITY
RATIO |
|
|
|
|
|
Turnover Increase
(%) |
78,86 |
-16,38 |
-3,48 |
8,50 |
|
Added value growth (%) |
48,68 |
-11,65 |
0,54 |
12,50 |
|
Cash Flow |
44.484,32 |
3,62 |
15,95 |
33,48 |
|
Labour Productivity |
1,35 |
1,06 |
1,19 |
1,33 |
|
Assets turnover |
1,92 |
0,74 |
1,05 |
1,56 |
|
Breakdown Point |
2.327.922,46 |
210.603,39 |
461.359,74 |
884.178,99 |
|
Security Margin of the Breakdown Point (%) |
13,66 |
0,99 |
6,20 |
12,76 |
|
ACTIVITY RATIOS |
|
|
|
|
|
Average Collection Period |
46 |
21 |
70 |
141 |
|
Inventory Turnover Period |
132 |
33 |
88 |
201 |
|
SOLVENCY RATIOS |
|
|
|
|
|
Payback Capacity |
0,04 |
0,02 |
0,06 |
0,15 |
|
Assets Guarantee |
1,10 |
1,22 |
1,51 |
2,33 |
|
Short Term Debts Proportion (%) |
100,00 |
58,38 |
88,04 |
100,00 |
|
Interest Coverage |
6,96 |
-0,08 |
1,32 |
4,63 |
|
LIQUIDITY RATIOS |
|
|
|
|
|
Current Ratio |
1,07 |
1,12 |
1,43 |
2,29 |
|
Immediate liquidity |
0,03 |
0,04 |
0,15 |
0,39 |
|
Sales on Current Assets |
708 |
371 |
558 |
877 |
Results Analysis
Ratios
|
|
COMPANY (2006) |
PTILE25 |
PTILE50 |
PTILE75 |
|
Economic profitability (%) |
3,67 |
0,74 |
3,41 |
7,10 |
|
Operating Profitability (%) |
1,91 |
0,78 |
3,24 |
5,98 |
|
Equity gearing |
12,42 |
1,01 |
1,72 |
3,40 |
|
Financial profitability (%) |
32,38 |
0,80 |
4,74 |
12,23 |
|
General Profitability (%) |
1,47 |
0,22 |
1,32 |
3,12 |
NOTES
The information include in your enquiry is
correct.
FOREIGN EXCHANGE
RATES
|
Currency |
Unit
|
Indian Rupees |
|
US Dollar |
1 |
Rs.42.72 |
|
UK Pound |
1 |
Rs.84.42 |
|
Euro |
1 |
Rs.67.38 |
RATING
EXPLANATIONS
|
RATING |
STATUS |
PROPOSED CREDIT LINE |
|
|
>86 |
Aaa |
Possesses an extremely sound financial base with the strongest
capability for timely payment of interest and principal sums |
Unlimited |
|
71-85 |
Aa |
Possesses adequate working capital. No caution needed for credit
transaction. It has above average (strong) capability for payment of interest
and principal sums |
Large |
|
56-70 |
A |
Financial & operational base are regarded healthy. General
unfavourable factors will not cause fatal effect. Satisfactory capability for
payment of interest and principal sums |
Fairly Large |
|
41-55 |
Ba |
Overall operation is considered normal. Capable to meet normal
commitments. |
Satisfactory |
|
26-40 |
B |
Unfavourable & favourable factors carry similar weight in credit
consideration. Capability to overcome financial difficulties seems
comparatively below average. |
Small |
|
11-25 |
Ca |
Adverse factors are apparent. Repayment of interest and principal sums
in default or expected to be in default upon maturity |
Limited with
full security |
|
<10 |
C |
Absolute credit risk exists. Caution needed to be exercised |
Credit not
recommended |
|
NR |
In view of the lack of information, we have no basis upon which to
recommend credit dealings |
No Rating |
|
This score serves as a reference to assess SC’s credit risk
and to set the amount of credit to be extended. It is calculated from a composite
of weighted scores obtained from each of the major sections of this report. The
assessed factors and their relative weights (as indicated through %) are as
follows:
Financial
condition (40%) Ownership
background (20%) Payment
record (10%)
Credit history
(10%) Market trend
(10%) Operational
size (10%)