![]()
MIRA INFORM REPORT
|
Report Date : |
23.07.2008 |
IDENTIFICATION
DETAILS
|
Name : |
CASTILLA TEXTIL 2 SL |
|
|
|
|
Registered Office : |
Carretera Navahermosa-Quintanar(Km
90.200), Cp 45780, Tembleque Toledo |
|
|
|
|
Country : |
Spain |
|
|
|
|
Financials (as on) : |
31.12.2006 |
|
|
|
|
Date of Incorporation : |
06.06.1991 |
|
|
|
|
Legal Form : |
Limited Liability Company |
|
|
|
|
Line of Business : |
RATING &
COMMENTS
|
MIRA’s Rating : |
Ba |
|
RATING |
STATUS |
PROPOSED CREDIT LINE |
|
|
41-55 |
Ba |
Overall operation is considered normal. Capable to meet normal
commitments. |
Satisfactory |
|
Maximum Credit Limit : |
200.137,03 € |
|
|
|
|
Status : |
Satisfactory |
|
|
|
|
Payment Behaviour : |
Regular |
|
|
|
|
Litigation : |
Clear |
Name
CASTILLA TEXTIL 2 SL
Tax Number: B45258357
EXECUTIVE SUMMARY
Identification
Current Business Name: CASTILLA TEXTIL 2 SL
Other names: YES
Current Address: CARRETERA NAVAHERMOSA-QUINTANAR(KM
90.200), CP 45780, TEMBLEQUE TOLEDO
Branches: 1
Telephone number: 925145276 Fax: 925145240
URL: www.castillatextil.com Corporate
e-mail: ctextil@castillatextil.com
Commercial Risk
Credit Appraisal: 200.137,03 €
RAI: NO
Legal
Actions: NO
Financial Information
Latest Balance sheet sales (2006): 21.125.955,08 € (MERCANTILE REGISTER)
Result: 216.910,48 €
Total Assets: 21.608.947,46 €
Social Capital: 811.350,00 €
Employees: 185
Commercial Information
Constitution Date: 06/06/1991
Business activity: Textile
industry
NACE Code: 1754
International Operations: Imports and
Exports
Corporate Structure
Administrator:
Other Complementary Information
Latest proceeding published in BORME: 02/10/2007 Registration
of accounts
Bank Entities: Yes
The date when this report was last updated is 22/07/2008.
Credit Appraisal
Maximum Credit (from 0 a 6,000,000 €):
200.137,03 €
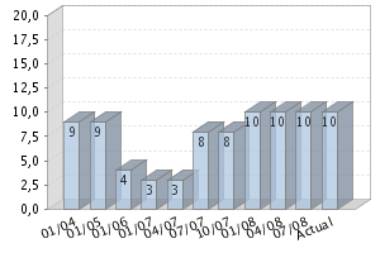
Rating Evolution
Financial Situation
Fiscal year2006
|
Treasury |
Restrained |
|
Indebtedness |
Important |
|
Profitability |
Average |
|
Balance |
Degraded |
Performance
|
Legal Actions |
None or Negligible |
|
Business
Trajectory |
Excellent |
RAI 
COMPANY NOT REGISTERED IN THE R.A.I.
This company is not registered in the Disputed Bills register (R.A.I.)
DATE AND TIME OF THE CONSULTATION: 22/07/2008
08:07:35
INCIDENTS

Summary
LEGAL ACTIONS: No legal incidences registered
CLAIM FILED AGAINST THE ADMINISTRATION: No administrative
claims registered
AFFECTED BY: No significant element.
FINANCIAL ELEMENTS AND SECTORIAL
COMPARATIVE
FINANCIAL ELEMENTS
Figures given in €
|
|
2004 (12) |
2005 (12) |
2006 (12) |
% ASSETS |
|
|
BALANCE SHEET ANALYSIS |
|
|
|
|
|
|
OWN FUNDS |
2.142.117,19 |
2.262.022,34 |
2.559.646,88 |
11,85 |
|
|
DEBT |
18.443.105,31 |
18.725.079,68 |
19.049.300,58 |
88,15 |
|
|
FIXED ASSETS |
6.889.904,66 |
5.657.345,13 |
5.028.652,59 |
23,27 |
|
|
TOTAL ASSETS |
20.585.222,50 |
20.987.102,02 |
21.608.947,46 |
|
|
|
|
|
|
|
|
|
|
|
2004 (12) |
2005 (12) |
2006 (12) |
% SALES |
|
|
PROFIT AND LOSS ACCOUNT ANALYSIS |
|
|
|
|
|
|
SALES |
19.231.293,52 |
19.104.854,23 |
21.125.955,08 |
|
|
|
ADDED VALUE |
5.071.714,89 |
5.225.403,56 |
5.290.106,60 |
25,04 |
|
|
EBITDA |
2.126.168,22 |
2.184.024,86 |
2.397.747,93 |
11,35 |
|
|
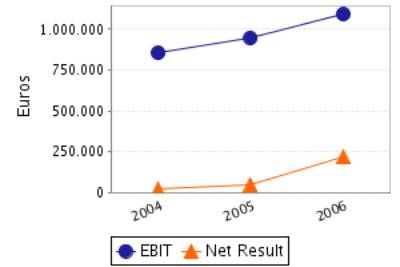
EBIT |
856.231,75 |
947.370,11 |
1.092.508,44 |
5,17 |
|
|
NET RESULT |
20.090,44 |
45.699,88 |
216.910,48 |
1,03 |
|
Balance Sheets Items Analysis


Balance Sheet Comments
Total assets of the company grew 1,95% between 2004 and 2005.
In spite of the assets’ growth, the fixed assets decreased 17,89%.
This growth has been financed, on a wider scale, with a Shareholders’
equity increase of 5,60% and in a smaller proportion with an debt increase of
1,53%.
Total assets of the company grew 2,96% between 2005 and 2006.
In spite of the assets’ growth, the fixed assets decreased 11,11%.
This growth has been financed, on a wider scale, with a Shareholders’
equity increase of 13,16% and in a smaller proportion with an debt increase of
1,73%.
Profit and Loss Account Analysis

Profit and Loss Account Comments
The company’s sales figure decreased in 0,66% between 2004 and 2005.
The company’s EBIT grew 10,64% between 2004 and 2005.
This evolution implies an increase in the company’s operating profitability.
The result of these variations is an increase of the company’s Economic
Profitability of 8,53% in the analysed period, being this profitability of
4,51% in the year 2005.
The company’s Net Result grew 127,47% between 2004 and 2005.
This evolution, compared to the EBIT’s performance, implies that the
financial and extraordinary activities have had a positive effect in the
company’s Financial Profitability.
The result of these variations is an increase of the company’s Economic
Profitability of 115,41% in the analysed period, being equal to 2,02% in the
year 2005.
The company’s sales figure grew 10,58% between 2005 and 2006.
The company’s EBIT grew 15,32% between 2005 and 2006.
This evolution implies an increase in the company’s operating
profitability.
The result of these variations is an increase of the company’s Economic
Profitability of 12,00% in the analysed period, being this profitability of
5,06% in the year 2006.
The company’s Net Result grew 374,64% between 2005 and 2006.
This evolution, compared to the EBIT’s performance, implies that the
financial and extraordinary activities have had a positive effect in the
company’s Financial Profitability.
The result of these variations is an increase of the company’s Economic
Profitability of 319,45% in the analysed period, being equal to 8,47% in the
year 2006.
ANNUAL FINANCIAL REPORT
ADDITIONAL DATA
Source: annual financial report 2006
Results Distribution
Figures given in €
|
DISTRIBUTION
BASE |
DISTRIBUTION TO |
||
|
Profit and Loss |
216.910,48 |
Retained earnings |
21.691,05 |
|
Carry Over |
0,00 |
Voluntary Reserve |
195.219,43 |
|
Voluntary reserves |
0,00 |
Prior years losses |
0,00 |
|
Reserves |
0,00 |
Carry Over |
0,00 |
|
Other concepts |
0,00 |
Other funds |
0,00 |
|
Total of Amounts to be distributed |
216.910,48 |
Dividends |
0,00 |
|
|
|
Other Applications |
0,00 |
Auditing
Auditors’ opinion: FAVOURABLE
Auditor: SANZ DE GARNICA JUAN IGNACIO
COMPARATIVE SECTOR ANALYSIS
Values table
Figures expressed in %
|
|
COMPANY (2006) |
SECTOR |
DIFFERENCE |
DIFFERENCE RELATIVE |
|
BALANCE SHEET ANALYSIS: % on the total
assets |
|
|
|
|
|
OWN FUNDS |
11,85 |
49,01 |
-37,16 |
-75,83 |
|
DEBT |
88,15 |
50,99 |
37,16 |
72,89 |
|
FIXED ASSETS |
23,27 |
35,25 |
-11,98 |
-33,98 |
|
|
|
|
|
|
|
|
COMPANY (2006) |
SECTOR |
DIFFERENCE |
DIFFERENCE RELATIVE |
|
PROFIT AND LOSS ACCOUNT ANALYSIS: % on the total
operating income |
|
|
|
|
|
SALES |
99,52 |
99,06 |
0,46 |
0,46 |
|
ADDED VALUE |
24,92 |
25,92 |
-1,00 |
-3,85 |
|
EBIT |
5,15 |
1,62 |
3,52 |
216,71 |
|
NET RESULT |
1,02 |
1,90 |
-0,88 |
-46,16 |
Sector Composition
Compared sector (NACE): 175
Number of companies: 16
Size (Sales Figure) : 7.000.000,00 - 40.000.000,00 Euros
Comments on the sectorial comparative
Compared to its sector the assets of the companies show an inferior
proportion of fixed assets. Specifically the difference with the sector average
is -11,98% , which means a relative difference of -33,98% .
In liabilities composition the company appeals on a wider scale to self
financing, being the proportion of net worth of 37,16% inferior, which means a
relative difference of 75,83% 37,16% more than the sector, which means a
difference of 72,89% .
The proportion that the sales mean to the company’s total ordinary
income is 99,52%, 0,46% higher than in the sector, which means a relative
difference of 0,46% .
The company’s EBIT was positive and was 5,15% with regard to the total
ordinary income, 3,52% higher than in the sector, which means a relative
difference of 216,71% .
The company’s capacity to generate operating income is higher than the
one of the sector as its ratio EBIT/Sales is higher (ES Company versus ES
Sector).
The company’s net result was positive and equal to 1,02% with regard to
the total ordinary income, 0,88% less than the sector, which means a relative
difference of 46,16% .
The financial and extraordinary results and the tax impact have had a
negative impact on the Net result in the company with a worse behaviour than in
the sector; as a consequence, the company shows a worse Net Result/EBIT ratio
(REBEmpresa vs. REBSector).
ADDRESSES
Current Legal Seat Address:
CARRETERA NAVAHERMOSA-QUINTANAR(KM 90.200)
45780 TEMBLEQUE TOLEDO
Previous Seat Address:
CARRETERA VILLACANAS - PARAJE LA FUENTECILLA, S/N
45780
TEMBLEQUE TOLEDO
Characteristics of the current
address
Type of premises: office, factory, warehouse
Property: owned; with no official confirmation
Local Situation: main
Branches 
|
STREET |
POSTAL CODE |
TOWN |
PROVINCE |
|
PROLONGACION LA FUENTECILLA. CR VILLACANAS S/N |
45780 |
TEMBLEQUE |
Toledo |
1 branches registered
CORPORATE STRUCTURE
ADMINISTRATIVE LINKS
Main Board members, Directors and Auditor ![]()
|
POSITION |
SURNAMES AND
NAME |
APPOINTMENT DATE |
|
|
ADMINISTRATOR |
VILLALOBOS CASTILLO JULIO |
31/01/1997 |
|
|
ADMINISTRATOR |
OTERO OTERO MILAGROS |
31/01/1997 |
|
|
AUDITOR |
APPOINTMENT DATE |
||
|
ESTEBAN INFANTES BENAYAS JULIO |
14/05/2007 |
||
|
SANZ GARNICA JUAN IGNACIO |
14/05/2007 |
||
Functional Managers
|
POSITION |
SURNAMES AND
NAME |
|
Financial Manager |
PANIAGUA JULIAN |
|
Human Resources Manager |
PANIAGUA JULIAN |
|
Commercial Manager |
VILLALOBOS DAVID |
FINANCIAL LINKS
|
|
BUSINESS NAME |
CIF / COUNTRY |
% |
SOURCE |
DATA INF. |
|
|
OTERO OTERO MILAGROS |
|
50,00 |
OWN SOURCES |
09/02/2004 |
|
|
VILLALOBOS DEL CASTILLO JULIO |
|
50,00 |
OWN SOURCES |
09/02/2004 |
CREDIT INFORMATION
Constitution Date: 06/06/1991
Business activity 
Code: 1437300
Activity: Textile industry
NACE Code: 1754
NACE Activity: Manufacture of other textiles n.e.c.
Business: FABRICACION Y COMERCIALIZACION PRODUCTOS TEXTILES, EN
ESPECIAL LENCERIAY DECORACION DEL HOGAR
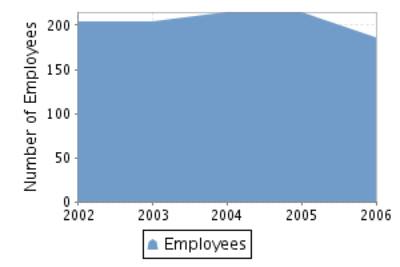
Employees 
Number of total employees: 185 (2006)
Number of fixed employees: 100,00%
Number of temporary employees: 0,00%
Employees evolution
COMMERCIAL OPERATIONS 
SALES
Collection (estimated):
Export Percentage: 41%
Exports to: Portugal, Grecia, Francia, Suecia, Inglaterra
CLIENTS
|
BUSINESS NAME |
INTERNATIONAL |
|
CASTILLA TEXTIL
SA |
NO |
1 clientes
Banks 
|
ENTITY |
BRANCH |
ADDRESS |
TOWN OR CITY |
PROVINCE |
|
CAJA DE AHORROS DE CASTILLA-LA MANCHA |
|
|
TOLEDO |
|
1 bank entities registered
Brands, Signs and Commercial
Names 
Brand name: NOVA PLUMA (Valid)
Type: JOINT Date: 12/07/2005
Brand name: B CASA BASIC (Valid)
Type: JOINT Date: 19/11/2004
Brand name: C CASTILLA COTTON (Valid)
Type: JOINT Date: 24/03/2004
Brand name: CASTILLA TEXTIL (Valid)
Type: JOINT Date: 18/06/1998
Brand name: AZALEA ROPA DE CAMA (Valid)
Type: JOINT Date: 15/04/1996
LEGAL STRUCTURE
Constitution Data
Register Date: 06/06/1991
Register town: Toledo
Announcement number: 180571
Legal form: LIMITED LIABILITY COMPANY
Social Capital: 420.708,47 €
Current structure data 
Current Legal Form: LIMITED LIABILITY COMPANY
Current Capital: 811.350,00 €
Legal Aspects
Obligation to fill in Financial Statements: YES
Chamber census: YES (2006)
Listed on a Stock Exchange: NO
B.O.R.M.E.(Official Companies
Registry Gazette) 
Registered Proceedings
|
PROCEEDINGS |
DATE |
NOTICE NUM. |
TRADE REG. |
|
Re-elections |
14/05/2007 |
262782 |
Toledo |
|
Re-elections |
14/05/2007 |
262781 |
Toledo |
Other Proceedings published
|
PROCEEDINGS |
DATE |
NOTICE NUM. |
TRADE REG. |
|
Registration of accounts (2006) Individual |
02/10/2007 |
714607 |
Toledo |
|
Registration of accounts (2005) Individual |
14/05/2007 |
176112 |
Toledo |
|
Registration of accounts (2004) Individual |
06/10/2005 |
678587 |
Toledo |
FINANCIAL INFORMATION
The information on the last account contained in this report is extracted
from the Mercantile Register file of the legal address of the Company and
dated 10/10/2007.
BALANCE SHEET
Assets
Figures given in €
|
|
31/12/2004 (12) |
31/12/2005 (12) |
31/12/2006 (12) |
|
A) DUE FROM SHAREHOLDERS FOR UNCALLED CAPITAL |
|
|
|
|
B) FIXED ASSETS |
6.889.904,66 |
5.657.345,13 |
5.028.652,59 |
|
I. Incorporation costs |
|
|
|
|
II. Intangible fixed assets |
70.758,87 |
80.261,28 |
70.437,47 |
|
R & D expenses |
|
|
|
|
Concessions, patents, licences , trademarks |
17.980,48 |
19.877,72 |
20.097,72 |
|
Goodwill |
|
|
|
|
Acquired rights from finance leases |
|
|
|
|
Software |
104.759,61 |
104.759,61 |
104.759,61 |
|
Leasing |
|
20.500,00 |
25.091,65 |
|
Cash advance |
|
|
|
|
Provisions |
|
|
|
|
Depreciation |
-51.981,22 |
-64.876,05 |
-79.511,51 |
|
III. Tangible fixed assets |
6.817.159,86 |
5.574.950,31 |
4.956.081,58 |
|
Property, plant and equipment |
2.757.308,95 |
2.577.005,32 |
2.577.005,32 |
|
Machinery, equipment and other |
4.515.892,34 |
4.399.193,20 |
4.399.289,20 |
|
Other property plant and equipment |
3.548.555,45 |
3.334.146,42 |
2.962.926,34 |
|
Prepaid expenses on fixed assets |
|
|
|
|
Other assets |
1.123.723,34 |
1.025.237,21 |
1.141.033,88 |
|
Provisions |
|
|
|
|
Depreciation |
-5.128.320,22 |
-5.760.631,84 |
-6.124.173,16 |
|
IV. Financial fixed assets |
1.985,93 |
2.133,54 |
2.133,54 |
|
Shares in affiliated companies |
|
|
|
|
Receivables in affiliated companies |
|
|
|
|
Shares in associated companies |
|
|
|
|
Loans to associated companies |
|
|
|
|
Securities |
|
|
|
|
Other loans |
|
|
|
|
Long term deposits and guarantees |
1.985,93 |
2.133,54 |
2.133,54 |
|
Provisions |
|
|
|
|
Taxes receivable |
|
|
|
|
V.Owners equity |
|
|
|
|
VI.Long term trade liabilities |
|
|
|
|
C) DEFERRED EXPENSES |
|
2.423,84 |
3.180,88 |
|
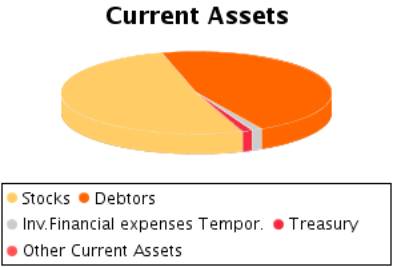
D) CURRENT ASSETS |
13.695.317,84 |
15.327.333,05 |
16.577.113,99 |
|
I. Shareholders by required outlays |
|
|
|
|
II. Stocks |
6.082.798,62 |
7.188.989,07 |
8.527.194,70 |
|
Goods available for sale |
21.636,45 |
|
|
|
Raw material inventory |
4.714.112,30 |
5.511.079,57 |
6.632.963,09 |
|
Work in Progress |
136.869,78 |
69.386,98 |
62.305,14 |
|
Finished goods |
1.210.180,09 |
1.608.522,52 |
1.831.926,47 |
|
Subproducts and recycled materials |
|
|
|
|
Cash advance |
|
|
|
|
Provisions |
|
|
|
|
III. Debtors |
6.783.544,18 |
7.695.168,89 |
7.651.829,70 |
|
Clients |
3.811.552,17 |
4.294.017,75 |
4.789.898,54 |
|
Amounts owned by affiliated companies |
|
|
|
|
Amounts owned by associated companies |
|
|
|
|
Other debts |
3.166.189,74 |
3.583.693,85 |
3.152.350,82 |
|
Staff Expenses |
|
|
|
|
Government |
55.594,89 |
67.249,91 |
114.023,97 |
|
Provisions |
-249.792,62 |
-249.792,62 |
-404.443,63 |
|
IV. Temporary financial investment |
627.761,09 |
416.214,36 |
204.667,63 |
|
Shares in affiliated companies |
|
|
|
|
Receivables in affiliated companies |
|
|
|
|
Shares in associated companies |
|
|
|
|
Loans to associated companies |
|
|
|
|
Short term investment |
|
|
|
|
Other loans |
627.761,09 |
416.214,36 |
204.667,63 |
|
Short Term Deposit and guarantees |
|
|
|
|
Provisions |
|
|
|
|
V. Short-term own shares |
|
|
|
|
VI. Treasury |
201.213,95 |
26.960,73 |
193.421,96 |
|
VII. Periodification adjustments |
|
|
|
|
ASSETS (A + B + C + D) |
20.585.222,50 |
20.987.102,02 |
21.608.947,46 |
Assets composition

Liabilities
Figures given in €
|
|
31/12/2004 (12) |
31/12/2005 (12) |
31/12/2006 (12) |
|
A) SHAREHOLDERS EQUITY |
1.947.650,85 |
1.993.350,73 |
2.210.261,21 |
|
I. Share capital |
811.350,00 |
811.350,00 |
811.350,00 |
|
II. Issue bonus |
|
|
|
|
III.Revaluation reserve |
|
|
|
|
IV.Reserves |
1.116.210,41 |
1.136.300,85 |
1.182.000,73 |
|
Retained earnings |
116.755,44 |
118.764,48 |
123.334,48 |
|
Sinking fund from owner equity |
|
|
|
|
Reserve for the parent company capital |
|
|
|
|
Statutory reserve |
|
|
|
|
Other funds |
999.454,97 |
1.017.536,37 |
1.058.666,25 |
|
Capital adjustments in Euros |
|
|
|
|
V.Results from previous years |
|
|
|
|
Carry Over |
|
|
|
|
Prior years losses |
|
|
|
|
Loans from partners for losses compensation |
|
|
|
|
VI.Profit and Losses |
20.090,44 |
45.699,88 |
216.910,48 |
|
VII.Dividend paid during the year |
|
|
|
|
VIII.Own shares for capital reduction |
|
|
|
|
B) DEFERRED INCOME |
194.466,34 |
268.671,61 |
349.385,67 |
|
Capital grants |
194.466,34 |
268.671,61 |
349.385,67 |
|
Positive change difference |
|
|
|
|
Other deferred income |
|
|
|
|
Fiscal deferred income |
|
|
|
|
C) PROVISIONS FOR LIABILITIES AND EXPENSES |
|
|
|
|
Provision for pensions plans |
|
|
|
|
Provision for taxes |
|
|
|
|
Other provisions |
|
|
|
|
Reversion fund |
|
|
|
|
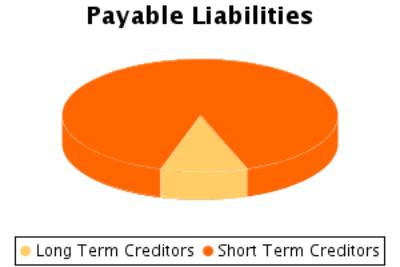
D) LONG TERM LIABILITIES |
2.631.935,56 |
2.516.195,04 |
1.944.989,62 |
|
I.Negotiable bonds and other negotiable values |
|
|
|
|
Non convertible securities |
|
|
|
|
Convertible securities |
|
|
|
|
Other convertible debentures |
|
|
|
|
II.Debt with bank entities |
2.631.935,56 |
2.500.912,48 |
1.927.357,41 |
|
Long term bank loans |
2.631.935,56 |
2.500.912,48 |
1.927.357,41 |
|
Leasing |
|
|
|
|
III.Debts with associated and affiliated companies |
|
|
|
|
With affiliated companies |
|
|
|
|
Associated companies |
|
|
|
|
IV. Other creditors |
|
15.282,56 |
17.632,21 |
|
Bills payable |
|
|
|
|
Other debts |
|
15.282,56 |
17.632,21 |
|
Long term deposit and guaranties |
|
|
|
|
Taxes receivable |
|
|
|
|
V. Deferred debts on shares |
|
|
|
|
From affiliated companies |
|
|
|
|
From associated companies |
|
|
|
|
Other companies |
|
|
|
|
VI. Long term debt with creditor |
|
|
|
|
E) SHORT TERM LIABILITIES |
15.811.169,75 |
16.208.884,64 |
17.104.310,96 |
|
I.Negotiable bonds and other negotiable values |
|
|
|
|
Non convertible securities |
|
|
|
|
Convertible securities |
|
|
|
|
Other convertible debentures |
|
|
|
|
Interests from bonds |
|
|
|
|
II.Debt with bank entities |
8.825.494,28 |
9.813.535,34 |
10.709.514,05 |
|
Loans and other debts |
8.825.494,28 |
9.813.535,34 |
10.709.514,05 |
|
Debt interest |
|
|
|
|
Leasing |
|
|
|
|
III. Short term debts with associated and
affiliated companies |
|
|
|
|
With affiliated companies |
|
|
|
|
Associated companies |
|
|
|
|
IV. Commercial creditors |
6.453.130,93 |
4.882.923,61 |
5.537.323,86 |
|
Accounts payable |
|
|
|
|
Expenses |
6.453.130,93 |
4.882.923,61 |
5.537.323,86 |
|
Bills payable |
|
|
|
|
V. Other non-commercial debt |
532.544,54 |
1.512.425,69 |
857.473,05 |
|
Government |
193.368,72 |
200.192,90 |
217.296,53 |
|
Bills payable |
|
|
|
|
Other debts |
110.671,54 |
1.095.457,19 |
414.596,57 |
|
Accounts receivable |
228.504,28 |
216.775,60 |
225.579,95 |
|
Short term deposits and guarantees |
|
|
|
|
VI. Provisions for current assets |
|
|
|
|
VII. Periodification adjustments |
|
|
|
|
F) SHORT TERM PROVISIONS FOR LIABILITIES AND
EXPENSES |
|
|
|
|
LIABILITIES (A + B + C + D + E + F) |
20.585.222,50 |
20.987.102,02 |
21.608.947,46 |
Liabilities Composition


PROFIT AND LOSS ACCOUNT
Itams of the Profit and Loss Account
Figures given in €
|
|
31/12/2004 (12) |
31/12/2005 (12) |
31/12/2006 (12) |
|
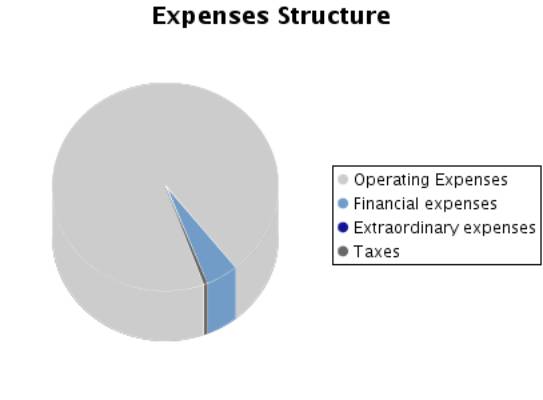
A) EXPENSES (A.1 a A.16) |
19.972.539,66 |
19.673.277,60 |
21.447.419,55 |
|
A.1.Reduction in stocks of finished goods and
work in progress |
|
|
|
|
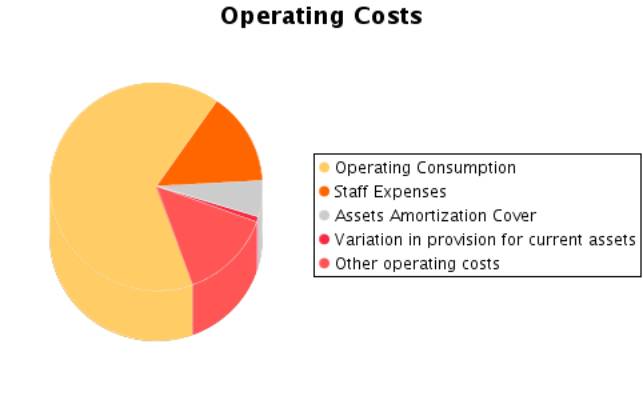
A.2.Supplies |
11.952.411,37 |
11.742.382,77 |
13.349.480,25 |
|
Material consumed |
710.337,66 |
2.012.027,26 |
2.585.358,76 |
|
Raw materials consumed |
6.951.357,36 |
6.544.764,11 |
6.507.921,12 |
|
Other expenses |
4.290.716,35 |
3.185.591,40 |
4.256.200,37 |
|
A.3. Labour cost |
2.945.546,67 |
3.041.378,70 |
2.892.358,67 |
|
Wages |
2.259.370,83 |
2.351.434,23 |
2.242.187,21 |
|
Social security expenses |
686.175,84 |
689.944,47 |
650.171,46 |
|
A.4. Assets depreciation |
1.269.936,47 |
1.236.654,75 |
1.150.588,48 |
|
A.5.Variance in the traffic provisions |
|
|
154.651,01 |
|
Variance in provision for inventory |
|
|
|
|
Variance in provision for bad debts |
|
|
154.651,01 |
|
Variance in provision for other current assets |
|
|
|
|
A.6. Other operating costs |
2.803.554,12 |
2.573.190,24 |
2.804.981,17 |
|
External costs |
2.761.022,17 |
2.551.696,71 |
2.804.981,17 |
|
Taxes |
42.531,95 |
21.493,53 |
|
|
Other day to day expenses |
|
|
|
|
Allowance to reversion fund |
|
|
|
|
A.I.OPERATING RESULT (B.1+B.2+B.3+B.4-A.1-A.2-A.3-A.4-A.5-A.6) |
856.231,75 |
947.370,11 |
1.092.508,44 |
|
A.7.Financial expenses and similar |
704.874,89 |
826.359,79 |
854.443,89 |
|
Debts with related companies |
|
|
|
|
Debts with associated companies |
|
|
|
|
Other companies debts By debts with third parties and similar expenses |
493.328,16 |
614.813,06 |
854.443,89 |
|
Losses from financial investments |
211.546,73 |
211.546,73 |
|
|
A.8. Variation in financial investment provision |
|
31.824,05 |
|
|
A.9.Negative exchange difference |
83.529,14 |
|
120.004,27 |
|
A.II.POSITIVE FINANCIAL RESULTS
(B.5+B.6+B.7+B.8-A.7-A.8-A.9) |
|
|
|
|
A.III.PROFIT FROM ORDINARY ACTIVITIES
(A.I+A.II-B.I-B.II) |
72.488,63 |
169.197,51 |
177.707,06 |
|
A.10. Variation in provision in fixed assets |
|
|
|
|
A.11. Losses in fixed assets |
87.888,90 |
53.027,26 |
|
|
A.12. Losses from own shares and bonds |
|
|
|
|
A.13. Extraordinary charges |
70,40 |
29.942,64 |
4.113,86 |
|
A.14.Other exercises’ expenses and losses |
|
|
|
|
A.IV.POSITIVE EXTRAORDINARY RESULT
(B.9+B.10+B.11+B.12+B.13-A.10-A.11-A.12-A.13-A.14) |
72.329,51 |
15.019,77 |
156.001,37 |
|
A.V.PROFIT BEFORE TAXES (A.III+A.IV-B.III-B.IV) |
144.818,14 |
184.217,28 |
333.708,43 |
|
A.15.Corporate Taxes |
124.727,70 |
138.517,40 |
116.797,95 |
|
A.16. Other taxes |
|
|
|
|
A.VI.EXERCISE RESULT (PROFIT) (A.V-A.14-A.15) |
20.090,44 |
45.699,88 |
216.910,48 |
|
B) INCOMES (B.1 a B13) |
19.992.630,10 |
19.718.977,48 |
21.664.330,03 |
|
B.1. Turnover |
19.231.293,52 |
19.104.854,23 |
21.125.955,08 |
|
Sales |
19.752.771,44 |
19.777.614,94 |
21.810.790,43 |
|
Services provided |
|
|
|
|
Refunds and sale reminders |
-521.477,92 |
-672.760,71 |
-684.835,35 |
|
B.2.Increase in inventory of finished goods and
works in progress |
468.167,48 |
330.859,63 |
216.322,11 |
|
B.3.Expenses capitalized |
|
|
|
|
B.4. Other operating income |
128.219,38 |
105.262,71 |
102.290,83 |
|
Other incomes |
|
1.548,16 |
78.577,75 |
|
Grants |
128.219,38 |
103.714,55 |
23.713,08 |
|
Excess in provision for liabilities and charges |
|
|
|
|
B.I.OPERATING LOSSES
(A.1+A.2+A.3+A.4+A.5+A.6-B.1-B.2-B.3-B.4) |
|
|
|
|
B.5.Incomes from share participations |
|
|
|
|
From affiliated companies |
|
|
|
|
From associated companies |
|
|
|
|
From other companies |
|
|
|
|
B.6.Income from other securities and credits to
fixed assets |
|
|
|
|
From affiliated companies |
|
|
|
|
From associated companies |
|
|
|
|
Other companies |
|
|
|
|
B.7.Other interests and similar |
2.513,69 |
4.797,49 |
979,12 |
|
From affiliated companies |
|
|
|
|
From associated companies |
|
|
|
|
Other Interests |
2.513,69 |
4.797,49 |
979,12 |
|
Profits from investments |
|
|
|
|
B.8. Positive change difference |
2.147,22 |
75.213,75 |
58.667,66 |
|
B.II. NEGATIVE FINANCIAL RESULTS
(A.7+A.8+A.9-B.5-B.6-B.7-B.8) |
783.743,12 |
778.172,60 |
914.801,38 |
|
B.III.LOSSES FROM ORDINARY ACTIVITIES
(B.I+B.II-A.I-A.II) |
|
|
|
|
B.9.B.9. Gains from disposal of fixed assets |
|
|
4.469,45 |
|
B.10.Gains from dealing in own shares |
|
|
|
|
B.11. Paid in surplus |
81.577,72 |
75.661,80 |
110.717,28 |
|
B.12. Extraordinary income |
78.711,09 |
22.327,87 |
44.928,50 |
|
B.13.Other year’s income and profits |
|
|
|
|
B.IV.NEGATIVE EXTRAORDINARY LOSSES
(A.10+A.11+A.12+A.13+A.14-B.9-B.10-B.11-B.12-B.13) |
|
|
|
|
B.V.LOSS BEFORE TAXES (B.III+B.IV-A.III-A.IV) |
|
|
|
|
B.VI.EXERCISE RESULTS (LOSS) (B.V+A.14+A.15) |
|
|
|
Composition of the Profit and
Loss Account

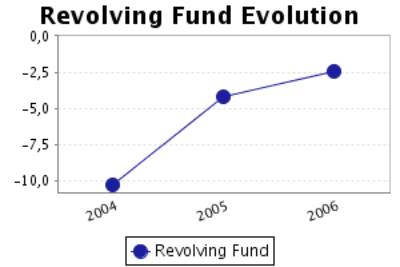
FINANCIAL BALANCE
Here the Main Capital Amounts of the company and the Revolving Fund
Evolution are analysed.
Financial Balance Table
Figures given in €
|
|
31/12/2004 (12) |
% |
31/12/2005 (12) |
% |
31/12/2006 (12) |
% |
|
A) DUE FROM SHAREHOLDERS FOR UNCALLED CAPITAL |
|
|
|
|
|
|
|
B) FIXED ASSETS |
6.889.904,66 |
33,47 |
5.657.345,13 |
26,96 |
5.028.652,59 |
23,27 |
|
C) DEFERRED EXPENSES |
|
|
2.423,84 |
0,01 |
3.180,88 |
0,01 |
|
D) CURRENT ASSETS |
13.695.317,84 |
66,53 |
15.327.333,05 |
73,03 |
16.577.113,99 |
76,71 |
|
ASSETS (A + B + C + D) |
20.585.222,50 |
|
20.987.102,02 |
|
21.608.947,46 |
|
|
|
||||||
|
A) SHAREHOLDERS EQUITY |
1.947.650,85 |
9,46 |
1.993.350,73 |
9,50 |
2.210.261,21 |
10,23 |
|
B) DEFERRED INCOME |
194.466,34 |
0,94 |
268.671,61 |
1,28 |
349.385,67 |
1,62 |
|
C) PROVISIONS FOR LIABILITIES AND EXPENSES |
|
|
|
|
|
|
|
D) LONG TERM LIABILITIES |
2.631.935,56 |
12,79 |
2.516.195,04 |
11,99 |
1.944.989,62 |
9,00 |
|
E) SHORT TERM LIABILITIES |
15.811.169,75 |
76,81 |
16.208.884,64 |
77,23 |
17.104.310,96 |
79,15 |
|
F) SHORT TERM PROVISIONS FOR LIABILITIES AND EXPENSES |
|
|
|
|
|
|
|
LIABILITIES (A + B + C + D + E + F) |
20.585.222,50 |
|
20.987.102,02 |
|
21.608.947,46 |
|
Financial Balance Composition

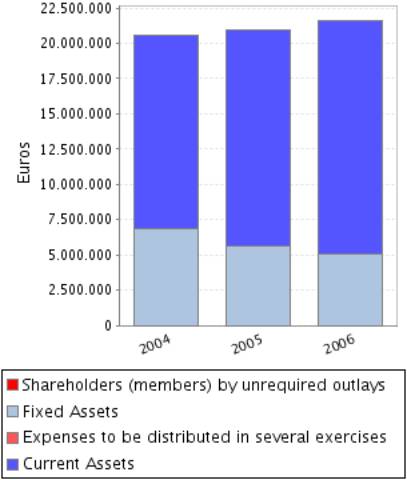
Comments on Financial Balance
In the 2004, the assets of the company were formed in 33,47% of Fixed
Assets and in 66,53% of Current Assets. This assets were financed in 10,41%
with own capitals, and in 12,79% with long term debt and in 76,81% with current
liabilities.
The result of this financial structure is a negative turnover fund of
-2.115.851,91 Euros, which is equivalent to -10,28% proportion of the company’s
total assets.
In the 2005, the assets of the company were formed in 26,97% of Fixed
Assets and in 73,03% of Current Assets. This assets were financed in 10,78%
with own capitals, and in 11,99% with long term debt and in 77,23% with current
liabilities.
The result of this financial structure is a negative turnover fund of
-881.551,59 Euros, which is equivalent to -4,20% proportion of the company’s
total assets.
This measure has increased with respect to the previous exercise in
58,34% having also increased its proportion with respect to the total assets of
the company.
In the 2006, the assets of the company were formed in 23,29% of Fixed
Assets and in 76,71% of Current Assets. This assets were financed in 11,85%
with own capitals, and in 9,00% with long term debt and in 79,15% with current
liabilities.
The result of this financial structure is a negative turnover fund of
-527.196,97 Euros, which is equivalent to -2,44% proportion of the company’s
total assets.
This measure has increased with respect to the previous exercise in
40,20% having also increased its proportion with respect to the total assets of
the company.
RATIOS
Main Ratios
|
|
31/12/2004 (12) |
31/12/2005 (12) |
31/12/2006 (12) |
|
STRUCTURAL RATIOS |
|
|
|
|
Management fund |
-2.115.851,91 |
-881.551,59 |
-527.196,97 |
|
Management Fund Requirement |
5.880.667,33 |
8.488.808,66 |
9.784.227,49 |
|
Indebtedness (%) |
89,59 |
89,22 |
88,16 |
|
External Funds on Net Worth |
8,61 |
8,28 |
7,44 |
|
GENERAL ACTIVITY RATIO |
|
|
|
|
Turnover Increase (%) |
-10,76 |
-0,66 |
10,58 |
|
Added value growth (%) |
5,41 |
3,03 |
1,24 |
|
Cash Flow |
1.290.026,91 |
1.314.178,68 |
1.522.149,97 |
|
Labour Productivity |
1,72 |
1,72 |
1,83 |
|
Assets turnover |
0,93 |
0,91 |
0,98 |
|
Breakdown Point |
17.254.666,76 |
16.876.479,48 |
18.363.293,92 |
|
Security Margin of the Breakdown Point (%) |
10,87 |
12,15 |
13,50 |
|
ACTIVITY RATIOS |
|
|
|
|
Average Payment Period |
202 |
154 |
152 |
|
Average Collection Period |
127 |
145 |
130 |
|
Inventory Turnover Period |
114 |
135 |
145 |
|
SOLVENCY RATIOS |
|
|
|
|
Payback Capacity |
0,07 |
0,07 |
0,08 |
|
Assets Guarantee |
1,12 |
1,12 |
1,13 |
|
Short Term Debts Proportion (%) |
85,73 |
86,56 |
89,79 |
|
Interest Coverage |
1,33 |
1,26 |
1,27 |
|
LIQUIDITY RATIOS |
|
|
|
|
Current Ratio |
0,87 |
0,95 |
0,97 |
|
Immediate liquidity |
0,05 |
0,03 |
0,02 |
|
Treasury |
-7.996.519,24 |
-9.370.360,25 |
-10.311.424,46 |
|
Sales on Current Assets |
506 |
449 |
459 |
Results Analysis Ratios
|
|
31/12/2004 (12) |
31/12/2005 (12) |
31/12/2006 (12) |
|
Economic profitability (%) |
4,16 |
4,51 |
5,06 |
|
Operating Profitability (%) |
4,45 |
4,96 |
5,17 |
|
Equity gearing |
0,81 |
1,66 |
1,37 |
|
Financial profitability (%) |
0,94 |
2,02 |
8,47 |
|
General Profitability (%) |
0,10 |
0,24 |
1,03 |
Comments on the Results Analysis
Ratios
The economic profitability in the year2005 achieved a 4,51% positive
level, due to a 4,96% economic margin and to an assets turnover of0,91%.
The economic profitability in the year has increased from 4,16% up to
4,51%. This growth is due to the economic margin increase, from 4,45% to the
current 4,96% in spite of the assets turnover drop, which have decreased from
0,93 to 0,91%.
Financial profitability on 2005 achieved a 2,02%.
The company’s financial structure has instigated its economic
profitability with an indebtedness level of 1,66.
The general profitability on 2005 achieved a 0,24%.
The economic profitability in the year2006 achieved a 5,06% positive
level, due to a 5,17% economic margin and to an assets turnover of0,98%.
The economic profitability in the year has increased from 4,51% up to
5,06%. This growth is due to the economic margin increase, from 4,96% to the
current 5,17Y%, and to the assets turnover index, which in the last period has
achieved 0,98, compared to 0,91 del 2005.
Financial profitability on 2006 achieved a 8,47%.
The company’s financial structure has instigated its economic
profitability with an indebtedness level of 1,37.
The general profitability on 2006 achieved a 1,03%.
SECTORIAL ANÁLYSIS
Large Capital Amounts and Financial Balance
Figures given in %
|
|
COMPANY (2006) |
SECTOR |
DIFFERENCE |
DIFFERENCE RELATIVE |
|
|
ASSETS |
|
|
|
|
|
|
A) DUE FROM SHAREHOLDERS FOR UNCALLED CAPITAL |
|
0,00 |
|
|
|
|
B) FIXED ASSETS |
23,27 |
35,25 |
-11,98 |
-33,99 |
|
|
C) DEFERRED EXPENSES |
0,01 |
1,05 |
-1,04 |
-99,05 |
|
|
D) CURRENT ASSETS |
76,71 |
63,70 |
13,01 |
20,43 |
|
|
ASSETS (A + B + C + D) |
100 |
100 |
|
|
|
|
|
|
|
|
|
|
|
|
COMPANY (2006) |
SECTOR |
DIFFERENCE |
DIFFERENCE RELATIVE |
|
|
LIABILITIES |
|
|
|
|
|
|
A) SHAREHOLDERS EQUITY |
10,23 |
48,69 |
-38,46 |
-78,99 |
|
|
B) DEFERRED INCOME |
1,62 |
0,32 |
1,30 |
401,55 |
|
|
C) PROVISIONS FOR LIABILITIES AND EXPENSES |
|
0,19 |
|
|
|
|
D) LONG TERM LIABILITIES |
9,00 |
14,78 |
-5,78 |
-39,10 |
|
|
E) SHORT TERM LIABILITIES |
79,15 |
35,91 |
43,24 |
120,43 |
|
|
F) SHORT TERM PROVISIONS FOR LIABILITIES AND EXPENSES |
|
0,11 |
|
|
|
|
LIABILITIES (A + B + C + D + E + F) |
100 |
100 |
|
|
|
Financial Balance Composition


Comments to the Sectorial
Analysis
In the 2006, the assets of the company were formed in 23,29% of fixed
assets and in 76,71Current Assets % In the sector, the proportion of fixed assets
was of 36,30%, 35,84% superior, and the proportion of current assets was of
63,70%, 20,43% inferior.
The assets were financed in the company in 11,85% with own capitals , in
9,00% with fixed liabilities and in 79,15% with current liabilities In the sector,
the self financing represented 49,01%, 75,82% superior. On the other hand the
long term debts represented in the sector an average of 14,97% financing, with
a relative difference of 39,88% favourable to the sectorAnd, short term
liabilities represented in the sector an average of 36,02% financing, with a
relative difference of 119,74% in favour of the company
The result of this company’s financial structure is a turnover fund that
represents -2,44% of the total assets; in the sector, this same proportion is
27,68%, therefore, we can say that the company’s turnover fund is 108,82%
smaller than the sector one.
Analytical Account of Results
Figures given in %
|
|
COMPANY (2006) |
SECTOR |
DIFFERENCE |
DIFFERENCE RELATIVE |
|
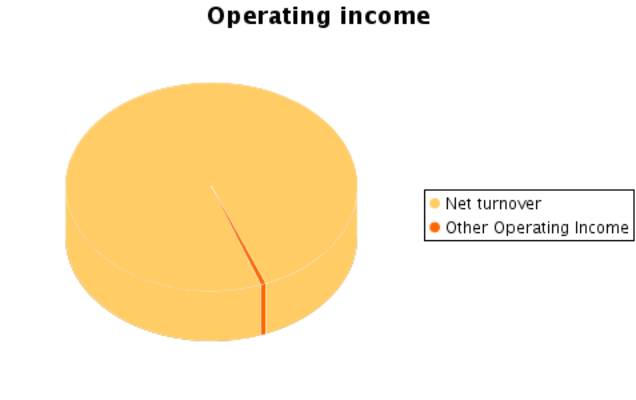
Turnover |
99,52 |
99,06 |
0,46 |
0,46 |
|
Other operating income |
0,48 |
0,94 |
-0,46 |
-48,94 |
|
Production Value |
100,00 |
100,00 |
0,00 |
0,00 |
|
Operating expenses |
61,87 |
53,40 |
8,47 |
15,86 |
|
Other operation expenses |
13,21 |
20,68 |
-7,47 |
-36,12 |
|
Added value |
24,92 |
25,92 |
-1,00 |
-3,85 |
|
Labour cost |
13,63 |
19,56 |
-5,93 |
-30,33 |
|
Gross Economic Result |
11,30 |
6,35 |
4,95 |
77,84 |
|
Assets depreciation |
5,42 |
4,70 |
0,72 |
15,37 |
|
Variation in provision for current assets and bad debt losses |
0,73 |
0,03 |
0,70 |
2.333,33 |
|
Net Economic Result |
5,15 |
1,62 |
3,53 |
216,92 |
|
Financial income |
0,28 |
0,50 |
-0,22 |
-44,33 |
|
Financial Charges |
4,59 |
1,14 |
3,45 |
302,99 |
|
Variation in financial investment provision |
|
-0,08 |
|
|
|
Ordinary Activities Result |
0,84 |
1,07 |
-0,23 |
-21,50 |
|
Extraordinary income |
0,75 |
2,45 |
-1,70 |
-69,44 |
|
Extraordinary charges |
0,02 |
0,60 |
-0,58 |
-96,67 |
|
Variation in provision in fixed assets |
|
0,00 |
|
|
|
Results before Taxes |
1,57 |
2,92 |
-1,35 |
-46,31 |
|
Corporate taxes |
0,55 |
1,03 |
-0,48 |
-46,39 |
|
Net Result |
1,02 |
1,90 |
-0,88 |
-46,26 |
|
Assets depreciation |
5,42 |
4,70 |
0,72 |
15,37 |
|
Change of Provisions |
0,73 |
-0,05 |
0,78 |
-1.560,00 |
|
Net Self-Financing |
7,17 |
6,55 |
0,62 |
9,53 |
Main Ratios
|
|
COMPANY (2006) |
PTILE25 |
PTILE50 |
PTILE75 |
|
STRUCTURAL RATIOS |
|
|
|
|
|
Management fund |
-527.196,97 |
1.256,41 |
3.005,58 |
3.997,78 |
|
Management Fund Requirement |
9.784.227,49 |
-3.396,42 |
1.184,74 |
2.033,96 |
|
Indebtedness (%) |
88,16 |
27,48 |
44,45 |
66,25 |
|
External Funds on Net Worth |
7,44 |
0,38 |
0,80 |
1,96 |
|
GENERAL ACTIVITY RATIO |
|
|
|
|
|
Turnover Increase (%) |
10,58 |
-13,37 |
-0,51 |
3,39 |
|
Added value growth (%) |
1,24 |
-19,32 |
-7,40 |
-0,77 |
|
Cash Flow |
1.522.149,97 |
386,81 |
762,90 |
987,53 |
|
Labour Productivity |
1,83 |
1,18 |
1,35 |
1,86 |
|
Assets turnover |
0,98 |
0,80 |
1,18 |
1,80 |
|
Breakdown Point |
18.363.293,92 |
6.662.046,24 |
9.403.307,67 |
16.666.910,70 |
|
Security Margin of the Breakdown Point (%) |
13,50 |
-0,48 |
6,69 |
15,56 |
|
ACTIVITY RATIOS |
|
|
|
|
|
Average Payment Period |
152 |
56 |
85 |
120 |
|
Average Collection Period |
130 |
77 |
117 |
143 |
|
Inventory Turnover Period |
145 |
32 |
62 |
90 |
|
SOLVENCY RATIOS |
|
|
|
|
|
Payback Capacity |
0,08 |
0,06 |
0,18 |
0,44 |
|
Assets Guarantee |
1,13 |
1,51 |
2,18 |
3,66 |
|
Short Term Debts Proportion (%) |
89,79 |
62,42 |
92,13 |
100,00 |
|
Interest Coverage |
1,27 |
2,07 |
5,58 |
59,76 |
|
LIQUIDITY RATIOS |
|
|
|
|
|
Current Ratio |
0,97 |
1,33 |
1,87 |
3,76 |
|
Immediate liquidity |
0,02 |
0,06 |
0,12 |
1,47 |
|
Treasury |
-10.311.424,46 |
-2.930,92 |
-248,59 |
1.312,36 |
|
Sales on Current Assets |
459 |
549 |
596 |
762 |
Results Analysis Ratios
|
|
COMPANY (2006) |
PTILE25 |
PTILE50 |
PTILE75 |
|
Economic profitability (%) |
5,06 |
-0,14 |
2,48 |
8,27 |
|
Operating Profitability (%) |
5,17 |
-0,16 |
2,65 |
6,98 |
|
Equity gearing |
1,37 |
1,35 |
1,66 |
2,84 |
|
Financial profitability (%) |
8,47 |
-0,03 |
2,64 |
10,46 |
|
General Profitability (%) |
1,03 |
-0,02 |
1,04 |
5,39 |
NOTES
ABOUT YOUR REQUEST:
The company name of the subject is CASTILLA TEXTIL 2 SL.
The subject’s correct address is Cr. Navahermosa-Quintanar, km
90,200 Tembleque, Toledo.
In spite of investigations using every source available (public and
private), no additional details than those contained in this report
are available. .
FOREIGN EXCHANGE
RATES
|
Currency |
Unit
|
Indian Rupees |
|
US Dollar |
1 |
Rs. 41.96 |
|
UK Pound |
1 |
Rs.83.78 |
|
Euro |
1 |
Rs.65.82 |
RATING
EXPLANATIONS
|
RATING |
STATUS |
PROPOSED CREDIT LINE |
|
|
>86 |
Aaa |
Possesses an extremely sound financial base with the strongest
capability for timely payment of interest and principal sums |
Unlimited |
|
71-85 |
Aa |
Possesses adequate working capital. No caution needed for credit
transaction. It has above average (strong) capability for payment of interest
and principal sums |
Large |
|
56-70 |
A |
Financial & operational base are regarded healthy. General
unfavourable factors will not cause fatal effect. Satisfactory capability for
payment of interest and principal sums |
Fairly Large |
|
41-55 |
Ba |
Overall operation is considered normal. Capable to meet normal
commitments. |
Satisfactory |
|
26-40 |
B |
Unfavourable & favourable factors carry similar weight in credit
consideration. Capability to overcome financial difficulties seems comparatively
below average. |
Small |
|
11-25 |
Ca |
Adverse factors are apparent. Repayment of interest and principal sums
in default or expected to be in default upon maturity |
Limited with
full security |
|
<10 |
C |
Absolute credit risk exists. Caution needed to be exercised |
Credit not
recommended |
|
NR |
In view of the lack of information, we have no basis upon which to
recommend credit dealings |
No Rating |
|
This score serves as a reference to assess SC’s credit risk
and to set the amount of credit to be extended. It is calculated from a
composite of weighted scores obtained from each of the major sections of this
report. The assessed factors and their relative weights (as indicated through
%) are as follows:
Financial
condition (40%) Ownership
background (20%) Payment
record (10%)
Credit history
(10%) Market trend
(10%) Operational
size (10%)