![]()
MIRA INFORM REPORT
|
Report Date : |
23.07.2008 |
IDENTIFICATION
DETAILS
|
Name : |
LEVANTINA Y ASOCIADOS DE MINERALES SOCIEDAD ANONIMA. |
|
|
|
|
Registered Office : |
Carretera Autovia 330, S/N - Apartado Correos 8, Cp 03660, Novelda Alicante |
|
|
|
|
Country : |
Spain |
|
|
|
|
Financials (as on) : |
31.12.2006 |
|
|
|
|
Date of Incorporation : |
|
|
|
|
|
Legal Form : |
Joint Stock Company |
|
|
|
|
Line of Business : |
RATING &
COMMENTS
|
MIRA’s Rating : |
A |
|
RATING |
STATUS |
PROPOSED CREDIT LINE |
|
|
56-70 |
A |
Financial & operational base are regarded healthy. General
unfavourable factors will not cause fatal effect. Satisfactory capability for
payment of interest and principal sums |
Fairly Large |
|
Maximum Credit Limit : |
3.591.648,34 € |
|
|
|
|
Status : |
Good |
|
|
|
|
Payment Behaviour : |
Regular |
|
|
|
|
Litigation : |
Clear |
Name
LEVANTINA Y ASOCIADOS DE MINERALES SOCIEDAD ANONIMA.
TAX NUMBER: A84433515
EXECUTIVE SUMMARY
Identification
Current Business
Name: LEVANTINA Y ASOCIADOS DE MINERALES SOCIEDAD ANONIMA.
Other names: YES
Current
Address: CARRETERA AUTOVIA
330, S/N - APARTADO CORREOS 8, CP 03660, NOVELDA ALICANTE
Branches: 1
Telephone
number: 965606861 Fax: 965606892
URL: www.levantina.com
Corporate e-mail: info@levantina.com
Commercial Risk
Credit Appraisal: 3.591.648,34 €
RAI: NO
Legal
Actions: NO
Financial Information
Latest sales known (2007): 309.089.610,00 € (Estimated)
Latest Balance sheet sales (2006): 300.087.000,00 € (MERCANTILE REGISTER)
Result: -3.101.000 €
Total Assets: 616.664.000 €
Social Capital: 10.676.651,80 €
Employees: 2.500
Commercial Information
Constitution Date: 16/08/2005
Business activity: Natural stone
industries
NACE Code: 2670
International Operations: Imports and
Exports
Corporate Structure
President:
Participations: 43
Other Complementary Information
Latest proceeding published in BORME: 18/07/2008 Change
of statutes
Latest press article: 11/07/2008 EXPANSION
DE VALENCIA (SOCIAL INFORMATION)
Bank Entities: Yes
Credit Appraisal
Maximum Credit (from 0 a 6,000,000 €):
3.591.648,34 €
Rating Evolution

Financial Situation
Fiscal year2006
|
Treasury |
Excellent |
|
Indebtedness |
Important |
|
Profitability |
Unfavourable |
|
Balance |
Very good |
Performance
|
Legal Actions |
None or
Negligible |
|
Business Trajectory |
Excellent |
RAI 
COMPANY NOT REGISTERED IN THE R.A.I.
This company is not registered in the Disputed Bills register (R.A.I.)
DATE AND TIME OF THE CONSULTATION: 22/07/2008
08:07:00
INCIDENTS

Summary
LEGAL ACTIONS: No legal incidences registered
CLAIM FILED AGAINST THE ADMINISTRATION: No administrative
claims registered
AFFECTED BY: No significant element.
FINANCIAL ELEMENTS AND SECTORIAL
COMPARATIVE
FINANCIAL ELEMENTS
Figures given in €
|
|
2005 (4) |
2006 (12) |
2007 |
|
|
BALANCE SHEET ANALYSIS |
|
|
|
|
|
OWN FUNDS |
60.120,00 |
66.897.000,00 |
|
|
|
DEBT |
|
549.767.000,00 |
|
|
|
FIXED ASSETS |
601,20 |
399.386.000,00 |
|
|
|
TOTAL ASSETS |
60.120,00 |
616.664.000,00 |
|
|
|
|
|
|
|
|
|
|
2005 (4) |
2006 (12) |
2007 |
|
|
PROFIT AND LOSS ACCOUNT ANALYSIS |
|
|
|
|
|
SALES |
|
300.087.000,00 |
309.089.610,00 |
|
|
ADDED VALUE |
|
99.854.000,00 |
|
|
|
EBITDA |
|
47.888.000,00 |
|
|
|
EBIT |
|
19.102.000,00 |
|
|
|
NET RESULT |
|
-3.101.000,00 |
|
|
ANNUAL FINANCIAL REPORT
ADDITIONAL DATA
Source: annual financial report 2006
Results Distribution
Figures given in €
|
DISTRIBUTION
BASE |
DISTRIBUTION TO |
||
|
Profit and Loss |
-3.100.827,48 |
Retained earnings |
0,00 |
|
Carry Over |
0,00 |
Voluntary Reserve |
0,00 |
|
Voluntary reserves |
0,00 |
Prior years losses |
-3.100.827,48 |
|
Reserves |
0,00 |
Carry Over |
0,00 |
|
Other concepts |
0,00 |
Other funds |
0,00 |
|
Total of Amounts to be distributed |
-3.100.827,48 |
Dividends |
0,00 |
|
|
|
Other Applications |
0,00 |
Auditing
Auditors’ opinion: FAVOURABLE WITH RESERVATIONS
Auditor: KPMG AUDITORES S.L.
Auditing exceptions:
COMO SE DETALLA EN LA NOTA 1 DE LA MEMORIA ADJUNTA, EL 1 DE MARZO DE
2006 LA SOCIEDAD FIRMO VARIOS CONTRATOS DE COMPRAVENTA DE ACCIONES DE DIVERSAS
SOCIEDADES, CUYA EJECUCION QUEDABA SUPEDITADA AL CUMPLIMIENTO DE DETERMINADAS
CONDICIONES SUBVERSIVAS EN ELLAS INCLUIDAS. LOS FIRMANTES DE DICHOS CONTRATOS
CONSIDERARON CUMPLIDOS EL 5 DE MAYO DE 2006 DICHAS CONDICIONES, LO QUE SE
DENOMINA COMO FECHA DE EJECUCION SEGUN LOS TERMINOS DESCRITOS EN LOS MISMOS, Y
PROCEDIERON EN DICHA FECHA A OTORGAR ESCRITURAS PUBLICAS DE COMPRAVENTA DE
ACCIONES Y A LLEVAR A CABO EL RESTO DE OPERACIONES NECESARIAS PARA CONSIDERAR
EJECUTADAS LAS COMPRAVENTAS. POSTERIORMENTE, CON FECHA 30 DE JUNIO DE 2006 LAS
JUNTAS GENERALES DE ACCIONISTAS / SOCIOS DE LA SOCIEDAD Y DE UNA PARTE DE LAS SOCIEDADES
QUE FUERON ADQUIRIDAS EL 5 DE MAYO APROBARON LA FUSION POR ABSORCION DE ESAS
SOCIEDADES, SIENDO INVEST EXPERIENCE 2005, S.A. (ACTUALMENTE LEVANTINA Y
ASOCIADOS DE MINERALES, S.A.) LA SOCIEDAD ABSORBENTE. LA SOCN
COMPARATIVE SECTOR ANALYSIS
Values table
Figures expressed in %
|
|
COMPANY (2006) |
SECTOR |
DIFFERENCE |
DIFFERENCE RELATIVE |
|
BALANCE SHEET ANALYSIS: % on the total
assets |
|
|
|
|
|
OWN FUNDS |
10,85 |
39,36 |
-28,51 |
-72,44 |
|
DEBT |
89,15 |
60,64 |
28,51 |
47,01 |
|
FIXED ASSETS |
64,77 |
41,06 |
23,71 |
57,75 |
|
|
|
|
|
|
|
|
COMPANY (2006) |
SECTOR |
DIFFERENCE |
DIFFERENCE RELATIVE |
|
PROFIT AND LOSS ACCOUNT ANALYSIS: % on the total
operating income |
|
|
|
|
|
SALES |
99.601,71 |
98,99 |
99.502,71 |
100.513,88 |
|
ADDED VALUE |
33.142,49 |
30,02 |
33.112,47 |
110.308,71 |
|
EBIT |
6.340,13 |
11,77 |
6.328,36 |
53.762,32 |
|
NET RESULT |
-1.029,25 |
7,56 |
-1.036,81 |
-13.719,84 |
Sector Composition
Compared sector (NACE): 267
Number of companies: 39
Size (Sales Figure) : > 7.000.000,00 Euros
Comments on the sectorial
comparative
Compared to its sector the assets of the companies show a greater
proportion of fixed assets. Specifically the difference with the sector average
is 23,71% , which means a relative difference of 57,75% .
In liabilities composition the company appeals on a wider scale to self
financing, being the proportion of net worth of 28,51% inferior, which means a
relative difference of 72,44% 28,51% more than the sector, which means a
difference of 47,01% .
The proportion that the sales mean to the company’s total ordinary
income is 99.601,71%, 99.502,71% higher than in the sector, which means a
relative difference of 100.513,88% .
The company’s EBIT was positive and was 6.340,13% with regard to the
total ordinary income, 6.328,36% higher than in the sector, which means a
relative difference of 53.762,32% .
The company’s capacity to generate operating income is equal to that of
the sector as its ratio EBIT/Sales is also equal.
The company’s net result was negative and equal to -1.029,25% with
regard to the total ordinary income, 1.036,81% less than the sector, which
means a relative difference of 13.719,84% .
ADDRESSES
Current Legal Seat Address:
CARRETERA AUTOVIA 330, S/N - APARTADO CORREOS 8
03660 NOVELDA ALICANTE
Previous Seat Address:
CARRETERA AUTOVIA 330 KM,
03660
NOVELDA ALICANTE
Characteristics of the current
address
Type of premises: store
Property: owned; with no official confirmation
Local Situation: main
Branches 
|
STREET |
POSTAL CODE |
TOWN |
PROVINCE |
|
POLIGONO INDUSTRIAL GANDARAS DE BUDINO S/N |
36400 |
O PORRIÑO |
Pontevedra |
1 branches registered
CORPORATE STRUCTURE
ADMINISTRATIVE LINKS
Main Board members, Directors and Auditor ![]()
|
POSITION |
SURNAMES AND
NAME |
APPOINTMENT DATE |
|
|
PRESIDENT |
SPINNAKER HOLDINGS SARL |
04/03/2008 |
|
|
MANAGING DIRECTOR |
PINOS ZAMORA ANTONIO JOSE |
12/02/2008 |
|
|
CHIEF OFFICER |
CABERWOOD SARL |
30/06/2006 |
|
|
CHIEF OFFICER |
CHARTERHOUSE CORPORATE DIRECTORS LIMITED |
30/06/2006 |
|
|
CHIEF OFFICER |
SOCIEDAD GALLEGA DE ROCAS ORNAMENTALES S L |
10/01/2007 |
|
|
SECRETARY |
MERINO SANZ FEDERICO |
30/06/2006 |
|
|
AUDITOR |
APPOINTMENT DATE |
||
|
KPMG AUDITORES SL |
02/02/2007 |
||
Functional Managers
|
POSITION |
SURNAMES AND
NAME |
|
General Manager |
PINOS ZAMORA ANTONIO |
|
Financial Manager |
CUADRA LA FUENTE FRANCISCO |
|
Human Resources Manager |
COUTO VIVAS JORGE |
FINANCIAL LINKS
|
|
BUSINESS NAME |
CIF / COUNTRY |
% |
SOURCE |
DATA INF. |
|
|
ANTINEA INVERSIONES S.L. |
B53591418 |
Indet. |
OWN SOURCES |
21/04/2008 |
|
|
GALLARDO GALLARDO ANTONIA |
|
Indet. |
OWN SOURCES |
21/04/2008 |
|
|
MARCELINO MARTINEZ SL |
B36010098 |
Indet. |
OWN SOURCES |
21/04/2008 |
|
|
HIDALGO MURILLO FERNANDA |
|
Indet. |
OWN SOURCES |
21/04/2008 |
|
|
DIMORPHANDRA S.L. |
B53290961 |
Indet. |
OWN SOURCES |
21/04/2008 |
|
|
SPINNAKER HOLDINGS SARL |
|
Indet. |
OWN SOURCES |
21/04/2008 |
|
|
BUSINESS NAME |
CIF / COUNTRY |
% |
SOURCE |
DATA INF. |
|
|
GRANINTER DEUTSCHLAND GMBH |
GERMANY |
100,00 |
OWN SOURCES |
21/04/2008 |
|
|
GRANINTER USA INC |
ESTADOS UNIDOS |
100,00 |
OWN SOURCES |
21/04/2008 |
|
|
BERMARMOL SA |
A81725350 |
100,00 |
OWN SOURCES |
21/04/2008 |
|
|
GRANITOS IBERLUSOS LDA |
PORTUGAL |
100,00 |
OWN SOURCES |
21/04/2008 |
|
|
GRANINTER INDIA PVT LTDA |
INDIA |
100,00 |
OWN SOURCES |
21/04/2008 |
|
|
LUSO LEVANTINA DISTRIBUGAO DE GRANITO |
PORTUGAL |
100,00 |
OWN SOURCES |
21/04/2008 |
You can obtain business information of a foreign company at the
pageD&B International
CREDIT INFORMATION
Constitution Date: 16/08/2005
Foundation Date: 01/01/2005
Founder / Origin: LA TITULAR ES LA FUNDADORA INICIAL DEL NEGOCIO
Business activity 
Code: 1244000
Activity: Natural stone industries
NACE Code: 2670
NACE Activity: Cutting, shaping and finishing of stone
Business: LA EXPLOTACION, ADQUISICION Y ARRENDAMIENTO DE
CANTERAS, PERMISOS DE INVESTIGACION Y OTROS TERRENOS; LA EXPLOTACION DE
SERRERIAS Y TALLERES DE LABRA DE PIEDRAS NATURALES DE TODAS CLASES; LA
COMERCIALIZACION DE MARMOLES,
Employees 
Number of total employees: 2.500 (2008)
Number of fixed employees: 75,50%
Number of temporary employees: 24,50%
COMMERCIAL OPERATIONS 
SUPPLIERS
|
BUSINESS NAME |
INTERNATIONAL |
|
CASABLANCA
MARBLE & GRANITE SARL |
YES |
|
QUARZT STONE
PLUS SLU |
NO |
|
JOSE MARIA MAÑEZ
VERDU SA |
NO |
|
GRANINTER SA |
NO |
|
GRANITOS
IBEROLUSOS LDA |
YES |
|
GRANINTER
PRODUCCION SA |
NO |
|
CANTERAS VISEMAR
SLU |
NO |
|
CANTERAS
CORALITO SL |
NO |
|
GRANINTER INDIA
PVT LDA |
YES |
|
EXMINERA SL |
NO |
10 proveedores
CLIENTS
|
BUSINESS NAME |
INTERNATIONAL |
|
GANITOS
IBEROLUSOS LTDA |
YES |
|
QUARTZ STONE
PLUS SL |
NO |
|
GRANINTER POLSKA
SP ZOO |
YES |
|
GRANINTER USA |
YES |
|
CASABLANCA
MARBLE & STONE SARL |
YES |
|
LUSO LEVANTINA
DIST GTO LDA |
YES |
|
GRANINTER SA |
NO |
|
JOSE MARIA MAÑEZ
VERDU SA |
NO |
|
LEVANTINA DE
GRANITOS BRASIL LTDA |
YES |
9 clientes
Banks 
|
ENTITY |
BRANCH |
ADDRESS |
TOWN OR CITY |
PROVINCE |
|
BANCO BILBAO VIZCAYA ARGENTARIA, S.A. |
|
|
NOVELDA |
|
|
BANCO DE SABADELL, S.A. |
|
|
|
|
|
BANCO DE VALENCIA, S.A. |
|
|
|
|
|
BANCO PASTOR, S.A. |
|
|
|
|
|
BANKINTER, S.A. |
|
|
|
|
8 bank entities registered
Brands, Signs and Commercial
Names 
FORMER NAMES:
•
INVEST EXPERIENCE 2005 S.A.
LEGAL STRUCTURE
Constitution Data
Register Date: 16/08/2005
Register town: Madrid
Announcement number: 417053
Register Data:
Volume 21748, Book 0, Folio 73, Section 8, Sheet 387354
Legal form: JOINT STOCK COMPANY
Social Capital: 0 €
Current structure data 
Current Legal Form: JOINT STOCK COMPANY
Current Capital: 10.676.651,80 €
Legal Aspects
Obligation to fill in Financial Statements: YES
Chamber census: YES (2006)
Listed on a Stock Exchange: NO
B.O.R.M.E.(Official Companies
Registry Gazette) 
Registered Proceedings
|
PROCEEDINGS |
DATE |
NOTICE NUM. |
TRADE REG. |
|
Change of statutes |
18/07/2008 |
351975 |
Alicante |
|
Change of statutes |
16/07/2008 |
348735 |
Alicante |
|
Resignations |
05/06/2008 |
279361 |
Alicante |
Other Proceedings published
|
PROCEEDINGS |
DATE |
NOTICE NUM. |
TRADE REG. |
|
Fusion by absorption project |
11/06/2008 |
165034 |
Alicante |
|
Fusion by absorption project |
05/06/2008 |
160777 |
Valencia |
Press articles

11/07/2008 EXPANSION DE VALENCIA (SOCIAL INFORMATION)
DE LOS 195 TRABAJADORES A LOS QUE SE PLANTEO EL EXPEDIENTE DE REGULACION
DE EMPLEO EN LEVANTINA, 72 HAN PASADO A LOS CENTROS DEL GRUPO EN NOVELDA. LOS
123 RESTANTES FINALIZAN SUS CONTRATOS (10 DE ELLOS DE FORMA VOLUNTARIA).
11/07/2008 LA VOZ DE ALMERIA (BRANCHES INFORMATION)
LEVANTINA, EL PRODUCTOR DE PIEDRA VALENCIANO, HA ANUNCIADO LA APERTURA
DE UNA NUEVA DELEGACION EN ALMERIA. ESTA DECISION CONTRASTA CON EL PROYECTO DE CERRAR
DOS DE LAS FACTORIAS QUE POSEE EN NOVELDA (ALICANTE).
FINANCIAL INFORMATION
The information on the last account contained in this report is
extracted from the Mercantile Register file of the legal address of the Company
and dated 23/10/2007.
BALANCE SHEET
Assets
Figures given in €
|
|
31/12/2005 (4) |
31/12/2006 (12) |
|
A) DUE FROM SHAREHOLDERS FOR UNCALLED CAPITAL |
|
|
|
B) FIXED ASSETS |
601,20 |
399.386.000,00 |
|
I. Incorporation costs |
601,20 |
1.778.000,00 |
|
II. Intangible fixed assets |
|
119.982.000,00 |
|
III. Tangible fixed assets |
|
131.473.000,00 |
|
IV. Financial fixed assets |
|
141.854.000,00 |
|
V.Owners equity |
|
4.299.000,00 |
|
VI.Long term trade liabilities |
|
|
|
C) DEFERRED EXPENSES |
|
316.000,00 |
|
D) CURRENT ASSETS |
59.518,80 |
216.962.000,00 |
|
I. Shareholders by required outlays |
|
|
|
II. Stocks |
|
68.301.000,00 |
|
III. Debtors |
|
144.872.000,00 |
|
IV. Temporary financial investment |
|
533.000,00 |
|
V. Short-term own shares |
|
|
|
VI. Treasury |
59.518,80 |
2.358.000,00 |
|
VII. Periodification adjustments |
|
898.000,00 |
|
ASSETS (A + B + C + D) |
60.120,00 |
616.664.000,00 |
Assets composition


Liabilities
Figures given in €
|
|
31/12/2005 (4) |
31/12/2006 (12) |
|
A) SHAREHOLDERS EQUITY |
60.120,00 |
65.899.000,00 |
|
I. Share capital |
60.120,00 |
13.800.000,00 |
|
II. Issue bonus |
|
55.200.000,00 |
|
III.Revaluation reserve |
|
|
|
IV.Reserves |
|
|
|
Capital adjustments in Euros |
|
|
|
Sundry reserves |
|
|
|
V.Results from previous years |
|
|
|
VI.Profit and Losses |
|
-3.101.000,00 |
|
VII.Dividend paid during the year |
|
|
|
VIII.Own shares for capital reduction |
|
|
|
B) DEFERRED INCOME |
|
998.000,00 |
|
C) PROVISIONS FOR LIABILITIES AND EXPENSES |
|
1.400.000,00 |
|
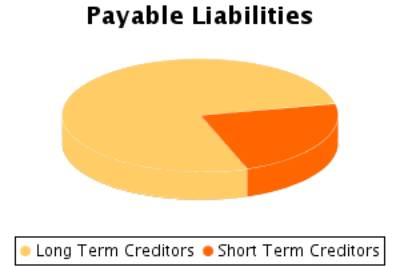
D) LONG TERM LIABILITIES |
|
424.069.000,00 |
|
E) SHORT TERM LIABILITIES |
|
124.298.000,00 |
|
F) SHORT TERM PROVISIONS FOR LIABILITIES AND
EXPENSES |
|
|
|
LIABILITIES (A + B + C + D + E + F) |
60.120,00 |
616.664.000,00 |
Liabilities Composition


PROFIT AND LOSS ACCOUNT
Itams of the Profit and Loss Account
Figures given in €
|
|
31/12/2005 (4) |
31/12/2006 (12) |
|
|
A) EXPENSES (A.1 a A.15) |
|
312.553.000,00 |
|
|
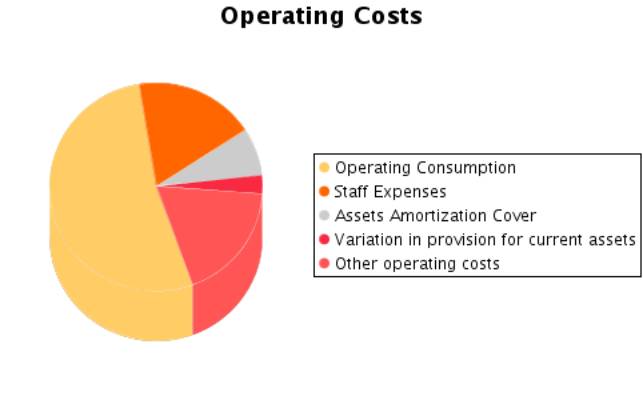
A.1.Operating costs |
|
149.517.000,00 |
|
|
A.2. Labour cost |
|
51.966.000,00 |
|
|
Wages |
|
40.158.000,00 |
|
|
Social security expenses |
|
11.808.000,00 |
|
|
A.3. Assets depreciation |
|
20.748.000,00 |
|
|
A.4. Variation in provision for current assets |
|
8.038.000,00 |
|
|
A.5. Other operating costs |
|
51.916.000,00 |
|
|
A.I. OPERATING RESULT (B.1-A.1-A.2-A.3-A.4-A.5) |
|
19.102.000,00 |
|
|
A.6.Financial expenses and similar |
|
19.541.000,00 |
|
|
Debts with related companies |
|
343.000,00 |
|
|
Debts with associated companies |
|
|
|
|
Other companies debts By debts with third parties and similar expenses |
|
19.189.000,00 |
|
|
Losses from financial investments |
|
9.000,00 |
|
|
A.7. Variation in financial investment provision |
|
100.000,00 |
|
|
A.8.Negative exchange difference |
|
2.801.000,00 |
|
|
A.II.POSITIVE FINANCIAL RESULTS
(B.2+B.3-A.6-A.7-A.8) |
|
|
|
|
A.III.PROFIT FROM ORDINARY ACTIVITIES (A.I+A.II-B.I-B.II) |
|
|
|
|
A.9. Variation in provision in fixed assets |
|
2.439.000,00 |
|
|
A.10. Losses in fixed assets |
|
342.000,00 |
|
|
A.11. Losses from own shares and bonds |
|
|
|
|
A.12. Extraordinary charges |
|
6.206.000,00 |
|
|
A.13.Other exercises’ expenses and losses |
|
2.182.000,00 |
|
|
A.IV.POSITIVE EXTRAORDINARY RESULT
(B.4+B.5+B.6+B.7+B.8-A.9-A.10-A.11-A.12-A.13) |
|
|
|
|
A.V.PROFIT BEFORE TAXES (A.III+A.IV-B.III-B.IV) |
|
|
|
|
A.14.Corporate Taxes |
|
-3.243.000,00 |
|
|
A.15. Other taxes |
|
|
|
|
A.VI.EXERCISE RESULT (PROFIT) (A.V-A.14-A.15) |
|
|
|
|
B) INCOMES (B.1 a B.8) |
|
309.452.000,00 |
|
|
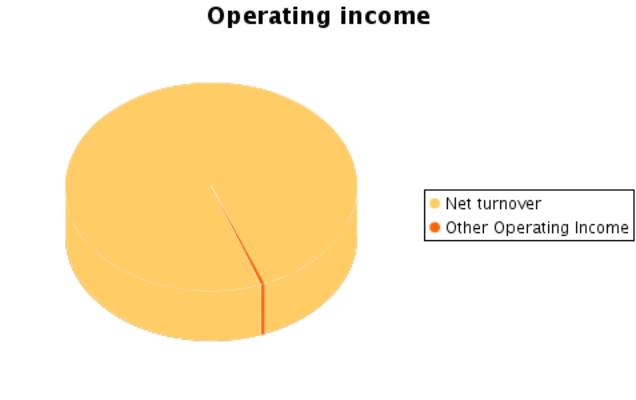
B.1.Operating income |
|
301.287.000,00 |
|
|
Turnover |
|
300.087.000,00 |
|
|
Other operating income |
|
1.200.000,00 |
|
|
B.I.OPERATING LOSSES (A.1+A.2+A.3+A.4+A.5-B.1) |
|
|
|
|
B.2.Financial Income |
|
1.398.000,00 |
|
|
From affiliated companies |
|
433.000,00 |
|
|
From associated companies |
|
100.000,00 |
|
|
Other |
|
726.000,00 |
|
|
Gains from investments |
|
139.000,00 |
|
|
B.3. Positive change difference |
|
1.646.000,00 |
|
|
B.II. NEGATIVE FINANCIAL RESULTS
(A.6+A.7+A.8-B.2-B.3) |
|
19.398.000,00 |
|
|
B.III.LOSSES FROM ORDINARY ACTIVITIES (B.I+B.II-A.I-A.II) |
|
296.000,00 |
|
|
B.4.B.9. Gains from disposal of fixed assets |
|
4.240.000,00 |
|
|
B.5.Gains from dealing in own shares |
|
|
|
|
B.6. Paid in surplus |
|
204.000,00 |
|
|
B.7. Extraordinary income |
|
263.000,00 |
|
|
B.8.Other year’s income and profits |
|
414.000,00 |
|
|
B.IV.NEGATIVE EXTRAORDINARY LOSSES
(A.9+A.10+A.11+A.12+A.13-B.4-B.5-B.6-B.7-B.8) |
|
6.048.000,00 |
|
|
B.V.LOSS BEFORE TAXES (B.III+B.IV-A.III-A.IV) |
|
6.344.000,00 |
|
|
B.VI.EXERCISE RESULTS (LOSS) (B.V+A.14+A.15) |
|
3.101.000,00 |
|
Composition of the Profit and
Loss Account


FINANCIAL BALANCE
Here the Main Capital Amounts of the company and the Revolving Fund
Evolution are analysed.
Financial Balance Table
Figures given in €
|
|
31/12/2005 (4) |
% |
31/12/2006 (12) |
% |
|
A) DUE FROM SHAREHOLDERS FOR UNCALLED CAPITAL |
|
|
|
|
|
B) FIXED ASSETS |
601,20 |
1,00 |
399.386.000,00 |
64,77 |
|
C) DEFERRED EXPENSES |
|
|
316.000,00 |
0,05 |
|
D) CURRENT ASSETS |
59.518,80 |
99,00 |
216.962.000,00 |
35,18 |
|
ASSETS (A + B + C + D) |
60.120,00 |
|
616.664.000,00 |
|
|
|
|
|
|
|
|
A) SHAREHOLDERS EQUITY |
60.120,00 |
100,00 |
65.899.000,00 |
10,69 |
|
B) DEFERRED INCOME |
|
|
998.000,00 |
0,16 |
|
C) PROVISIONS FOR LIABILITIES AND EXPENSES |
|
|
1.400.000,00 |
0,23 |
|
D) LONG TERM LIABILITIES |
|
|
424.069.000,00 |
68,77 |
|
E) SHORT TERM LIABILITIES |
|
|
124.298.000,00 |
20,16 |
|
F) SHORT TERM PROVISIONS FOR LIABILITIES AND EXPENSES |
|
|
|
|
|
LIABILITIES (A + B + C + D + E + F) |
60.120,00 |
|
616.664.000,00 |
|
Financial Balance Composition


Comments on Financial Balance
In the 2005, the assets of the company were formed in 1,00% of Fixed
Assets and in 99,00% of Current Assets.This assets were financed in 100,00%
with own capitals% with long term debt% with current liabilities.
The result of this financial structure is a positive turnover fund of
59.518,80 Euros, which is equivalent to 99,00% proportion of the
company’s total assets.
In the 2006, the assets of the company were formed in 64,82% of Fixed
Assets and in 35,18% of Current Assets.This assets were financed in 10,85% with
own capitals, and in 69,00% with long term debt and in 20,16% with current
liabilities.
The result of this financial structure is a positive turnover fund of
92.664.000,00 Euros, which is equivalent to 15,03% proportion of the
company’s total assets.
RATIOS
Main Ratios
|
|
31/12/2005 (4) |
31/12/2006 (12) |
|
|
STRUCTURAL RATIOS |
|
|
|
|
Management fund |
59.518,80 |
92.664.000,00 |
|
|
Management Fund Requirement |
|
127.195.000,00 |
|
|
Indebtedness (%) |
|
89,15 |
|
|
External Funds on Net Worth |
|
8,22 |
|
|
GENERAL ACTIVITY RATIO |
|
|
|
|
Cash Flow |
|
28.224.000,00 |
|
|
Labour Productivity |
|
1,92 |
|
|
Assets turnover |
|
0,49 |
|
|
Breakdown Point |
|
263.366.566,00 |
|
|
Security Margin of the Breakdown Point (%) |
|
12,59 |
|
|
ACTIVITY RATIOS |
|
|
|
|
Average Payment Period |
|
114 |
|
|
Average Collection Period |
|
174 |
|
|
Inventory Turnover Period |
|
82 |
|
|
SOLVENCY RATIOS |
|
|
|
|
Payback Capacity |
|
0,05 |
|
|
Assets Guarantee |
|
1,12 |
|
|
Short Term Debts Proportion (%) |
|
22,61 |
|
|
Interest Coverage |
|
0,56 |
|
|
LIQUIDITY RATIOS |
|
|
|
|
Current Ratio |
|
1,74 |
|
|
Immediate liquidity |
|
0,02 |
|
|
Treasury |
|
-34.531.000,00 |
|
|
Sales on Current Assets |
|
498 |
|
Results Analysis Ratios
|
|
31/12/2005 (4) |
31/12/2006 (12) |
|
|
Economic profitability (%) |
|
3,10 |
|
|
Operating Profitability (%) |
|
6,36 |
|
|
Equity gearing |
|
-0,14 |
|
|
Financial profitability (%) |
|
-4,64 |
|
|
General Profitability (%) |
|
-1,03 |
|
SECTORIAL ANÁLYSIS
Large Capital Amounts and Financial Balance
Figures given in %
|
|
COMPANY (2006) |
SECTOR |
DIFFERENCE |
DIFFERENCE RELATIVE |
|
ASSETS |
|
|
|
|
|
A) DUE FROM SHAREHOLDERS FOR UNCALLED CAPITAL |
|
0,00 |
|
|
|
B) FIXED ASSETS |
64,77 |
41,06 |
23,71 |
57,76 |
|
C) DEFERRED EXPENSES |
0,05 |
0,10 |
-0,05 |
-48,45 |
|
D) CURRENT ASSETS |
35,18 |
58,85 |
-23,67 |
-40,22 |
|
ASSETS (A + B + C + D) |
100 |
100 |
|
|
|
|
|
|
|
|
|
|
COMPANY (2006) |
SECTOR |
DIFFERENCE |
DIFFERENCE RELATIVE |
|
LIABILITIES |
|
|
|
|
|
A) SHAREHOLDERS EQUITY |
10,69 |
36,34 |
-25,65 |
-70,58 |
|
B) DEFERRED INCOME |
0,16 |
3,02 |
-2,86 |
-94,70 |
|
C) PROVISIONS FOR LIABILITIES AND EXPENSES |
0,23 |
0,20 |
0,04 |
17,95 |
|
D) LONG TERM LIABILITIES |
68,77 |
13,09 |
55,68 |
425,28 |
|
E) SHORT TERM LIABILITIES |
20,16 |
47,36 |
-27,20 |
-57,43 |
|
F) SHORT TERM PROVISIONS FOR LIABILITIES AND EXPENSES |
|
0,00 |
|
|
|
LIABILITIES (A + B + C + D + E + F) |
100 |
100 |
|
|
Financial Balance Composition


Comments to the Sectorial
Analysis
In the 2006, the assets of the company were formed in 64,82% of fixed
assets and in 35,18Current Assets % In the sector, the proportion of fixed
assets was of 41,15%, 57,51% inferior, and the proportion of current assets was
of 58,85%, 40,22% superior.
The assets were financed in the company in 10,85% with own capitals , in
69,00% with fixed liabilities and in 20,16% with current liabilities In the
sector, the self financing represented 39,36%, 72,43% superior. On the other
hand the long term debts represented in the sector an average of 13,29%
financing, with a relative difference of 419,30% in favour of the companyAnd,
short term liabilities represented in the sector an average of 47,36%
financing, with a relative difference of 57,43% favourable to the sector
The result of this company’s financial structure is a turnover fund that
represents 15,03% of the total assets; in the sector, this same proportion is
11,49%, therefore, we can say that the company’s turnover fund is 30,80% higher
than the one in of the sector.
Analytical Account of Results
Figures given in %
|
|
COMPANY (2006) |
SECTOR |
DIFFERENCE |
DIFFERENCE RELATIVE |
|
Turnover |
99,60 |
98,99 |
0,61 |
0,61 |
|
Other operating income |
0,40 |
1,01 |
-0,61 |
-60,24 |
|
Production Value |
100,00 |
100,00 |
0,00 |
0,00 |
|
Operating expenses |
49,63 |
51,18 |
-1,55 |
-3,03 |
|
Other operation expenses |
17,23 |
18,80 |
-1,57 |
-8,35 |
|
Added value |
33,14 |
30,02 |
3,12 |
10,40 |
|
Labour cost |
17,25 |
12,88 |
4,37 |
33,97 |
|
Gross Economic Result |
15,89 |
17,14 |
-1,25 |
-7,30 |
|
Assets depreciation |
6,89 |
4,47 |
2,42 |
54,04 |
|
Variation in provision for current assets and bad debt losses |
2,67 |
0,90 |
1,77 |
197,66 |
|
Net Economic Result |
6,34 |
11,77 |
-5,43 |
-46,14 |
|
Financial income |
1,01 |
1,46 |
-0,45 |
-30,73 |
|
Financial Charges |
7,42 |
2,86 |
4,56 |
159,53 |
|
Variation in financial investment provision |
0,03 |
-0,01 |
0,04 |
-528,57 |
|
Ordinary Activities Result |
-0,10 |
10,38 |
-10,48 |
-100,96 |
|
Extraordinary income |
1,70 |
0,98 |
0,72 |
73,82 |
|
Extraordinary charges |
2,90 |
0,56 |
2,34 |
418,78 |
|
Variation in provision in fixed assets |
0,81 |
0,22 |
0,59 |
275,00 |
|
Results before Taxes |
-2,11 |
10,58 |
-12,69 |
-119,94 |
|
Corporate taxes |
-1,08 |
3,02 |
-4,10 |
-135,73 |
|
Net Result |
-1,03 |
7,56 |
-8,59 |
-113,63 |
|
Assets depreciation |
6,89 |
4,47 |
2,42 |
54,04 |
|
Change of Provisions |
3,51 |
1,11 |
2,40 |
217,07 |
|
Net Self-Financing |
9,37 |
13,14 |
-3,77 |
-28,67 |
Main Ratios
|
|
COMPANY (2006) |
PTILE25 |
PTILE50 |
PTILE75 |
|
STRUCTURAL RATIOS |
|
|
|
|
|
Management fund |
92.664.000,00 |
-221,55 |
2.005,50 |
3.442,68 |
|
Management Fund Requirement |
127.195.000,00 |
-5.776,21 |
-1.177,42 |
735,00 |
|
Indebtedness (%) |
89,15 |
49,90 |
62,01 |
72,54 |
|
External Funds on Net Worth |
8,22 |
1,00 |
1,63 |
2,64 |
|
GENERAL ACTIVITY RATIO |
|
|
|
|
|
Cash Flow |
28.224.000,00 |
667,00 |
1.038,00 |
1.676,48 |
|
Labour Productivity |
1,92 |
1,58 |
1,99 |
2,46 |
|
Assets turnover |
0,49 |
0,80 |
0,93 |
1,24 |
|
Breakdown Point |
263.366.566,00 |
7.040.182,86 |
10.601.758,75 |
16.126.471,04 |
|
Security Margin of the Breakdown Point (%) |
12,59 |
8,93 |
12,94 |
19,60 |
|
ACTIVITY RATIOS |
|
|
|
|
|
Average Payment Period |
114 |
80 |
116 |
164 |
|
Average Collection Period |
174 |
120 |
140 |
162 |
|
Inventory Turnover Period |
82 |
28 |
61 |
81 |
|
SOLVENCY RATIOS |
|
|
|
|
|
Payback Capacity |
0,05 |
0,09 |
0,16 |
0,26 |
|
Assets Guarantee |
1,12 |
1,38 |
1,61 |
2,00 |
|
Short Term Debts Proportion (%) |
22,61 |
74,80 |
82,03 |
91,48 |
|
Interest Coverage |
0,56 |
2,30 |
5,10 |
15,33 |
|
LIQUIDITY RATIOS |
|
|
|
|
|
Current Ratio |
1,74 |
0,95 |
1,25 |
1,66 |
|
Immediate liquidity |
0,02 |
0,03 |
0,07 |
0,24 |
|
Treasury |
-34.531.000,00 |
-3.855,10 |
-1.373,98 |
484,73 |
|
Sales on Current Assets |
498 |
459 |
554 |
707 |
Results Analysis Ratios
|
|
COMPANY (2006) |
PTILE25 |
PTILE50 |
PTILE75 |
|
Economic profitability (%) |
3,10 |
2,55 |
5,74 |
9,90 |
|
Operating Profitability (%) |
6,36 |
3,27 |
6,03 |
7,94 |
|
Equity gearing |
-0,14 |
1,24 |
1,80 |
3,10 |
|
Financial profitability (%) |
-4,64 |
4,27 |
8,98 |
17,68 |
|
General Profitability (%) |
-1,03 |
1,48 |
3,02 |
5,90 |
FOREIGN EXCHANGE
RATES
|
Currency |
Unit
|
Indian Rupees |
|
US Dollar |
1 |
Rs. 41.96 |
|
UK Pound |
1 |
Rs. 83.78 |
|
Euro |
1 |
Rs. 65.82 |
RATING
EXPLANATIONS
|
RATING |
STATUS |
PROPOSED CREDIT LINE |
|
|
>86 |
Aaa |
Possesses an extremely sound financial base with the strongest
capability for timely payment of interest and principal sums |
Unlimited |
|
71-85 |
Aa |
Possesses adequate working capital. No caution needed for credit transaction.
It has above average (strong) capability for payment of interest and
principal sums |
Large |
|
56-70 |
A |
Financial & operational base are regarded healthy. General unfavourable
factors will not cause fatal effect. Satisfactory capability for payment of
interest and principal sums |
Fairly Large |
|
41-55 |
Ba |
Overall operation is considered normal. Capable to meet normal
commitments. |
Satisfactory |
|
26-40 |
B |
Unfavourable & favourable factors carry similar weight in credit
consideration. Capability to overcome financial difficulties seems
comparatively below average. |
Small |
|
11-25 |
Ca |
Adverse factors are apparent. Repayment of interest and principal sums
in default or expected to be in default upon maturity |
Limited with
full security |
|
<10 |
C |
Absolute credit risk exists. Caution needed to be exercised |
Credit not
recommended |
|
NR |
In view of the lack of information, we have no basis upon which to
recommend credit dealings |
No Rating |
|
This score serves as a reference to assess SC’s credit risk
and to set the amount of credit to be extended. It is calculated from a composite
of weighted scores obtained from each of the major sections of this report. The
assessed factors and their relative weights (as indicated through %) are as
follows:
Financial
condition (40%) Ownership
background (20%) Payment
record (10%)
Credit history
(10%) Market trend
(10%) Operational
size (10%)