MIRA INFORM REPORT


Report Date :

25.07.2008


IDENTIFICATION DETAILS


Name :

CHARTERED INSTITUTE OF PURCHASING & SUPPLY


Registered Office :

Easton Ho, Easton On The Hill, STAMFORD, LINCOLNSHIRE, PE9 3NZ


Country :

United Kingdom


Financials (as on) :

31.10.2006


Date of Incorporation :

1932


Legal Form :

Private Limited Company


Line of Business :

Miscellaneous Business Services


RATING & COMMENTS


MIRA’s Rating :

B


RATING

STATUS

PROPOSED CREDIT LINE

26-40

B

Unfavourable & favourable factors carry similar weight in credit consideration. Capability to overcome financial difficulties seems comparatively below average.

Small


Maximum Credit Limit :

£217,000


Status :

Moderate


Payment Behaviour :

Slow


Litigation :

Clear


NAME OF THE COMPANY


CHARTERED INSTITUTE OF PURCHASING & SUPPLY


Legal Events


Number of Court Judgments

0


Value of all Court Judgments

0


Number of Mortgages and Charges

0


Maximum Credit                                                                                                     


£217,000


Associations


Parent Company

No


Number of Principal

1


Financial Summary


Latest Accounts Date

31 Oct 2006


Tangible Net Worth

£(1,546,000)


Turnover

£ 12,133,000


Identification


Main Trading Address              Easton Ho
Easton On The Hill
STAMFORD
LINCOLNSHIRE

                                                PE9 3NZ

                                                UNITED KINGDOM


   Telephone Number                01780-756777         

   Fax Number                            01780-751610       

   ID Number                              42-345-9833           

   Web Address                         http://www.cips.org/  


   Line of Business (SIC)         MISCELLANEOUS BUSINESS SERVICES (7399)


 Main Influencing Factors for Risk Evaluation

§                     This is a lower risk industry sector.

§                     There are a reasonable number of principals associated with this business.

§                     The cash figure for this business is strong.

§                     The liabilities to net worth ratio is weak.

§                     There are no or only a small number of trade experiences paid more than 91 days late.

§                     There are no outstanding CCJs or Scottish Decrees for this business or they are not material to the risk assessment.


 Rating & Score - Industry Sector Comparison               


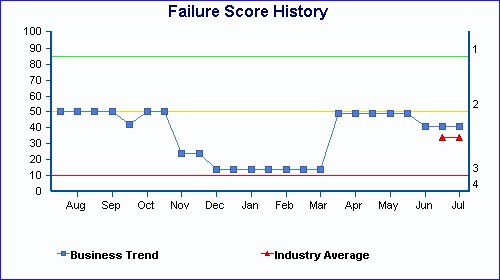
History and Industry Comparison of  Failure Score


The graph below shows the history of the  Failure Score for CHARTERED INSTITUTE OF PURCHASING & SUPPLY over the last 12 months compared to the average for its industry group.


                        Comparison of Financial Strength

            Financial Strength of CHARTERED INSTITUTE OF PURCHASING & SUPPLY: N

            Total number of businesses in the industry with known Financial Strength 144,322 of these

§  119,354 (82.7%) have a higher Financial Strength.

§  24,968 (17.3%) have the same Financial Strength.

§  0 (0.0%) have a lower Financial Strength.


Commentary


§                     Today's Failure Score of  41 indicates that CHARTERED INSTITUTE OF PURCHASING & SUPPLY is less likely to fail than industry average.  

§                     Total number of businesses in the same industry group as CHARTERED INSTITUTE OF PURCHASING & SUPPLY : 417,896

§                     Average Industry Score: 34


 Payment Information                                


The agent collects in excess of 100 million payment experiences on European businesses each year. The information shown below indicates how  CHARTERED INSTITUTE OF PURCHASING & SUPPLY has been paying its bills.

 Average Days Beyond Terms      27

Paydex                                        54


Number of payment experiences (last 12 months) 12


Total Value of Experiences                                             £ 20,100


Average Value of Experiences                                         £ 1,675


Payment Experiences Summary


Value Bands
GBP

Number of Experiences

Total Value
GBP

% paid within terms

1-30
days

31-60
days

61-90
days

91+
days

> 100,000

-

-

-

-

-

-

-

50,000 - 99,999

-

-

-

-

-

-

-

15,000 - 49,999

-

-

-

-

-

-

-

5,000 - 14,999

-

-

-

-

-

-

-

1,000 - 4,999

7

18,500

46

11

-

31

12

< 1,000

5

1,600

100

-

-

-

-

Total

12

20,100


In some instances, payment beyond terms can be the result of overlooked or disputed invoices                              


 Payment Industry Comparison


Shown below is an industry comparison based on the 70,181 other businesses in same industry group as CHARTERED INSTITUTE OF PURCHASING & SUPPLY where the agent has payment experiences.


Comparison of Days Beyond Terms and Payment Score

CHARTERED INSTITUTE OF PURCHASING & SUPPLY

Pays 27 days beyond terms.

Paydex of 54

Upper quartile (top 25%)

pays within terms

Paydex of 80

Median (middle 50%)

pays 6 days beyond terms

Paydex of 76

Lower quartile (bottom 25%)

pays 19 days beyond terms

Paydex of 65


 Risk of Failure and Payment Performance - Industry Sector Comparison


 Commentary


CHARTERED INSTITUTE OF PURCHASING & SUPPLY pays it's bills on average 27 days beyond terms.


This is 21 days longer than the national average of 6 days beyond terms.


When compared to similar businesses CHARTERED INSTITUTE OF PURCHASING & SUPPLY pays slower than the industry average of 6 days beyond terms.


The  failure score of 41 predicts that the risk of failure within the next 12 months for CHARTERED INSTITUTE OF PURCHASING & SUPPLY is slightly greater than average.


This compares to an industry average  Failure Score this month of 34 and a national average of 50.


Public Notice information is added to the  Database and, if present, will appear in this section. This section was last updated from public sources on 23 Jul 2008.


Judgements


Year                Total Judgments                     Total Value     Closed Judgements                Value (Closed)

2008                0                                             0                      0                                             0

2007                0                                             0                      0                                             0

2006                0                                             0                      0                                             0

2005                0                                             0                      0                                             0

2004                0                                             0                      0                                             0

2003                0                                             0                      0                                             0

Total               0                                             0                      0                                             0


Mortgages and Charges


Number of registered charges: 0


Legal Filing Summary


All public notice information has been obtained in good faith from the appropriate public sources.


To gain additional insight into the principal(s) of this business, conduct a consumer credit search.

Mr Ken James, Chief Executive Officer

Date Appointed

02 Jun 2003


No other current associations


Company Name

Operates As

Year Started

% Shares owned

CIPS SERVICES LTD

EMPLOYMENT AGENCY

1991

-


 Operations                                                   


Operating as

SIC Code

NACE Code

UK SIC Code

MISCELLANEOUS BUSINESS SERVICES

7399

74.87

74.879


Professional chartered institute

Other Operating Details

Employees

90


During our investigation:

§                     Mrs Stella Orchard ,Receptionist confirmed general details in this report.


Fiscal
Consolidated
GBP
31 Oct 2006
(000's)

Fiscal
Consolidated
GBP
31 Oct 2004
(000's)

Sales Turnover

12,133

9,601

Profit / (Loss) Before Taxes

(281)

(108)


Equity Shareholders Funds

(1,546)

1,167

Tangible Net Worth

(1,546)

1,167


Total Fixed Assets

2,178

1,515


Total Assets

6,352

4,993


Total Current Assets

4,174

3,478


Total Current Liabilities

5,538

3,826


Net Current Assets (Liabilities)

(1,364)

(348)


Long Term Debt

2,360

-


Employees**

99

91


(** not in 000's)


Fiscal
Consolidated
GBP
31 Oct 2006
(000's)

Fiscal
Consolidated
GBP
31 Oct 2004
(000's)


Net Sales

12,133

9,601


Cost of sales

0

0


Gross Profit / (loss)

12,133

9,601


General Expenses

-

162


Other Operating charges

12,349

9,584


Net Operating Income

(216)

(145)


Other financial income

140

37


Total Financial Income

140

37


Other Group Financial Expenses

205

-


Total Financial Expenses

205

0

Profit / (Loss) Before Taxes

(281)

(108)


Profit / (Loss) After Taxes

(281)

(108)


Dividends

0

-


Retained Profit for the year

(281)

(108)


Reconciliation


Retained Earnings at start of year

(1,265)

1,275


Retained Profit for the year

(281)

(108)


Retained Earnings at end of year

(1,546)

1,167


NOTES


Number of Employees**

99

91


Directors Remuneration**

0

0


Payroll

3,479

2,726


Depreciation

252

119


(** not in 000's)


Fiscal
Consolidated
GBP
31 Oct 2006
(000's)

Fiscal
Consolidated
GBP
31 Oct 2004
(000's)

FIXED ASSETS


Land & Buildings

400

421


Fixtures & Equipment

600

252


TANGIBLE FIXED ASSETS

1,000

673


Long Term Investments

1,178

842


Total Fixed Assets

2,178

1,515


CURRENT ASSETS


Other

71

75


Stock & work in progress

71

75


Cash at bank / in hand

2,024

1,759


Trade Debtors

1,129

1,065


Other receivables

17

15


Prepayments

933

564


Total Current Assets

4,174

3,478


CURRENT LIABILITIES


Trade Creditors

1,595

730


Accruals / Deferred Income

3,728

2,926


Tax & Social Security

215

170


Total Current Liabilities

5,538

3,826


Net Current Assets (Liabilities)

(1,364)

(348)


Total Assets less Current Liabilities

814

1,167


LONG-TERM LIABILITIES


Other long term liabilities

2,360

-


Total Long Term Liabilities

2,360

-


Net Assets

(1,546)

1,167


Net Worth / Shareholders Funds


Retained Earnings / Profit & Loss Account

(1,546)

1,167


Equity Shareholders Funds

(1,546)

1,167


Tangible Net Worth

(1,546)

1,167


Notes to the Balance Sheet


Guarantees given to pay off indebtedness

No

No


AUDITORS/REGISTRARS:


AUDITORS


PKF (UK) LLP, Farringdon Place,20 Farringdon Road, London EC1M 3AB


SOLICITORS


Bristows, 3 Lincoln's Fields, London WC2A 3AA


SOLICITORS


Buckle Mellows, 45-51 Prestgate, Peterborough PE1 1LB


31 Oct 2006

31 Oct 2004

Profitability

Profit Margin (%)

(2.3)

(1.1)


Shareholders' Return (%)

-

(9.3)


Return On Capital (%)

(34.5)

(9.3)


Return On Assets (%)

(4.4)

(2.2)


Financial Status

Acid Test (x)

0.6

0.7


Current Ratio (x)

0.8

0.9


Solvency Ratio (%)

(510.9)

327.8


Fixed Assets/Net Worth (%)

(64.7)

57.7


Current Liabilities/Net Worth (%)

(358.2)

327.8


Current Liabilities/Stocks (%)

7,800.0

5,101.3


Asset Utility

Stock Turnover Rate

170.9

128.0


Collection Period (days)

34.0

40.5


Asset Turnover (%)

191.0

192.3


Sales / Net Working Capital (x)

(8.9)

(27.6)


Assets / Sales (%)

52.4

52.0


Creditors / Sales (days)

48.0

27.8


Employee

Capital / Employee*

8.2

12.8


Sales / Employee*

122.6

105.5


Profit / Employee*

(2.8)

(1.2)


Employee Average Wage*

35.1

30.0


(* in 000's)


2006 vs 2004

Turnover

26.37


Gross Profit

26.37


Net Operating Profit

(48.97)

Profit Before Tax

(160.19)


Profit After Tax

(160.19)


Net Profit for the year

(160.19)


Number of Employees

8.79


Profit / Employee

(133.33)


Current Assets

20.01


Total Assets

27.22


Current Liabilities

44.75


Net Current Assets (Liabilities)

(291.95)


Total Assets less Current Liabilities

(30.25)


Net Assets

(232.48)


 Auditors Opinions / Qualifications


 Year

 Qualified

 Auditors Opinions

31 Oct 2006

No

-

31 Oct 2004

No

-


FOREIGN EXCHANGE RATES


Currency

Unit

Indian Rupees

US Dollar

1

Rs.42.30

UK Pound

1

Rs.84.03

Euro

1

Rs.66.42


RATING EXPLANATIONS


RATING

STATUS


PROPOSED CREDIT LINE

>86

Aaa

Possesses an extremely sound financial base with the strongest capability for timely payment of interest and principal sums


Unlimited

71-85

Aa

Possesses adequate working capital. No caution needed for credit transaction. It has above average (strong) capability for payment of interest and principal sums


Large

56-70

A

Financial & operational base are regarded healthy. General unfavourable factors will not cause fatal effect. Satisfactory capability for payment of interest and principal sums


Fairly Large

41-55

Ba

Overall operation is considered normal. Capable to meet normal commitments.


Satisfactory

26-40

B

Unfavourable & favourable factors carry similar weight in credit consideration. Capability to overcome financial difficulties seems comparatively below average.


Small

11-25

Ca

Adverse factors are apparent. Repayment of interest and principal sums in default or expected to be in default upon maturity


Limited with full security

<10

C

Absolute credit risk exists. Caution needed to be exercised


Credit not recommended

NR

In view of the lack of information, we have no basis upon which to recommend credit dealings

No Rating


This score serves as a reference to assess SC’s credit risk and to set the amount of credit to be extended. It is calculated from a composite of weighted scores obtained from each of the major sections of this report. The assessed factors and their relative weights (as indicated through %) are as follows:


Financial condition (40%)            Ownership background (20%)                 Payment record (10%)

Credit history (10%)                    Market trend (10%)                                Operational size (10%)


PRIVATE & CONFIDENTIAL : This information is provided to you at your request, you having employed MIPL for such purpose. You will use the information as aid only in determining the propriety of giving credit and generally as an aid to your business and for no other purpose. You will hold the information in strict confidence, and shall not reveal it or make it known to the subject persons, firms or corporations or to any other. MIPL does not warrant the correctness of the information as you hold it free of any liability whatsoever. You will be liable to and indemnify MIPL for any loss, damage or expense, occasioned by your breach or non observance of any one, or more of these conditions