![]()
MIRA
INFORM REPORT
|
Report Date : |
29.07.2008 |
IDENTIFICATION
DETAILS
|
Name : |
FACET PEDREROS SA |
|
|
|
|
Registered Office : |
|
|
|
|
|
Country : |
Spain |
|
|
|
|
Financials (as on) : |
31.12.2006 |
|
|
|
|
Date of Incorporation : |
|
|
|
|
|
Legal Form : |
Joint Stock Company |
|
|
|
|
Line of Business : |
RATING &
COMMENTS
|
MIRA’s Rating : |
A |
|
RATING |
STATUS |
PROPOSED CREDIT LINE |
|
|
56-70 |
A |
Financial & operational base are regarded healthy. General
unfavourable factors will not cause fatal effect. Satisfactory capability for
payment of interest and principal sums |
Fairly Large |
|
Status : |
Good |
|
|
|
|
Payment Behaviour : |
Regular |
|
|
|
|
Litigation : |
Clear |
FINANCIAL
REPORT
FACET PEDREROS SA
TAX NUMBER: A58288168
EXECUTIVE SUMMARY
Identification
Current Business Name: FACET PEDREROS SA
Commercial Name: FACET PEDREROS,
S.A.
Other names: YES
Current Address: AVENIDA DIAGONAL, 463, CP 08036 BARCELONA
Telephone number: 933633480 Fax: 933633481
URL: www.facetdiamonds.com
Corporate e-mail:
facet@facet.es
Commercial Risk
Legal Actions: NO
Financial Information
Latest Balance sheet sales (2006): 23.996.292,74 €
(MERCANTILE REGISTER)
Result: 591.278,11 €
Total Assets:
19.881.907,85 €
Social Capital: 1.138.500,00 €
Employees: 40
Commercial Information
Constitution Date: 12/01/1987
Business activity: Wholesale of minerals
NACE Code: 5152
International Operations: Imports and Exports
Corporate Structure
Sole Administrator:
Participations: 5
Other Complementary Information
Latest proceeding published in BORME: 23/04/2008 Resignations
Latest press article: 16/02/2001 VANGUARDIA (INFORMATION
ON LEGAL ANNOUNCE)
Bank Entities: Yes
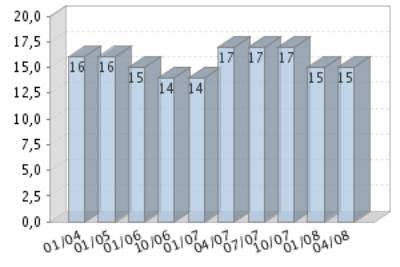
Rating Evolution
Financial Situation
Fiscal year2006
|
Treasury |
Good |
|
Indebtedness |
Important |
|
Profitability |
Average |
|
Balance |
Excellent |
Performance
|
Legal Actions |
None or Negligible |
|
Business
Trajectory |
Excellent |
INCIDENTS

Summary
LEGAL ACTIONS: No legal
incidences registered
CLAIM FILED AGAINST THE ADMINISTRATION: No administrative
claims registered
AFFECTED BY: No significant
element.
FINANCIAL ELEMENTS AND SECTORIAL
COMPARATIVE
FINANCIAL ELEMENTS
Figures given in €
|
|
2004 (12) |
2005 (12) |
2006 (12) |
% ASSETS |
|
|
|
|
|
|
BALANCE SHEET ANALYSIS |
|
|
|
|
|
|
|
|
|
|
OWN FUNDS |
3.423.246,75 |
3.599.804,71 |
3.815.388,06 |
19,19 |
|
|
|
|
|
|
DEBT |
12.086.725,92 |
13.378.121,01 |
16.066.519,79 |
80,81 |
|
|
|
|
|
|
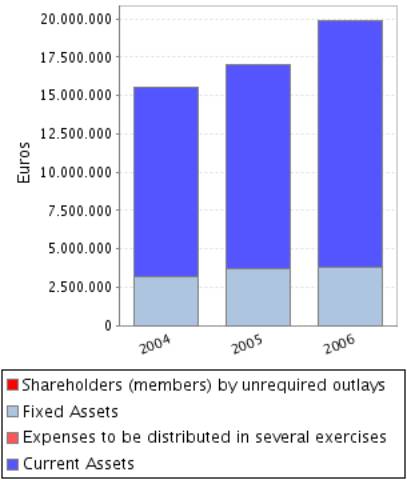
FIXED ASSETS |
3.201.469,03 |
3.669.680,10 |
3.798.009,93 |
19,10 |
|
|
|
|
|
|
TOTAL ASSETS |
15.509.972,67 |
16.977.925,72 |
19.881.907,85 |
|
|
|
|
|
|
|
|
|
|
|
|
|
|
|
|
|
|
|
2004 (12) |
2005 (12) |
2006 (12) |
% SALES |
|
|
|
|
|
|
PROFIT AND LOSS ACCOUNT ANALYSIS |
|
|
|
|
|
|
|
|
|
|
SALES |
16.383.720,40 |
19.927.066,46 |
23.996.292,74 |
|
|
|
|
|
|
|
ADDED VALUE |
1.655.488,97 |
2.417.727,56 |
2.564.809,55 |
10,69 |
|
|
|
|
|
|
EBITDA |
753.370,22 |
1.429.141,27 |
1.455.490,60 |
6,07 |
|
|
|
|
|
|
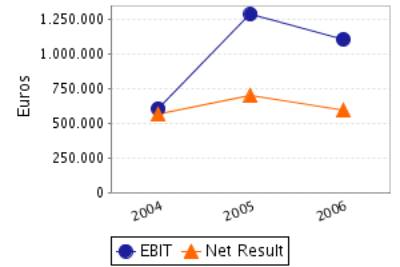
EBIT |
604.924,82 |
1.282.983,00 |
1.103.695,14 |
4,60 |
|
|
|
|
|
|
NET RESULT |
560.610,48 |
695.705,46 |
591.278,11 |
2,46 |
|
|
|
|
|
Balance Sheets Items Analysis
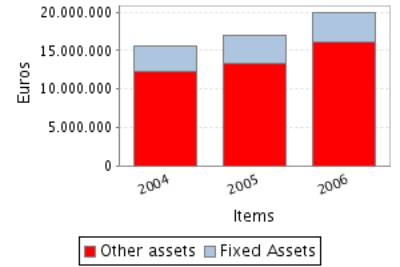
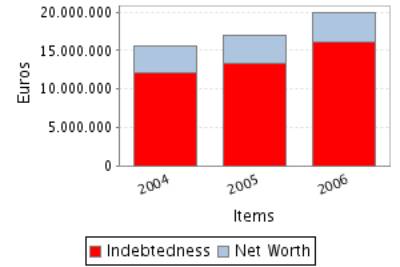
Balance Sheet
Comments
Total assets of the company grew 9,46% between 2004 and 2005.
This growth is a consequence of the fixed assets increase of 14,62%.
This growth has been mainly financed with a debt increase of 10,68%.
Nevertheless the net worth increased 5,16%.
Total assets of the company grew 17,10% between 2005 and 2006.
This growth has been inferior in the case of the fixed assets that
increased just in 3,50%.
This growth has been mainly financed with a debt increase of 20,10%.
Nevertheless the net worth increased 5,99%.
Profit and Loss Account Analysis
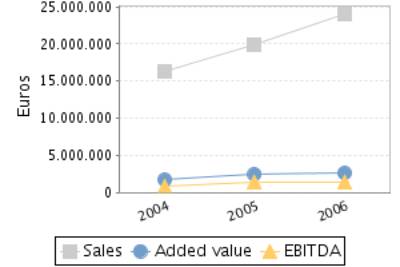
Profit and Loss
Account Comments
The company’s sales figure grew 21,63% between 2004 and 2005.
The company’s EBIT grew 112,09% between 2004 and 2005.
This evolution implies an increase in the company’s operating
profitability.
The result of these variations is an increase of the company’s Economic
Profitability of 93,75% in the analysed period, being this profitability of
7,56% in the year 2005.
The company’s Net Result grew 24,10% between 2004 and 2005.
This evolution, compared to the EBIT’s performance, implies that the
financial and extraordinary activities have had a negative effect in the
company’s Financial Profitability.
The result of these variations is an increase of the company’s Economic
Profitability of 18,01% in the analysed period, being equal to 19,33% in the
year 2005.
The company’s sales figure grew 20,42% between 2005 and 2006.
The company’s EBIT decreased in 13,97% between 2005 and 2006.
This evolution implies a reduction in the company’s operating
profitability.
The result of these variations is a decrease of the company’s Economic
Profitability of 26,54% in the analysed period, being this profitability of
5,55% in the year 2006.
The company’s Net Result decreased in 15,01% between 2005 and 2006.
This evolution, compared to the EBIT’s performance, implies that the
financial and extraordinary activities have had a negative effect in the
company’s Financial Profitability.
The result of these variations is a reduction of the company’s
profitability of 19,81% in the analysed period, being equal to 15,50% in the
year 2006.
ANNUAL FINANCIAL REPORT
ADDITIONAL DATA
Source: annual financial report 2006
Results Distribution
Figures given in €
|
DISTRIBUTION
BASE |
DISTRIBUTION TO |
||
|
Profit and Loss |
591.278,11 |
Retained earnings |
0,00 |
|
Carry Over |
0,00 |
Voluntary Reserve |
409.118,11 |
|
Voluntary reserves |
0,00 |
Prior years losses |
0,00 |
|
Reserves |
0,00 |
Carry Over |
0,00 |
|
Other concepts |
0,00 |
Other funds |
0,00 |
|
Total of Amounts to be distributed |
591.278,11 |
Dividends |
182.160,00 |
|
|
|
Other Applications |
0,00 |
Auditing
Auditors’ opinion: FAVOURABLE WITH
RESERVATIONS
Auditor: C.C. AUDITORES S.A.
Auditing exceptions:
CAMBIO DE CRITERIO EN LA CONTABILIZACION DE LAS DIFERENCIAS POSITIVAS DE
CAMBIO, SEGUN EXPRESA LA SOCIEDAD EN LA NOTA NUMERO 4.J DE LA MEMORIA ADJUNTA,
Y QUE HAN REPRESENTADO UN EFECTO POSITIVO EN LA CUENTA DE PERDIDAS Y GANANCIAS
DE 209.696,37 EUROS.
COMPARATIVE SECTOR ANALYSIS
Values table
Figures expressed in %
|
|
COMPANY (2006) |
SECTOR |
DIFFERENCE |
DIFFERENCE RELATIVE |
|
|
|
|
|
|
BALANCE SHEET ANALYSIS: % on the total
assets |
|
|
|
|
|
|
|
|
|
|
OWN FUNDS |
19,19 |
38,63 |
-19,44 |
-50,32 |
|
|
|
|
|
|
DEBT |
80,81 |
61,37 |
19,44 |
31,67 |
|
|
|
|
|
|
FIXED ASSETS |
19,10 |
26,96 |
-7,86 |
-29,15 |
|
|
|
|
|
|
|
|
|
|
|
|
|
|
|
|
|
|
COMPANY (2006) |
SECTOR |
DIFFERENCE |
DIFFERENCE RELATIVE |
|
|
|
|
|
|
PROFIT AND LOSS ACCOUNT ANALYSIS: % on the total
operating income |
|
|
|
|
|
|
|
|
|
|
SALES |
99,76 |
99,13 |
0,63 |
0,64 |
|
|
|
|
|
|
ADDED VALUE |
10,66 |
14,14 |
-3,48 |
-24,60 |
|
|
|
|
|
|
EBIT |
4,59 |
5,00 |
-0,41 |
-8,22 |
|
|
|
|
|
|
NET RESULT |
2,46 |
3,28 |
-0,82 |
-25,01 |
|
|
|
|
|
Sector Composition
Compared sector (NACE): 515
Number of companies: 889
Size (Sales Figure) : 7.000.000,00 -
40.000.000,00 Euros
Comments on the
sectorial comparative
Compared to its sector the assets of the companies show an inferior
proportion of fixed assets. Specifically the difference with the sector average
is -7,86% , which means a relative difference of -29,15% .
In liabilities composition the company appeals on a wider scale to self
financing, being the proportion of net worth of 19,44% inferior, which means a
relative difference of 50,32% 19,44% more than the sector, which means a
difference of 31,67% .
The proportion that the sales mean to the company’s total ordinary
income is 99,76%, 0,63% higher than in the sector, which means a relative
difference of 0,64% .
The company’s EBIT was positive and was 4,59% with regard to the total
ordinary income, 0,41% less than the sector, which means a relative difference
of 8,22% .
The company’s capacity to generate operating income is equal to that of
the sector as its ratio EBIT/Sales is also equal.
The company’s net result was positive and equal to 2,46% with regard to
the total ordinary income, 0,82% less than the sector, which means a relative
difference of 25,01% .
The financial and extraordinary results and the tax impact have had a
negative impact on the Net result in the company with a worse behaviour than in
the sector; as a consequence, the company shows a worse Net Result/EBIT ratio
(REBEmpresa vs. REBSector).
ADDRESSES
Current Legal Seat Address:
AVENIDA DIAGONAL, 463
08036 BARCELONA
Previous Seat Address:
STREET JONQUERES, 18
08003
BARCELONA
Characteristics of the current
address
Type of premises: office
CORPORATE STRUCTURE
ADMINISTRATIVE LINKS
Main Board members,
Directors and Auditor ![]()
|
POSITION |
SURNAMES AND
NAME |
APPOINTMENT DATE |
|
|
SOLE ADMINISTRATOR |
ZEEVY PAZ |
30/10/2007 |
|
|
AUDITOR |
APPOINTMENT DATE |
||
|
NOVO AGUERO JAIME |
23/04/2008 |
||
Functional Managers
|
POSITION |
SURNAMES AND
NAME |
|
General Manager |
SERRET ANTOLIN MIGUEL |
|
Financial Manager |
SERRET ANTOLIN JOSE MIGUEL |
|
Human Resources Manager |
QUER RIERA FRANCESC |
|
Commercial Manager |
SERRET ANTOLIN JOSE MIGUEL |
|
Purchases Manager |
SERRET ANTOLIN JOSE MIGUEL |
FINANCIAL LINKS
|
|
BUSINESS NAME |
CIF / COUNTRY |
% |
SOURCE |
DATA INF. |
|
|
FACET PEDREROS SA |
A58288168 |
Indet. |
OWN SOURCES |
16/06/2008 |
|
|
BUSINESS NAME |
CIF / COUNTRY |
% |
SOURCE |
DATA INF. |
|
|
FRANGEM SARL |
FRANCIA |
99,98 |
OWN SOURCES |
16/06/2008 |
|
|
FACET DIAMONDS ANTWERPEN BVBA |
BÉLGICA |
99,92 |
OWN SOURCES |
16/06/2008 |
|
|
FACET GEMS LIMITED |
UNITED KINGDOM |
80,00 |
OWN SOURCES |
16/06/2008 |
|
|
FACET JEWELLERY SOLUTIONS S.L. |
B63802789 |
80,00 |
OWN SOURCES |
16/06/2008 |
|
|
FACET PEDREROS SA |
A58288168 |
Indet. |
OWN SOURCES |
16/06/2008 |
You can obtain business information of a foreign company at the
pageD&B International
CREDIT INFORMATION
Constitution Date: 12/01/1987
Foundation Date: 01/01/1987
Founder / Origin: LA TITULAR ES LA
FUNDADORA INICIAL DEL NEGOCIO
Business activity 
Activity: Wholesale of minerals
NACE Code: 5152
NACE Activity: Wholesale of
metals and metal ores
Business: COMPRA VENTA
IMPORTACION EXPORTACION DISTRIBUCION Y PROMOCION DE TODO TIPO DE PIEDRAS
PRECIOSAS Y DEMAS PEDRERIA
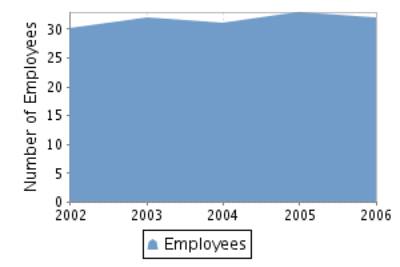
Employees 
Number of total employees: 40 (2008)
Number of fixed employees: 81,25%
Number of temporary employees: 18,75%
Employees evolution
COMMERCIAL OPERATIONS 
|
ENTITY |
BRANCH |
ADDRESS |
TOWN OR CITY |
PROVINCE |
|
BANCO BILBAO VIZCAYA ARGENTARIA, S.A. |
|
|
BARCELONA |
|
|
BANCO DE SABADELL, S.A. |
0025 |
PASSEIG DE GRACIA 000036 |
BARCELONA |
Barcelona |
|
BANCO POPULAR ESPAÑOL, S.A. |
0002 |
PASSEIG DE GRACIA, 17 |
BARCELONA |
Barcelona |
|
CAJA DE AHORROS Y PENSIONES DE BARCELONA |
0900 |
VIA LAIETANA, 56 |
BARCELONA |
Barcelona |
|
DEUTSCHE BANK A.G., S.E. |
0002 |
PASEO DE GRACIA,111 12 |
BARCELONA |
Barcelona |
5 bank entities registered
Brands, Signs and Commercial
Names 
Brand name: FACET (Valid)
Type: JOINT Date: 19/05/1997
Name: FACET PEDREROS, S.A. (Valid)
Type: DENOMINATIVE Date: 16/11/1990
LEGAL STRUCTURE
Constitution Data
Register Date: 12/01/1987
Current Legal Form: JOINT STOCK
COMPANY
Current Capital:
1.138.500,00 €
Legal Aspects
Obligation to fill in Financial
Statements: YES
Chamber census: YES (2006)
Listed on a Stock Exchange: NO
B.O.R.M.E.(Official Companies
Registry Gazette) 
Registered Proceedings
|
PROCEEDINGS |
DATE |
NOTICE NUM. |
TRADE REG. |
|
Resignations |
23/04/2008 |
208711 |
Barcelona |
|
Appointments |
23/04/2008 |
208711 |
Barcelona |
|
Appointments |
27/11/2007 |
587757 |
Barcelona |
|
Appointments |
30/10/2007 |
539370 |
Barcelona |
Other Proceedings published
|
PROCEEDINGS |
DATE |
NOTICE NUM. |
TRADE REG. |
|
Registration of accounts (2006) Individual |
06/11/2007 |
961713 |
Barcelona |
Press articles

16/02/2001 VANGUARDIA (INFORMATION ON LEGAL ANNOUNCE)
EN JUNTA GRAL. UNIVERSAL CELEBRADA EL 09/02/01 SE ACORDO TRASLADAR EL
DOMICILIO SOCIAL A LA AV. DIAGONAL, 463, BIS, CUARTO, DE BARCELONA.
FINANCIAL INFORMATION
The information on the last account contained in this report is extracted
from the Mercantile Register file of the legal address of the Company and
dated 08/10/2007.
BALANCE SHEET
Assets
Figures given in €
|
|
31/12/2004 (12) |
31/12/2005 (12) |
31/12/2006 (12) |
|
A) DUE FROM SHAREHOLDERS FOR UNCALLED CAPITAL |
|
|
|
|
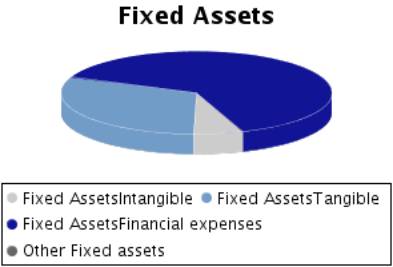
B) FIXED ASSETS |
3.201.469,03 |
3.669.680,10 |
3.798.009,93 |
|
I. Incorporation costs |
|
|
|
|
II. Intangible fixed assets |
141.563,95 |
216.199,12 |
225.175,88 |
|
R & D expenses |
|
|
|
|
Concessions, patents, licences , trademarks |
|
|
|
|
Goodwill |
|
|
|
|
Acquired rights from finance leases |
|
|
|
|
Software |
178.040,96 |
210.352,96 |
254.005,91 |
|
Leasing |
119.333,94 |
192.195,84 |
173.048,95 |
|
Cash advance |
|
|
|
|
Provisions |
|
|
|
|
Depreciation |
-155.810,95 |
-186.349,68 |
-201.878,98 |
|
III. Tangible fixed assets |
1.222.517,28 |
1.179.093,58 |
1.165.562,39 |
|
Property, plant and equipment |
849.811,42 |
849.811,42 |
849.811,42 |
|
Machinery, equipment and other |
30.273,57 |
31.908,77 |
32.126,91 |
|
Other property plant and equipment |
461.285,11 |
480.689,55 |
506.714,91 |
|
Prepaid expenses on fixed assets |
|
|
|
|
Other assets |
224.159,00 |
200.825,22 |
298.777,87 |
|
Provisions |
|
|
|
|
Depreciation |
-343.011,82 |
-384.141,38 |
-521.868,72 |
|
IV. Financial fixed assets |
1.730.832,60 |
2.167.832,20 |
2.407.271,66 |
|
Shares in affiliated companies |
629.652,34 |
1.589.702,34 |
1.804.389,09 |
|
Receivables in affiliated companies |
551.588,24 |
|
|
|
Shares in associated companies |
|
|
|
|
Loans to associated companies |
|
|
|
|
Securities |
|
|
611.246,25 |
|
Other loans |
496.422,03 |
128.598,80 |
114.203,64 |
|
Long term deposits and guarantees |
103.159,99 |
499.521,06 |
488.678,93 |
|
Provisions |
-49.990,00 |
-49.990,00 |
-611.246,25 |
|
Taxes receivable |
|
|
|
|
V.Owners equity |
106.555,20 |
106.555,20 |
|
|
VI.Long term trade liabilities |
|
|
|
|
C) DEFERRED EXPENSES |
11.848,80 |
16.483,06 |
16.748,47 |
|
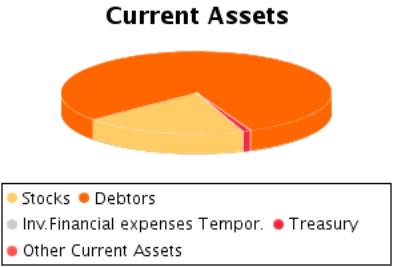
D) CURRENT ASSETS |
12.296.654,84 |
13.291.762,56 |
16.067.149,45 |
|
I. Shareholders by required outlays |
|
|
|
|
II. Stocks |
3.952.965,74 |
2.105.037,59 |
3.113.563,81 |
|
Goods available for sale |
3.952.965,74 |
2.105.037,59 |
3.113.563,81 |
|
Raw material inventory |
|
|
|
|
Work in Progress |
|
|
|
|
Finished goods |
|
|
|
|
Subproducts and recycled materials |
|
|
|
|
Cash advance |
|
|
|
|
Provisions |
|
|
|
|
III. Debtors |
8.206.715,41 |
10.931.862,11 |
12.796.674,79 |
|
Clients |
7.815.288,65 |
7.262.793,02 |
8.777.540,56 |
|
Amounts owned by affiliated companies |
558.608,65 |
3.733.012,86 |
2.998.083,46 |
|
Amounts owned by associated companies |
|
|
|
|
Other debts |
25.542,03 |
53.611,18 |
1.216.911,14 |
|
Staff Expenses |
5.535,24 |
20.187,70 |
17.657,95 |
|
Government |
21.971,11 |
18.303,79 |
110.578,25 |
|
Provisions |
-220.230,27 |
-156.046,44 |
-324.096,57 |
|
IV. Temporary financial investment |
|
|
2.633,33 |
|
Shares in affiliated companies |
|
|
|
|
Receivables in affiliated companies |
|
|
|
|
Shares in associated companies |
|
|
|
|
Loans to associated companies |
|
|
|
|
Short term investment |
|
|
|
|
Other loans |
|
|
2.633,33 |
|
Short Term Deposit and guarantees |
|
|
|
|
Provisions |
|
|
|
|
V. Short-term own shares |
|
|
|
|
VI. Treasury |
127.558,07 |
254.318,48 |
146.819,15 |
|
VII. Periodification adjustments |
9.415,62 |
544,38 |
7.458,37 |
|
ASSETS (A + B + C + D) |
15.509.972,67 |
16.977.925,72 |
19.881.907,85 |
Assets composition
Liabilities
Figures given in €
|
|
31/12/2004 (12) |
31/12/2005 (12) |
31/12/2006 (12) |
|
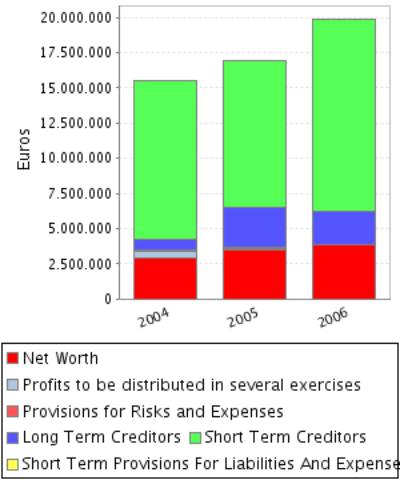
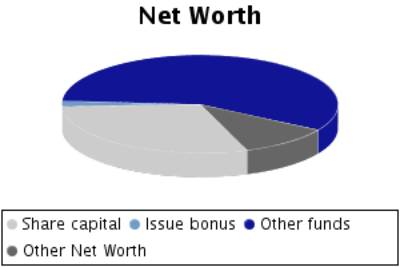
A) SHAREHOLDERS EQUITY |
2.919.289,49 |
3.510.632,45 |
3.815.388,06 |
|
I. Share capital |
1.138.500,00 |
1.138.500,00 |
1.138.500,00 |
|
II. Issue bonus |
64.900,00 |
64.900,00 |
64.900,00 |
|
III.Revaluation reserve |
|
|
|
|
IV.Reserves |
1.155.279,01 |
1.611.526,99 |
2.202.869,95 |
|
Retained earnings |
227.700,35 |
227.700,35 |
227.700,35 |
|
Sinking fund from owner equity |
106.555,20 |
106.555,20 |
|
|
Reserve for the parent company capital |
|
|
|
|
Statutory reserve |
|
|
|
|
Other funds |
820.935,11 |
1.277.183,09 |
1.975.081,25 |
|
Capital adjustments in Euros |
88,35 |
88,35 |
88,35 |
|
V.Results from previous years |
|
|
|
|
Carry Over |
|
|
|
|
Prior years losses |
|
|
|
|
Loans from partners for losses compensation |
|
|
|
|
VI.Profit and Losses |
560.610,48 |
695.705,46 |
591.278,11 |
|
VII.Dividend paid during the year |
|
|
-182.160,00 |
|
VIII.Own shares for capital reduction |
|
|
|
|
B) DEFERRED INCOME |
503.957,26 |
89.172,26 |
|
|
Capital grants |
|
|
|
|
Positive change difference |
503.957,26 |
89.172,26 |
|
|
Other deferred income |
|
|
|
|
Fiscal deferred income |
|
|
|
|
C) PROVISIONS FOR LIABILITIES AND EXPENSES |
43.671,26 |
52.296,54 |
|
|
Provision for pensions plans |
|
|
|
|
Provision for taxes |
|
|
|
|
Other provisions |
43.671,26 |
52.296,54 |
|
|
Reversion fund |
|
|
|
|
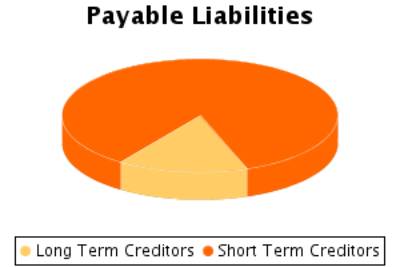
D) LONG TERM LIABILITIES |
750.472,21 |
2.853.975,86 |
2.458.661,50 |
|
I.Negotiable bonds and other negotiable values |
|
|
|
|
Non convertible securities |
|
|
|
|
Convertible securities |
|
|
|
|
Other convertible debentures |
|
|
|
|
II.Debt with bank entities |
600.219,18 |
2.637.062,83 |
2.241.748,47 |
|
Long term bank loans |
600.219,18 |
2.637.062,83 |
2.241.748,47 |
|
Leasing |
|
|
|
|
III.Debts with associated and affiliated
companies |
|
|
|
|
With affiliated companies |
|
|
|
|
Associated companies |
|
|
|
|
IV. Other creditors |
150.253,03 |
216.913,03 |
216.913,03 |
|
Bills payable |
|
|
|
|
Other debts |
150.253,03 |
210.253,03 |
210.253,03 |
|
Long term deposit and guaranties |
|
6.660,00 |
6.660,00 |
|
Taxes receivable |
|
|
|
|
V. Deferred debts on shares |
|
|
|
|
From affiliated companies |
|
|
|
|
From associated companies |
|
|
|
|
Other companies |
|
|
|
|
VI. Long term debt with creditor |
|
|
|
|
E) SHORT TERM LIABILITIES |
11.292.582,45 |
10.471.848,61 |
13.607.858,29 |
|
I.Negotiable bonds and other negotiable values |
|
|
|
|
Non convertible securities |
|
|
|
|
Convertible securities |
|
|
|
|
Other convertible debentures |
|
|
|
|
Interests from bonds |
|
|
|
|
II.Debt with bank entities |
4.980.919,58 |
6.488.429,34 |
6.568.582,58 |
|
Loans and other debts |
4.980.452,18 |
6.488.429,34 |
6.568.582,58 |
|
Debt interest |
467,40 |
|
|
|
Leasing |
|
|
|
|
III. Short term debts with associated and
affiliated companies |
|
|
|
|
With affiliated companies |
|
|
|
|
Associated companies |
|
|
|
|
IV. Commercial creditors |
5.855.841,96 |
3.266.586,78 |
6.372.108,94 |
|
Accounts payable |
|
|
|
|
Expenses |
5.855.841,96 |
3.266.586,78 |
6.372.108,94 |
|
Bills payable |
|
|
|
|
V. Other non-commercial debt |
440.689,72 |
673.347,16 |
667.166,77 |
|
Government |
362.267,59 |
537.227,38 |
482.388,76 |
|
Bills payable |
|
|
|
|
Other debts |
78.422,13 |
136.119,78 |
184.778,01 |
|
Accounts receivable |
|
|
|
|
Short term deposits and guarantees |
|
|
|
|
VI. Provisions for current assets |
15.131,19 |
43.485,33 |
|
|
VII. Periodification adjustments |
|
|
|
|
F) SHORT TERM PROVISIONS FOR LIABILITIES AND
EXPENSES |
|
|
|
|
LIABILITIES (A + B + C + D + E + F) |
15.509.972,67 |
16.977.925,72 |
19.881.907,85 |
Liabilities
Composition
PROFIT AND LOSS ACCOUNT
Itams of the Profit
and Loss Account
Figures given in €
|
|
31/12/2004 (12) |
31/12/2005 (12) |
31/12/2006 (12) |
|
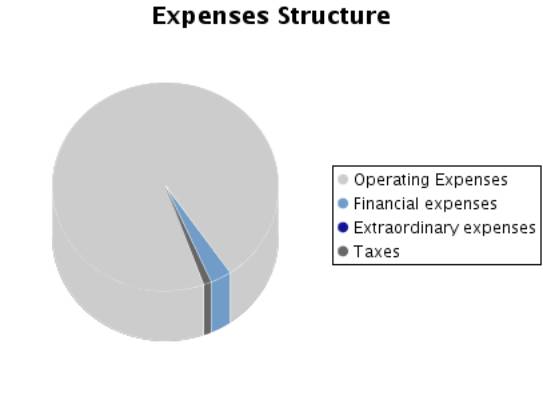
A) EXPENSES (A.1 a A.15) |
16.418.525,05 |
19.833.166,83 |
24.481.779,65 |
|
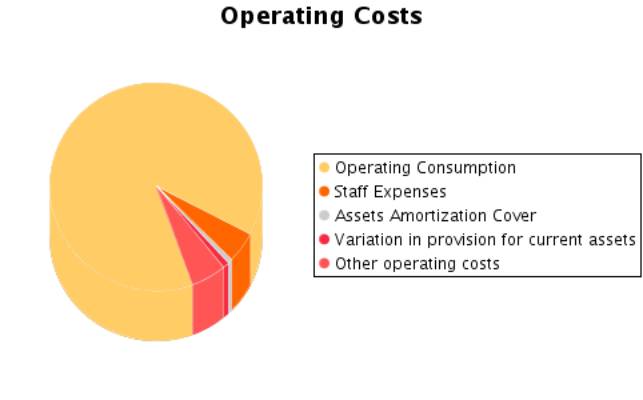
A.1.Operating costs |
13.967.434,82 |
16.722.231,26 |
20.240.642,25 |
|
A.2. Labour cost |
902.118,75 |
988.586,29 |
1.109.318,95 |
|
Wages |
731.617,62 |
798.323,48 |
886.433,26 |
|
Social security expenses |
170.501,13 |
190.262,81 |
222.885,69 |
|
A.3. Assets depreciation |
141.922,06 |
135.048,84 |
153.256,64 |
|
A.4. Variation in provision for current assets |
6.523,34 |
11.109,43 |
198.538,82 |
|
A.5. Other operating costs |
814.850,14 |
853.103,24 |
1.249.123,07 |
|
A.I. OPERATING RESULT (B.1-A.1-A.2-A.3-A.4-A.5) |
604.924,82 |
1.282.983,00 |
1.103.695,14 |
|
A.6.Financial expenses and similar |
207.958,83 |
269.797,88 |
407.222,37 |
|
Debts with related companies |
|
|
|
|
Debts with associated companies |
|
|
|
|
By debts with third parties and similar expenses |
207.958,83 |
269.797,88 |
407.222,37 |
|
Losses from financial investments |
|
|
|
|
A.7. Variation in financial investment provision |
|
|
|
|
A.8.Negative exchange difference |
172.667,41 |
643.419,06 |
316.576,73 |
|
A.II.POSITIVE FINANCIAL RESULTS
(B.2+B.3-A.6-A.7-A.8) |
134.265,50 |
|
8.151,98 |
|
A.III.PROFIT FROM ORDINARY ACTIVITIES
(A.I+A.II-B.I-B.II) |
739.190,32 |
785.806,52 |
1.111.847,12 |
|
A.9. Variation in provision in fixed assets |
|
|
561.256,25 |
|
A.10. Losses in fixed assets |
|
|
|
|
A.11. Losses from own shares and bonds |
|
|
|
|
A.12. Extraordinary charges |
43.730,32 |
8.625,28 |
|
|
A.13.Other exercises’ expenses and losses |
|
|
|
|
A.IV.POSITIVE EXTRAORDINARY RESULT
(B.4+B.5+B.6+B.7+B.8-A.9-A.10-A.11-A.12-A.13) |
|
111.144,49 |
|
|
A.V.PROFIT BEFORE TAXES (A.III+A.IV-B.III-B.IV) |
721.929,86 |
896.951,01 |
837.122,68 |
|
A.14.Corporate Taxes |
161.319,38 |
201.245,55 |
245.844,57 |
|
A.15. Other taxes |
|
|
|
|
A.VI.EXERCISE RESULT (PROFIT) (A.V-A.14-A.15) |
560.610,48 |
695.705,46 |
591.278,11 |
|
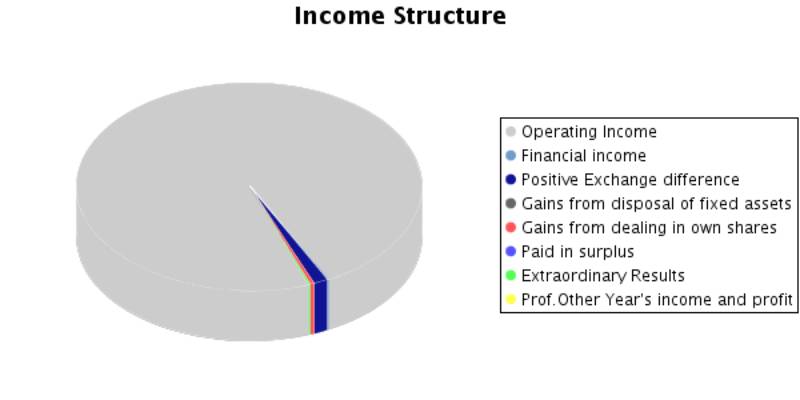
B) INCOMES (B.1 a B.8) |
16.979.135,53 |
20.528.872,29 |
25.073.057,76 |
|
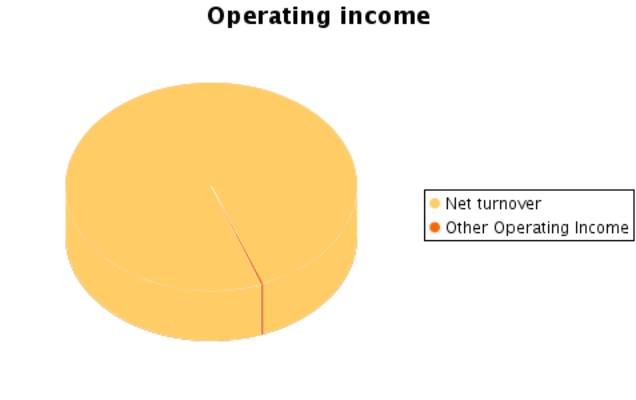
B.1.Operating income |
16.437.773,93 |
19.993.062,06 |
24.054.574,87 |
|
Turnover |
16.383.720,40 |
19.927.066,46 |
23.996.292,74 |
|
Other operating income |
54.053,53 |
65.995,60 |
58.282,13 |
|
B.I.OPERATING LOSSES (A.1+A.2+A.3+A.4+A.5-B.1) |
|
|
|
|
B.2.Financial Income |
45.911,91 |
70.412,79 |
94.657,71 |
|
From affiliated companies |
16.716,33 |
34.625,36 |
60.576,02 |
|
From associated companies |
|
|
|
|
Other |
29.195,58 |
35.787,43 |
34.081,69 |
|
Gains from investments |
|
|
|
|
B.3. Positive change difference |
468.979,83 |
345.627,67 |
637.293,37 |
|
B.II. NEGATIVE FINANCIAL RESULTS
(A.6+A.7+A.8-B.2-B.3) |
|
497.176,48 |
|
|
B.III.LOSSES FROM ORDINARY ACTIVITIES
(B.I+B.II-A.I-A.II) |
|
|
|
|
B.4.B.9. Gains from disposal of fixed assets |
|
19.938,93 |
|
|
B.5.Gains from dealing in own shares |
|
|
208.180,80 |
|
B.6. Paid in surplus |
|
|
|
|
B.7. Extraordinary income |
26.469,86 |
99.830,84 |
78.351,01 |
|
B.8.Other year’s income and profits |
|
|
|
|
B.IV.NEGATIVE EXTRAORDINARY LOSSES
(A.9+A.10+A.11+A.12+A.13-B.4-B.5-B.6-B.7-B.8) |
17.260,46 |
|
274.724,44 |
|
B.V.LOSS BEFORE TAXES (B.III+B.IV-A.III-A.IV) |
|
|
|
|
B.VI.EXERCISE RESULTS (LOSS) (B.V+A.14+A.15) |
|
|
|
Composition of the
Profit and Loss Account
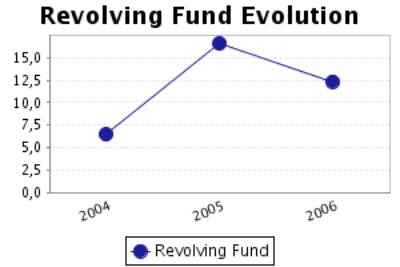
FINANCIAL BALANCE
Here the Main Capital Amounts of the company and the Revolving Fund
Evolution are analysed.
Financial Balance
Table
Figures given in €
|
|
31/12/2004 (12) |
% |
31/12/2005 (12) |
% |
31/12/2006 (12) |
% |
|
A) DUE FROM
SHAREHOLDERS FOR UNCALLED CAPITAL |
|
|
|
|
|
|
|
B) FIXED ASSETS |
3.201.469,03 |
20,64 |
3.669.680,10 |
21,61 |
3.798.009,93 |
19,10 |
|
C) DEFERRED
EXPENSES |
11.848,80 |
0,08 |
16.483,06 |
0,10 |
16.748,47 |
0,08 |
|
D) CURRENT
ASSETS |
12.296.654,84 |
79,28 |
13.291.762,56 |
78,29 |
16.067.149,45 |
80,81 |
|
ASSETS (A + B +
C + D) |
15.509.972,67 |
|
16.977.925,72 |
|
19.881.907,85 |
|
|
|
||||||
|
A) SHAREHOLDERS
EQUITY |
2.919.289,49 |
18,82 |
3.510.632,45 |
20,68 |
3.815.388,06 |
19,19 |
|
B) DEFERRED
INCOME |
503.957,26 |
3,25 |
89.172,26 |
0,53 |
|
|
|
C) PROVISIONS
FOR LIABILITIES AND EXPENSES |
43.671,26 |
0,28 |
52.296,54 |
0,31 |
|
|
|
D) LONG TERM
LIABILITIES |
750.472,21 |
4,84 |
2.853.975,86 |
16,81 |
2.458.661,50 |
12,37 |
|
E) SHORT TERM
LIABILITIES |
11.292.582,45 |
72,81 |
10.471.848,61 |
61,68 |
13.607.858,29 |
68,44 |
|
F) SHORT TERM
PROVISIONS FOR LIABILITIES AND EXPENSES |
|
|
|
|
|
|
|
LIABILITIES (A + B + C + D + E + F) |
15.509.972,67 |
|
16.977.925,72 |
|
19.881.907,85 |
|
Financial Balance
Composition
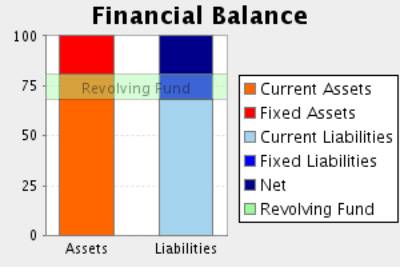
Comments on Financial
Balance
In the 2004, the assets of the company were formed in 20,72% of Fixed
Assets and in 79,28% of Current Assets.This assets were financed in 22,07% with
own capitals, and in 5,12% with long term debt and in 72,81% with current
liabilities.
The result of this financial structure is a positive turnover fund of
1.004.072,39 Euros, which is equivalent to 6,47% proportion of the
company’s total assets.
In the 2005, the assets of the company were formed in 21,71% of Fixed
Assets and in 78,29% of Current Assets.This assets were financed in 21,20% with
own capitals, and in 17,12% with long term debt and in 61,68% with current
liabilities.
The result of this financial structure is a positive turnover fund of
2.819.913,95 Euros, which is equivalent to 16,61% proportion of the
company’s total assets.
This measure has increased with respect to the previous exercise in
180,85% having also increased its proportion with respect to the total assets
of the company.
In the 2006, the assets of the company were formed in 19,19% of Fixed
Assets and in 80,81% of Current Assets.This assets were financed in 19,19% with
own capitals, and in 12,37% with long term debt and in 68,44% with current
liabilities.
The result of this financial structure is a positive turnover fund of
2.459.291,16 Euros, which is equivalent to 12,37% proportion of the
company’s total assets.
This measure has diminished with respect to the previous exercise in
12,79% having also diminished its proportion with respect to the total assets
of the company.
RATIOS
Main Ratios
|
|
31/12/2004 (12) |
31/12/2005 (12) |
31/12/2006 (12) |
|
STRUCTURAL RATIOS |
|
|
|
|
Management fund |
1.004.072,39 |
2.819.913,95 |
2.459.291,16 |
|
Management Fund Requirement |
5.857.433,90 |
9.054.024,81 |
8.878.421,26 |
|
Indebtedness (%) |
77,93 |
78,80 |
80,81 |
|
External Funds on Net Worth |
3,53 |
3,72 |
4,21 |
|
GENERAL ACTIVITY RATIO |
|
|
|
|
Turnover Increase (%) |
26,76 |
21,63 |
20,42 |
|
Added value growth (%) |
17,34 |
46,04 |
6,08 |
|
Cash Flow |
709.055,88 |
841.863,73 |
1.504.329,82 |
|
Labour Productivity |
1,84 |
2,45 |
2,31 |
|
Assets turnover |
1,06 |
1,17 |
1,21 |
|
Breakdown Point |
12.412.570,51 |
12.150.785,80 |
17.093.540,15 |
|
Security Margin of the Breakdown Point (%) |
24,49 |
39,22 |
28,94 |
|
ACTIVITY RATIOS |
|
|
|
|
Average Payment Period |
151 |
70 |
113 |
|
Average Collection Period |
180 |
197 |
192 |
|
Inventory Turnover Period |
87 |
38 |
47 |
|
SOLVENCY RATIOS |
|
|
|
|
Payback Capacity |
0,06 |
0,06 |
0,09 |
|
Assets Guarantee |
1,28 |
1,27 |
1,24 |
|
Short Term Debts Proportion (%) |
93,43 |
78,28 |
84,70 |
|
Interest Coverage |
0,81 |
1,13 |
-0,18 |
|
LIQUIDITY RATIOS |
|
|
|
|
Current Ratio |
1,09 |
1,27 |
1,18 |
|
Immediate liquidity |
0,01 |
0,02 |
0,01 |
|
Treasury |
-4.853.361,51 |
-6.234.110,86 |
-6.419.130,10 |
|
Sales on Current Assets |
480 |
540 |
538 |
Results Analysis
Ratios
|
|
31/12/2004 (12) |
31/12/2005 (12) |
31/12/2006 (12) |
|
Economic profitability (%) |
3,90 |
7,56 |
5,55 |
|
Operating Profitability (%) |
3,69 |
6,44 |
4,60 |
|
Equity gearing |
5,54 |
2,89 |
5,25 |
|
Financial profitability (%) |
16,38 |
19,33 |
15,50 |
|
General Profitability (%) |
3,42 |
3,49 |
2,46 |
Comments on the
Results Analysis Ratios
The economic profitability in the year2005 achieved a 7,56% positive
level, due to a 6,44% economic margin and to an assets turnover of1,17%.
The economic profitability in the year has increased from 3,90% up to
7,56%. This growth is due to the economic margin increase, from 3,69% to the
current 6,44Y%, and to the assets turnover index, which in the last period has
achieved 1,17, compared to 1,06 del 2004.
Financial profitability on 2005 achieved a 19,33%.
The company’s financial structure has instigated its economic
profitability with an indebtedness level of 2,89.
The general profitability on 2005 achieved a 3,49%.
The economic profitability in the year2006 achieved a 5,55% positive
level, due to a 4,60% economic margin and to an assets turnover of1,21%.
The economic profitability in the year has reduced from 7,56% up to
5,55% of2006, even if it remains positive. Assets turnover increase whose index
has passed from 1,17 to 1,21, could not compensate operating profitability
reduction from6,44% to the current level of 4,60%.
Financial profitability on 2006 achieved a 15,50%.
The company’s financial structure has instigated its economic
profitability with an indebtedness level of 5,25.
The general profitability on 2006 achieved a 2,46%.
SECTORIAL ANÁLYSIS
Large Capital Amounts
and Financial Balance
Figures given in %
|
|
COMPANY (2006) |
SECTOR |
DIFFERENCE |
DIFFERENCE RELATIVE |
|
|
|
|
|
|
ASSETS |
|
|
|
|
|
|
|
|
|
|
A) DUE FROM SHAREHOLDERS FOR UNCALLED CAPITAL |
|
0,02 |
|
|
|
|
|
|
|
|
B) FIXED ASSETS |
19,10 |
26,96 |
-7,86 |
-29,16 |
|
|
|
|
|
|
C) DEFERRED EXPENSES |
0,08 |
0,34 |
-0,26 |
-76,33 |
|
|
|
|
|
|
D) CURRENT ASSETS |
80,81 |
72,68 |
8,13 |
11,19 |
|
|
|
|
|
|
ASSETS (A + B + C + D) |
100 |
100 |
|
|
|
|
|
|
|
|
|
|
|
|
|
|
|
|
|
|
|
|
COMPANY (2006) |
SECTOR |
DIFFERENCE |
DIFFERENCE RELATIVE |
|
|
|
|
|
|
LIABILITIES |
|
|
|
|
|
|
|
|
|
|
A) SHAREHOLDERS EQUITY |
19,19 |
38,43 |
-19,24 |
-50,07 |
|
|
|
|
|
|
B) DEFERRED INCOME |
|
0,20 |
|
|
|
|
|
|
|
|
C) PROVISIONS FOR LIABILITIES AND EXPENSES |
|
0,62 |
|
|
|
|
|
|
|
|
D) LONG TERM
LIABILITIES |
12,37 |
8,08 |
4,28 |
53,00 |
|
|
|
|
|
|
E) SHORT TERM
LIABILITIES |
68,44 |
52,66 |
15,78 |
29,96 |
|
|
|
|
|
|
F) SHORT TERM
PROVISIONS FOR LIABILITIES AND EXPENSES |
|
0,01 |
|
|
|
|
|
|
|
|
LIABILITIES (A + B + C + D + E + F) |
100 |
100 |
|
|
|
|
|
|
|
Financial Balance
Composition
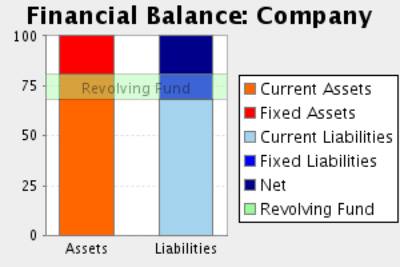
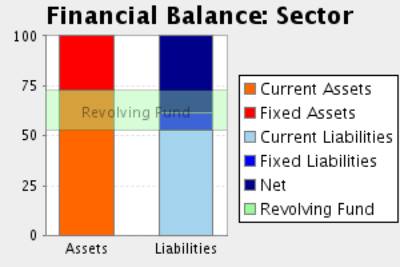
Comments to the
Sectorial Analysis
In the 2006, the assets of the company were formed in 19,19% of fixed
assets and in 80,81Current Assets % In the sector, the proportion of fixed
assets was of 27,32%, 29,76% superior, and the proportion of current assets was
of 72,68%, 11,19% inferior.
The assets were financed in the company in 19,19% with own capitals , in
12,37% with fixed liabilities and in 68,44% with current liabilities In the
sector, the self financing represented 38,63%, 50,32% superior. On the other
hand the long term debts represented in the sector an average of 8,70%
financing, with a relative difference of 42,15% in favour of the companyAnd,
short term liabilities represented in the sector an average of 52,67% financing,
with a relative difference of 29,94% in favour of the company
The result of this company’s financial structure is a turnover fund that
represents 12,37% of the total assets; in the sector, this same proportion is
20,01%, therefore, we can say that the company’s turnover fund is 38,17%
smaller than the sector one.
Analytical Account of
Results
Figures given in %
|
|
COMPANY (2006) |
SECTOR |
DIFFERENCE |
DIFFERENCE RELATIVE |
|
Turnover |
99,76 |
99,13 |
0,63 |
0,64 |
|
Other operating income |
0,24 |
0,87 |
-0,63 |
-72,51 |
|
Production Value |
100,00 |
100,00 |
0,00 |
0,00 |
|
Operating expenses |
84,14 |
77,71 |
6,43 |
8,28 |
|
Other operation expenses |
5,19 |
8,15 |
-2,96 |
-36,32 |
|
Added value |
10,66 |
14,14 |
-3,48 |
-24,62 |
|
Labour cost |
4,61 |
7,54 |
-2,93 |
-38,85 |
|
Gross Economic Result |
6,05 |
6,60 |
-0,55 |
-8,37 |
|
Assets depreciation |
0,64 |
1,28 |
-0,64 |
-50,00 |
|
Variation in provision for current assets and bad debt losses |
0,83 |
0,32 |
0,51 |
156,17 |
|
Net Economic Result |
4,59 |
5,00 |
-0,41 |
-8,18 |
|
Financial income |
3,04 |
0,64 |
2,40 |
375,74 |
|
Financial Charges |
3,01 |
0,84 |
2,18 |
260,48 |
|
Variation in financial investment provision |
|
0,02 |
|
|
|
Ordinary Activities Result |
4,62 |
4,78 |
-0,16 |
-3,43 |
|
Extraordinary income |
1,19 |
0,52 |
0,67 |
127,97 |
|
Extraordinary charges |
|
0,46 |
|
|
|
Variation in provision in fixed assets |
2,33 |
0,06 |
2,28 |
4.136,36 |
|
Results before Taxes |
3,48 |
4,79 |
-1,31 |
-27,29 |
|
Corporate taxes |
1,02 |
1,51 |
-0,49 |
-32,36 |
|
Net Result |
2,46 |
3,28 |
-0,82 |
-24,95 |
|
Assets depreciation |
0,64 |
1,28 |
-0,64 |
-50,00 |
|
Change of Provisions |
3,16 |
0,40 |
2,76 |
693,97 |
|
Net Self-Financing |
6,25 |
4,96 |
1,29 |
26,11 |
Main Ratios
|
|
COMPANY (2006) |
PTILE25 |
PTILE50 |
PTILE75 |
|
STRUCTURAL RATIOS |
|
|
|
|
|
Management fund |
2.459.291,16 |
363,57 |
1.221,65 |
2.688,68 |
|
Management Fund Requirement |
8.878.421,26 |
-1.914,86 |
-207,60 |
920,11 |
|
Indebtedness (%) |
80,81 |
48,79 |
66,67 |
80,16 |
|
External Funds on Net Worth |
4,21 |
0,95 |
2,00 |
4,04 |
|
GENERAL ACTIVITY RATIO |
|
|
|
|
|
Turnover Increase (%) |
20,42 |
0,31 |
8,47 |
18,06 |
|
Added value growth (%) |
6,08 |
-7,30 |
5,63 |
18,74 |
|
Cash Flow |
1.504.329,82 |
252,22 |
522,64 |
936,04 |
|
Labour Productivity |
2,31 |
1,48 |
1,81 |
2,42 |
|
Assets turnover |
1,21 |
1,25 |
1,64 |
2,22 |
|
Breakdown Point |
17.093.540,15 |
6.944.229,48 |
9.388.034,71 |
14.205.462,50 |
|
Security Margin of the Breakdown Point (%) |
28,94 |
11,18 |
19,70 |
31,33 |
|
ACTIVITY RATIOS |
|
|
|
|
|
Average Payment Period |
113 |
29 |
69 |
111 |
|
Average Collection Period |
192 |
70 |
103 |
130 |
|
Inventory Turnover Period |
47 |
19 |
40 |
68 |
|
SOLVENCY RATIOS |
|
|
|
|
|
Payback Capacity |
0,09 |
0,06 |
0,11 |
0,22 |
|
Assets Guarantee |
1,24 |
1,24 |
1,50 |
2,04 |
|
Short Term Debts Proportion (%) |
84,70 |
82,70 |
94,68 |
99,57 |
|
Interest Coverage |
-0,18 |
1,98 |
4,83 |
12,09 |
|
LIQUIDITY RATIOS |
|
|
|
|
|
Current Ratio |
1,18 |
1,08 |
1,30 |
1,74 |
|
Immediate liquidity |
0,01 |
0,03 |
0,09 |
0,26 |
|
Treasury |
-6.419.130,10 |
-1.886,00 |
-293,73 |
376,02 |
|
Sales on Current Assets |
538 |
614 |
761 |
1.015 |
Results Analysis
Ratios
|
|
COMPANY (2006) |
PTILE25 |
PTILE50 |
PTILE75 |
|
Economic profitability (%) |
5,55 |
3,48 |
6,39 |
10,50 |
|
Operating Profitability (%) |
4,60 |
1,91 |
3,64 |
6,60 |
|
Equity gearing |
5,25 |
1,68 |
2,46 |
4,00 |
|
Financial profitability (%) |
15,50 |
7,41 |
12,53 |
20,60 |
|
General Profitability (%) |
2,46 |
1,03 |
2,31 |
4,57 |
FOREIGN EXCHANGE
RATES
|
Currency |
Unit
|
Indian Rupees |
|
US Dollar |
1 |
Rs.42.54 |
|
UK Pound |
1 |
Rs.84.86 |
|
Euro |
1 |
Rs.66.95 |
RATING
EXPLANATIONS
|
RATING |
STATUS |
PROPOSED CREDIT LINE |
|
|
>86 |
Aaa |
Possesses an extremely sound financial base with the strongest
capability for timely payment of interest and principal sums |
Unlimited |
|
71-85 |
Aa |
Possesses adequate working capital. No caution needed for credit
transaction. It has above average (strong) capability for payment of interest
and principal sums |
Large |
|
56-70 |
A |
Financial & operational base are regarded healthy. General
unfavourable factors will not cause fatal effect. Satisfactory capability for
payment of interest and principal sums |
Fairly Large |
|
41-55 |
Ba |
Overall operation is considered normal. Capable to meet normal
commitments. |
Satisfactory |
|
26-40 |
B |
Unfavourable & favourable factors carry similar weight in credit
consideration. Capability to overcome financial difficulties seems
comparatively below average. |
Small |
|
11-25 |
Ca |
Adverse factors are apparent. Repayment of interest and principal sums
in default or expected to be in default upon maturity |
Limited with
full security |
|
<10 |
C |
Absolute credit risk exists. Caution needed to be exercised |
Credit not
recommended |
|
NR |
In view of the lack of information, we have no basis upon which to
recommend credit dealings |
No Rating |
|
This score serves as a reference to assess SC’s credit risk
and to set the amount of credit to be extended. It is calculated from a composite
of weighted scores obtained from each of the major sections of this report. The
assessed factors and their relative weights (as indicated through %) are as
follows:
Financial
condition (40%) Ownership
background (20%) Payment
record (10%)
Credit history
(10%) Market trend
(10%) Operational
size (10%)