![]()
MIRA
INFORM REPORT
|
Report Date : |
30.05.2008 |
IDENTIFICATION
DETAILS
|
Name : |
ROMANI IMPORT EXPORT SL |
|
|
|
|
Registered Office : |
Street Ponent (Pg Industrial Juan Carlos I), 12, Cp 46440, Almussafes Valencia |
|
|
|
|
Country : |
Spain |
|
|
|
|
Financials (as on) : |
2007 |
|
|
|
|
Date of Incorporation : |
|
|
|
|
|
Legal Form : |
Limited Liability Company |
|
|
|
|
Line of Business : |
RATING &
COMMENTS
|
MIRA’s Rating : |
Aa |
|
RATING |
STATUS |
PROPOSED CREDIT LINE |
|
|
71-85 |
Aa |
Possesses adequate working capital. No caution needed for credit
transaction. It has above average (strong) capability for payment of interest
and principal sums |
Large |
|
Maximum Credit Limit : |
500.000,00 € |
|
|
|
|
Status : |
Very Good |
|
|
|
|
Payment Behaviour : |
Regular |
|
|
|
|
Litigation : |
Exists |
FINANCIAL REPORT
ROMANI IMPORT EXPORT SL
TAX NUMBER: B96418926
EXECUTIVE SUMMARY
Identification
Current Business Name: ROMANI IMPORT
EXPORT SL
Other names: NO
Current Address: STREET PONENT
(PG INDUSTRIAL JUAN CARLOS I
), 12, CP 46440, ALMUSSAFES VALENCIA
Branches: 1
Telephone number: 961783497 Fax: 961784022
Corporate e-mail: pascual.romani@terra.es
Commercial Risk
Credit Appraisal: 500.000,00 €
Legal Actions: YES
Financial Information
Latest sales known (2007): 9.626.694,89 € (Estimated)
Latest Balance sheet sales (2006): 9.346.305,72 € (MERCANTILE REGISTER)
Result: 507.116,65 €
Total Assets: 9.253.847,54 €
Social Capital: 18.030,00 €
Employees: 11
Commercial Information
Constitution Date: 16/03/1995
Business activity: Wholesale of
other foods products
NACE Code: 5139
International Operations: Imports and
Exports
Corporate Structure
Administrator:
Other Complementary Information
Latest proceeding published in BORME: 04/10/2007 Registration
of accounts
Bank Entities: Yes
Rating Evolution
Financial Situation
Fiscal year2006
|
Treasury |
Excellent |
|
Indebtedness |
Important |
|
Profitability |
Sufficient |
|
Balance |
Excellent |
Performance
|
Legal Actions |
None or Negligible |
|
Business
Trajectory |
Excellent |
INCIDENTS

Summary
|
LEGAL ACTIONS: 1 ( last:
05/12/2002 )Insolvency Proceeding: |
0 |
|
Civil Court: |
1 |
|
Social Court/ Industrial Tribunal: |
0 |
CLAIM FILED AGAINST THE ADMINISTRATION: No administrative
claims registered
AFFECTED BY: No significant element.
Last Legal Actions
Figures expressed in €
CIVIL COURT
1 incidence(s)
|
DATE |
CLAIM TYPE |
INCIDENCE STATUS |
ACTOR |
AMOUNT |
|
05/12/2002 |
VERBAL 1/2000 |
VERBAL TRIAL JUDGMENT |
PALET ROIG JAIME |
|
FINANCIAL ELEMENTS AND SECTORIAL
COMPARATIVE
FINANCIAL ELEMENTS
Figures given in €
|
|
2005 (12) |
2006 (12) |
2007 |
|
|
|
|
|
BALANCE SHEET ANALYSIS |
|
|
|
|
|
|
|
|
OWN FUNDS |
1.124.726,17 |
1.631.842,82 |
|
|
|
|
|
|
DEBT |
5.535.320,95 |
7.622.004,72 |
|
|
|
|
|
|
FIXED ASSETS |
2.650.704,06 |
2.704.164,76 |
|
|
|
|
|
|
TOTAL ASSETS |
6.660.047,12 |
9.253.847,54 |
|
|
|
|
|
|
|
|
|
|
|
|
|
|
|
|
2005 (12) |
2006 (12) |
2007 |
|
|
|
|
|
PROFIT AND LOSS ACCOUNT ANALYSIS |
|
|
|
|
|
|
|
|
SALES |
5.075.133,24 |
9.346.305,72 |
9.626.694,89 |
|
|
|
|
|
ADDED VALUE |
491.610,08 |
1.238.447,38 |
|
|
|
|
|
|
EBITDA |
431.455,97 |
990.854,03 |
|
|
|
|
|
|
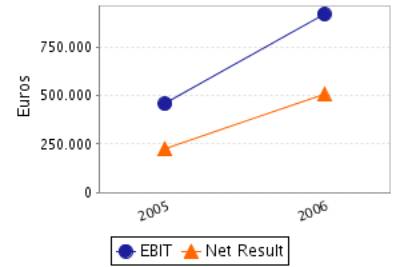
EBIT |
457.749,08 |
920.186,83 |
|
|
|
|
|
|
NET RESULT |
226.947,06 |
507.116,65 |
|
|
|
|
|
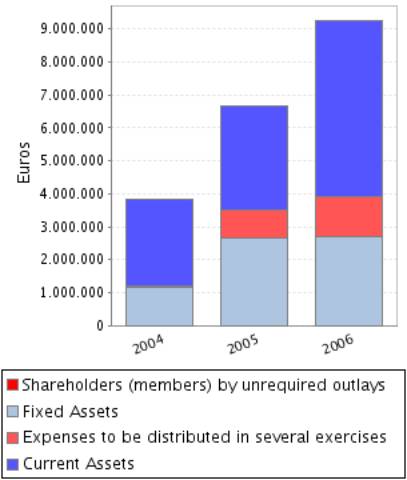
Balance Sheets Items
Analysis
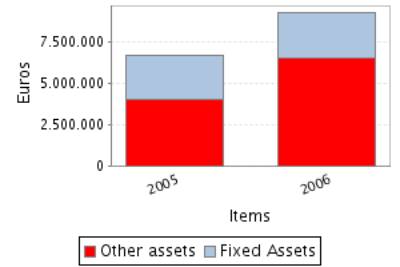
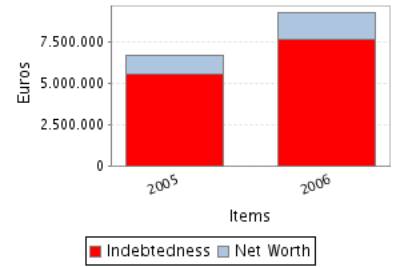
Balance Sheet Comments
Total assets of the company grew 38,95% between 2005 and 2006.
This growth has been inferior in the case of the fixed assets that
increased just in 2,02%.
This growth has been financed, on a wider scale, with a Shareholders’
equity increase of 45,09% and in a smaller proportion with an debt increase of
37,70%.
Profit and Loss Account Analysis
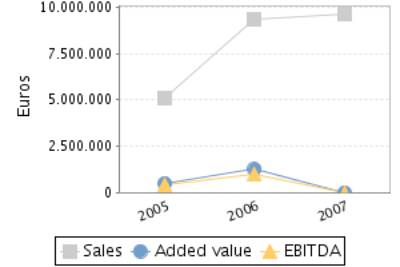
Profit and Loss
Account Comments
The company’s sales figure grew 84,16% between 2005 and 2006.
The company’s EBIT grew 101,02% between 2005 and 2006.
This evolution implies an increase in the company’s operating
profitability.
The result of these variations is an increase of the company’s Economic
Profitability of 44,68% in the analysed period, being this profitability of
9,94% in the year 2006.
The company’s Net Result grew 123,45% between 2005 and 2006.
This evolution, compared to the EBIT’s performance, implies that the
financial and extraordinary activities have had a positive effect in the company’s
Financial Profitability.
The result of these variations is an increase of the company’s Economic
Profitability of 54,01% in the analysed period, being equal to 31,08% in the
year 2006.
ANNUAL FINANCIAL REPORT
ADDITIONAL DATA
Source: annual financial report 2006
Results Distribution
Figures given in €
|
DISTRIBUTION
BASE |
DISTRIBUTION TO |
||
|
Profit and Loss |
507.116,65 |
Retained earnings |
0,00 |
|
Carry Over |
0,00 |
Voluntary Reserve |
507.116,65 |
|
Voluntary reserves |
0,00 |
Prior years losses |
0,00 |
|
Reserves |
0,00 |
Carry Over |
0,00 |
|
Other concepts |
0,00 |
Other funds |
0,00 |
|
Total of Amounts to be distributed |
507.116,65 |
Dividends |
0,00 |
|
|
|
Other Applications |
0,00 |
Auditing
Auditors’ opinion: FAVOURABLE WITH RESERVATIONS
Auditor: PLANELLES GARCES JOSE VICENTE
Auditing exceptions:
LAS CIFRAS RELATIVAS AL EJERCICIO ANTERIOR INCLUIDAS EN LAS CUENTAS
ANUALES A EFECTOS COMPARATIVOS NO FUERON SOMETIDAS A AUDITORIA Y NO HA SIDO POSIBLE
OBTENER EVIDENCIA SUFICIENTE Y COMPETENTE SOBRE LOS SALDOS DE CIERRE DEL
EJERCICIO ANTERIOR CORRESPONDIENTE AL ESTADO CONTABLE DEL BALANCE DE SITUACION,
COMO PARTE INTEGRANTE DE LAS CUENTAS ANUALES, QUE REPRESENTAN IMPORTES
SIGNIFICATIVOS EN RELACION CON EL SALDO DE CADA UNO DE LOS EPIGRAFES DEL
BALANCE DE SITUACION DEL EJERCICIO.
COMPARATIVE SECTOR ANALYSIS
Values table
Figures expressed in %
|
|
COMPANY (2006) |
SECTOR |
DIFFERENCE |
DIFFERENCE RELATIVE |
|
|
|
|
|
|
BALANCE SHEET ANALYSIS: % on the total
assets |
|
|
|
|
|
|
|
|
|
|
OWN FUNDS |
17,63 |
36,96 |
-19,33 |
-52,29 |
|
|
|
|
|
|
DEBT |
82,37 |
63,04 |
19,33 |
30,66 |
|
|
|
|
|
|
FIXED ASSETS |
29,22 |
33,82 |
-4,59 |
-13,59 |
|
|
|
|
|
|
|
|
|
|
|
|
|
|
|
|
|
|
COMPANY (2006) |
SECTOR |
DIFFERENCE |
DIFFERENCE RELATIVE |
|
|
|
|
|
|
PROFIT AND LOSS ACCOUNT ANALYSIS: % on the total
operating income |
|
|
|
|
|
|
|
|
|
|
SALES |
99,94 |
98,23 |
1,71 |
1,74 |
|
|
|
|
|
|
ADDED VALUE |
13,24 |
11,38 |
1,86 |
16,31 |
|
|
|
|
|
|
EBIT |
9,84 |
2,28 |
7,56 |
331,17 |
|
|
|
|
|
|
NET RESULT |
5,42 |
1,64 |
3,78 |
229,63 |
|
|
|
|
|
Sector Composition
Compared sector (NACE): 513
Number of companies: 959
Size (Sales Figure) : 7.000.000,00 -
40.000.000,00 Euros
Comments on the sectorial
comparative
Compared to its sector the assets of the companies show an inferior
proportion of fixed assets. Specifically the difference with the sector average
is -4,59% , which means a relative difference of -13,59% .
In liabilities composition the company appeals on a wider scale to self
financing, being the proportion of net worth of 19,33% inferior, which means a
relative difference of 52,29% 19,33% more than the sector, which means a
difference of 30,66% .
The proportion that the sales mean to the company’s total ordinary
income is 99,94%, 1,71% higher than in the sector, which means a relative
difference of 1,74% .
The company’s EBIT was positive and was 9,84% with regard to the total
ordinary income, 7,56% higher than in the sector, which means a relative
difference of 331,17% .
The company’s capacity to generate operating income is higher than the
one of the sector as its ratio EBIT/Sales is higher (ES Company versus ES
Sector).
The company’s net result was positive and equal to 5,42% with regard to
the total ordinary income, 3,78% higher than in the sector, which means a
relative difference of 229,63% .
ADDRESSES
Current Legal Seat Address:
STREET PONENT (PG INDUSTRIAL JUAN CARLOS I ), 12
46440 ALMUSSAFES VALENCIA
Previous Seat Address:
STREET ROMANI, 7
46440
ALMUSSAFES VALENCIA
Characteristics of the current
address
Type of premises: store
Property: rented
Local Situation: main
Branches 
|
STREET |
POSTAL CODE |
TOWN |
PROVINCE |
|
STREET PONTET 12 |
46440 |
ALMUSSAFES |
Valencia |
1 branches registered
CORPORATE STRUCTURE
ADMINISTRATIVE LINKS
Main Board members,
Directors and Auditor ![]()
|
POSITION |
SURNAMES AND
NAME |
APPOINTMENT DATE |
|
|
ADMINISTRATOR |
MARTINEZ GARCIA PASCUAL |
03/04/1996 |
|
|
ADMINISTRATOR |
IBORRA ESCRIBA JOSEFINA |
19/07/2005 |
|
|
AUDITOR |
APPOINTMENT DATE |
||
|
BAQUEDANO MUNOZ VICENTE RAIMUNDO |
14/12/2006 |
||
|
PLANELLES GARCES JOSE VICENTE |
14/12/2006 |
||
Functional Managers
|
POSITION |
SURNAMES AND
NAME |
|
General Manager |
MARTINEZ GARCIA PASCUAL |
|
Financial Manager |
MARTINEZ GARCIA PASCUAL |
|
Commercial Manager |
MARTINEZ GARCIA PASCUAL |
|
Purchases Manager |
MARTINEZ GARCIA PASCUAL |
FINANCIAL LINKS
|
|
BUSINESS NAME |
CIF / COUNTRY |
% |
SOURCE |
DATA INF. |
|
|
VILLAR IBORRA JUAN BAUTISTA |
|
Indet. |
OWN SOURCES |
04/03/2008 |
|
|
REME MARTINEZ IBORRA MARIA |
|
Indet. |
OWN SOURCES |
04/03/2008 |
|
|
VILLAR IBORRA MARIA VICENTA |
|
Indet. |
OWN SOURCES |
04/03/2008 |
|
|
VILLAR IBORRA MARIA JOSE |
|
Indet. |
OWN SOURCES |
04/03/2008 |
|
|
MARTINEZ IBORRA AIDA |
|
Indet. |
OWN SOURCES |
04/03/2008 |
|
|
MARTINEZ GARCIA PASCUAL |
|
Indet. |
OWN SOURCES |
11/05/2006 |
CREDIT INFORMATION
Constitution Date: 16/03/1995
Business activity 
Activity: Wholesale of other foods products
NACE Code: 5139
NACE Activity: Non-specialized
wholesale of food, beverages and tobacco
Business: LA IMPORTACION. EXPORTACION, MANIPULADO, LIMPIEZA,
CLASIFICACION, ENVASADO, TOSTADO, FRITURA Y VENTA AL POR MAYOR DE FRUTOS SECOS,
LEGUMBRES Y TODA CLASE DE PRODUCTOS AGRICOLAS. LA COMPRA Y VENTA DE INMUEBLES.
(Enlargement)LA ZONA Y DEPOSITOS FRANCOS; DEPOSITO Y ALMACENAMIENTO, COMO SERVICIO INDEPENDIENTE DE FRUTOS SECOS, LEGUMBRES, GRANO Y TODA CLASE DE PRODUCTOS ALIMENTICIOS. EL ANALISIS MICROBIOLOGICO Y FISICOQUIMICO DE TODA CLASE DE PR
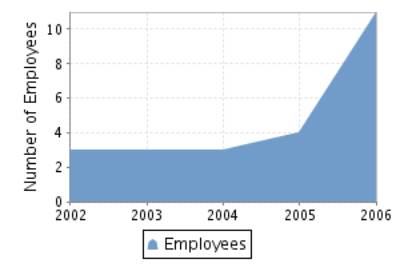
Employees 
Number of total employees: 11 (2008)
Number of fixed employees: 100,00%
Number of temporary employees: 0,00%
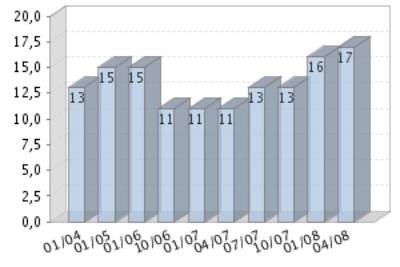
Employees evolution
COMMERCIAL OPERATIONS 
SALES
Collection (estimated):
Export Percentage: 30%
Exports to: Magreb
National Distribution: 70%
Banks 
|
ENTITY |
BRANCH |
ADDRESS |
TOWN OR CITY |
PROVINCE |
|
BANCO ESPAÑOL DE CREDITO, S.A. |
|
|
ALMUSSAFES |
|
|
CAJA AH. VALENCIA, CASTELLON Y ALICANTE, BANCAJA |
|
|
ALMUSSAFES |
|
|
CAJA DE AHORROS DEL MEDITERRANEO |
|
|
ALMUSSAFES |
|
|
CAJA R. DEL MEDITERRANEO, RURALCAJA, S.C.C. |
|
|
ALMUSSAFES |
|
|
BANCO POPULAR ESPAÑOL, S.A. |
|
|
BENIFAIO |
|
6 bank entities registered
LEGAL STRUCTURE
Constitution Data
Register Date: 16/03/1995
Register town: Valencia
Announcement number: 196234
Legal form: LIMITED LIABILITY COMPANY
Social Capital: 18.030,36 €
Current structure data 
Current Legal Form: LIMITED LIABILITY
COMPANY
Current Capital: 18.030,00 €
Legal Aspects
Obligation to fill in Financial Statements: YES
Chamber census: YES (2006)
Listed on a Stock Exchange: NO
B.O.R.M.E.(Official Companies
Registry Gazette) 
Registered Proceedings
|
PROCEEDINGS |
DATE |
NOTICE NUM. |
TRADE REG. |
|
Appointments |
14/12/2006 |
598909 |
Valencia |
|
Activity extension |
02/06/2006 |
288711 |
Valencia |
|
Change of address |
02/06/2006 |
288711 |
Valencia |
Other Proceedings published
|
PROCEEDINGS |
DATE |
NOTICE NUM. |
TRADE REG. |
|
Registration of accounts (2006) Individual |
04/10/2007 |
761852 |
Valencia |
|
Registration of accounts (2005) Individual |
14/12/2006 |
1026822 |
Valencia |
Complementary Information
15/03/06 BLOQUE DE INVESTIGACION:
- Sucursal: En C/ Ponent, 12 en PG. Ind. Juan Carlos de Almussafes,
Velencia, destinado a nave.
tacion con Magreb.
----------------------------------------------------------------------
El Bloque de Investigacion no esta sujeto a actualizaciones sistemati-
cas.Los datos mostrados fueron aportados por las fuentes consultadas
en la fecha del encabezamiento.
FINANCIAL INFORMATION
The information on the last account contained in this report is
extracted from the Mercantile Register file of the legal address of the Company
and dated 05/11/2007.
BALANCE SHEET
Assets
Figures given in €
|
|
31/12/2004 (12) |
31/12/2005 (12) |
31/12/2006 (12) |
|
A) DUE FROM SHAREHOLDERS FOR UNCALLED CAPITAL |
|
|
|
|
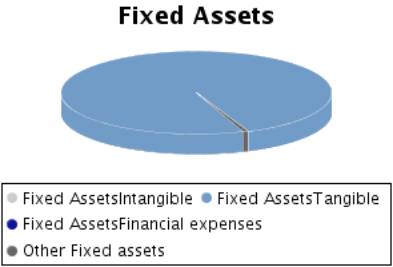
B) FIXED ASSETS |
1.180.433,02 |
2.650.704,06 |
2.704.164,76 |
|
I. Incorporation costs |
|
22.233,18 |
17.786,54 |
|
II. Intangible fixed assets |
|
154,80 |
90,45 |
|
III. Tangible fixed assets |
1.180.166,78 |
2.626.875,20 |
2.684.846,89 |
|
IV. Financial fixed assets |
266,24 |
1.440,88 |
1.440,88 |
|
V.Owners equity |
|
|
|
|
VI.Long term trade liabilities |
|
|
|
|
C) DEFERRED EXPENSES |
24.158,30 |
867.623,17 |
1.189.193,76 |
|
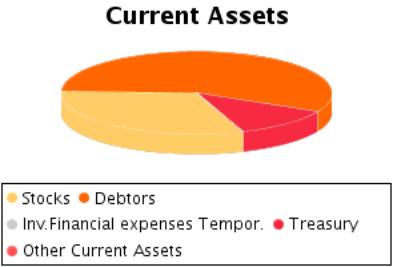
D) CURRENT ASSETS |
2.637.315,67 |
3.141.719,89 |
5.360.489,02 |
|
I. Shareholders by required outlays |
|
|
|
|
II. Stocks |
1.057.488,31 |
1.401.154,06 |
1.676.447,87 |
|
III. Debtors |
1.342.924,29 |
1.473.199,44 |
3.041.885,26 |
|
IV. Temporary financial investment |
|
|
|
|
V. Short-term own shares |
|
|
|
|
VI. Treasury |
236.903,07 |
261.893,03 |
635.648,97 |
|
VII. Periodification adjustments |
|
5.473,36 |
6.506,92 |
|
ASSETS (A + B + C + D) |
3.841.906,99 |
6.660.047,12 |
9.253.847,54 |
Assets composition
Liabilities
Figures given in €
|
|
31/12/2004 (12) |
31/12/2005 (12) |
31/12/2006 (12) |
|
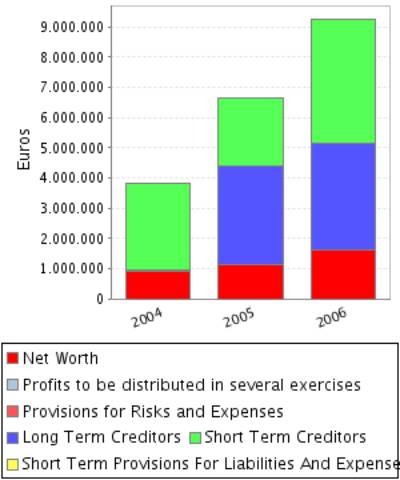
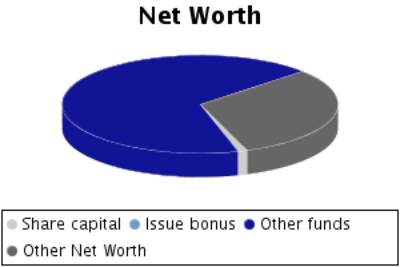
A) SHAREHOLDERS EQUITY |
897.779,11 |
1.124.726,17 |
1.631.842,82 |
|
I. Share capital |
18.030,00 |
18.030,00 |
18.030,00 |
|
II. Issue bonus |
|
|
|
|
III.Revaluation reserve |
|
|
|
|
IV.Reserves |
576.010,72 |
879.749,11 |
1.106.696,17 |
|
Capital adjustments in Euros |
0,36 |
0,36 |
0,36 |
|
Sundry reserves |
576.010,36 |
879.748,75 |
1.106.695,81 |
|
V.Results from previous years |
|
|
|
|
VI.Profit and Losses |
303.738,39 |
226.947,06 |
507.116,65 |
|
VII.Dividend paid during the year |
|
|
|
|
VIII.Own shares for capital reduction |
|
|
|
|
B) DEFERRED INCOME |
|
|
|
|
C) PROVISIONS FOR LIABILITIES AND EXPENSES |
|
|
|
|
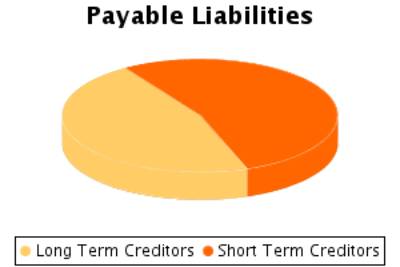
D) LONG TERM LIABILITIES |
46.166,50 |
3.259.951,20 |
3.539.010,32 |
|
E) SHORT TERM LIABILITIES |
2.897.961,38 |
2.275.369,75 |
4.082.994,40 |
|
F) SHORT TERM PROVISIONS FOR LIABILITIES AND EXPENSES |
|
|
|
|
LIABILITIES (A + B + C + D + E + F) |
3.841.906,99 |
6.660.047,12 |
9.253.847,54 |
Liabilities
Composition
PROFIT AND LOSS ACCOUNT
Itams of the Profit
and Loss Account
Figures given in €
|
|
31/12/2004 (12) |
31/12/2005 (12) |
31/12/2006 (12) |
|
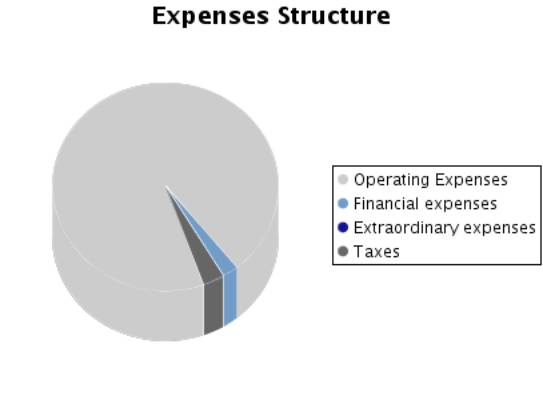
A) EXPENSES (A.1 a A.15) |
5.272.681,68 |
4.879.884,29 |
8.905.594,85 |
|
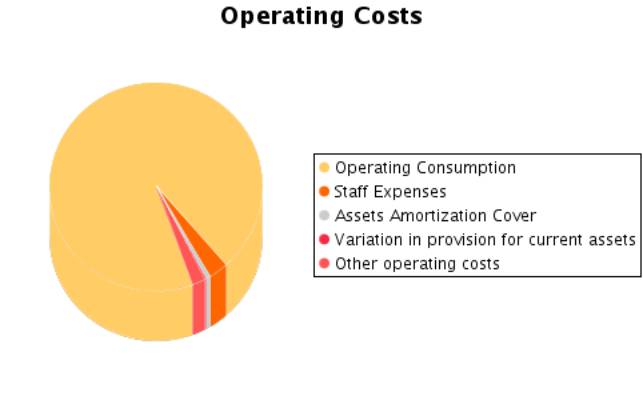
A.1.Operating costs |
4.837.369,54 |
4.449.912,44 |
7.935.271,15 |
|
A.2. Labour cost |
54.145,06 |
60.154,11 |
247.593,35 |
|
Wages |
44.778,12 |
47.536,80 |
194.163,43 |
|
Social security expenses |
9.366,94 |
12.617,31 |
53.429,92 |
|
A.3. Assets depreciation |
7.568,50 |
6.477,48 |
61.039,32 |
|
A.4. Variation in provision for current assets |
16.289,93 |
-32.770,59 |
9.627,88 |
|
A.5. Other operating costs |
99.116,98 |
146.433,94 |
178.441,07 |
|
A.I. OPERATING RESULT (B.1-A.1-A.2-A.3-A.4-A.5) |
530.610,52 |
457.749,08 |
920.186,83 |
|
A.6.Financial expenses and similar |
77.636,14 |
99.396,29 |
189.138,13 |
|
Debts with related companies |
|
|
|
|
Debts with associated companies |
|
|
|
|
By debts with third parties and similar expenses |
77.636,14 |
99.396,29 |
189.138,13 |
|
Losses from financial investments |
|
|
|
|
A.7. Variation in financial investment provision |
|
|
|
|
A.8.Negative exchange difference |
23.892,69 |
36.320,85 |
20.094,24 |
|
A.II.POSITIVE FINANCIAL RESULTS
(B.2+B.3-A.6-A.7-A.8) |
|
|
|
|
A.III.PROFIT FROM ORDINARY ACTIVITIES
(A.I+A.II-B.I-B.II) |
458.612,57 |
338.660,01 |
744.540,10 |
|
A.9. Variation in provision in fixed assets |
|
|
|
|
A.10. Losses in fixed assets |
|
|
|
|
A.11. Losses from own shares and bonds |
|
|
|
|
A.12. Extraordinary charges |
30,00 |
652,50 |
372,61 |
|
A.13.Other exercises’ expenses and losses |
|
|
|
|
A.IV.POSITIVE EXTRAORDINARY RESULT
(B.4+B.5+B.6+B.7+B.8-A.9-A.10-A.11-A.12-A.13) |
1.758,66 |
1.594,32 |
26.593,65 |
|
A.V.PROFIT BEFORE TAXES (A.III+A.IV-B.III-B.IV) |
460.371,23 |
340.254,33 |
771.133,75 |
|
A.14.Corporate Taxes |
156.632,84 |
113.307,27 |
264.017,10 |
|
A.15. Other taxes |
|
|
|
|
A.VI.EXERCISE RESULT (PROFIT) (A.V-A.14-A.15) |
303.738,39 |
226.947,06 |
507.116,65 |
|
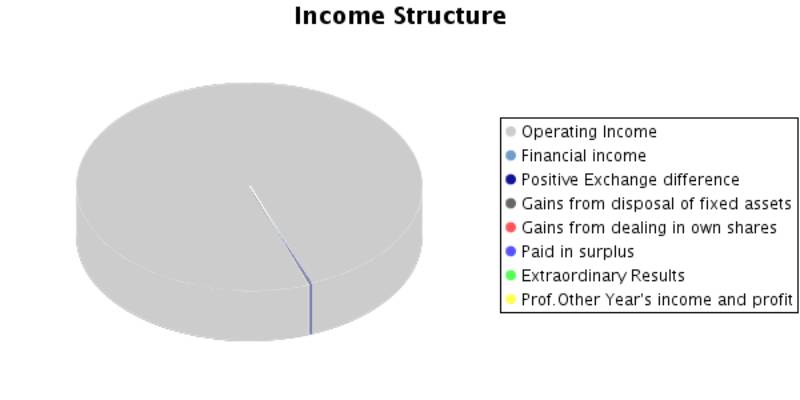
B) INCOMES (B.1 a B.8) |
5.576.420,07 |
5.106.831,35 |
9.412.711,50 |
|
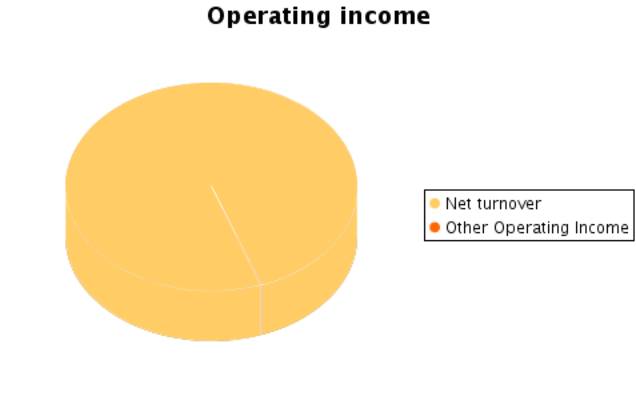
B.1.Operating income |
5.545.100,53 |
5.087.956,46 |
9.352.159,60 |
|
Turnover |
5.532.679,33 |
5.075.133,24 |
9.346.305,72 |
|
Other operating income |
12.421,20 |
12.823,22 |
5.853,88 |
|
B.I.OPERATING LOSSES (A.1+A.2+A.3+A.4+A.5-B.1) |
|
|
|
|
B.2.Financial Income |
567,88 |
1.327,33 |
452,38 |
|
From affiliated companies |
|
|
|
|
From associated companies |
|
|
|
|
Other |
567,88 |
1.327,33 |
452,38 |
|
Gains from investments |
|
|
|
|
B.3. Positive change difference |
28.963,00 |
15.300,74 |
33.133,26 |
|
B.II. NEGATIVE FINANCIAL RESULTS
(A.6+A.7+A.8-B.2-B.3) |
71.997,95 |
119.089,07 |
175.646,73 |
|
B.III.LOSSES FROM ORDINARY ACTIVITIES
(B.I+B.II-A.I-A.II) |
|
|
|
|
B.4.B.9. Gains from disposal of fixed assets |
|
|
24.071,01 |
|
B.5.Gains from dealing in own shares |
|
|
|
|
B.6. Paid in surplus |
|
|
|
|
B.7. Extraordinary income |
1.788,66 |
2.246,82 |
2.895,25 |
|
B.8.Other year’s income and profits |
|
|
|
|
B.IV.NEGATIVE EXTRAORDINARY LOSSES
(A.9+A.10+A.11+A.12+A.13-B.4-B.5-B.6-B.7-B.8) |
|
|
|
|
B.V.LOSS BEFORE TAXES (B.III+B.IV-A.III-A.IV) |
|
|
|
|
B.VI.EXERCISE RESULTS (LOSS) (B.V+A.14+A.15) |
|
|
|
Composition of the
Profit and Loss Account
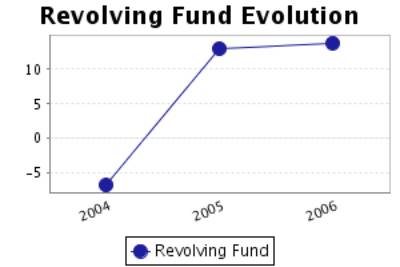
FINANCIAL BALANCE
Here the Main Capital Amounts of the company
and the Revolving Fund Evolution are analysed.
Financial Balance
Table
Figures given in €
|
|
31/12/2004 (12) |
% |
31/12/2005 (12) |
% |
31/12/2006 (12) |
% |
|
A) DUE FROM SHAREHOLDERS FOR UNCALLED CAPITAL |
|
|
|
|
|
|
|
B) FIXED ASSETS |
1.180.433,02 |
30,73 |
2.650.704,06 |
39,80 |
2.704.164,76 |
29,22 |
|
C) DEFERRED EXPENSES |
24.158,30 |
0,63 |
867.623,17 |
13,03 |
1.189.193,76 |
12,85 |
|
D) CURRENT ASSETS |
2.637.315,67 |
68,65 |
3.141.719,89 |
47,17 |
5.360.489,02 |
57,93 |
|
ASSETS (A + B + C + D) |
3.841.906,99 |
|
6.660.047,12 |
|
9.253.847,54 |
|
|
|
||||||
|
A) SHAREHOLDERS EQUITY |
897.779,11 |
23,37 |
1.124.726,17 |
16,89 |
1.631.842,82 |
17,63 |
|
B) DEFERRED INCOME |
|
|
|
|
|
|
|
C) PROVISIONS FOR LIABILITIES AND EXPENSES |
|
|
|
|
|
|
|
D) LONG TERM LIABILITIES |
46.166,50 |
1,20 |
3.259.951,20 |
48,95 |
3.539.010,32 |
38,24 |
|
E) SHORT TERM LIABILITIES |
2.897.961,38 |
75,43 |
2.275.369,75 |
34,16 |
4.082.994,40 |
44,12 |
|
F) SHORT TERM PROVISIONS FOR LIABILITIES AND EXPENSES |
|
|
|
|
|
|
|
LIABILITIES (A + B + C + D + E + F) |
3.841.906,99 |
|
6.660.047,12 |
|
9.253.847,54 |
|
Financial Balance
Composition
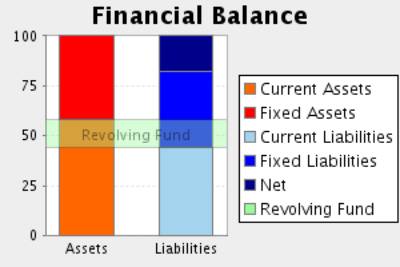
Comments on Financial
Balance
In the 2004, the assets of the company were formed in 31,35% of Fixed
Assets and in 68,65% of Current Assets.This assets were financed in 23,37% with
own capitals, and in 1,20% with long term debt and in 75,43% with current
liabilities.
The result of this financial structure is a negative turnover fund of
-260.645,71 Euros, which is equivalent to -6,78% proportion of the company’s
total assets.
In the 2005, the assets of the company were formed in 52,83% of Fixed
Assets and in 47,17% of Current Assets.This assets were financed in 16,89% with
own capitals, and in 48,95% with long term debt and in 34,16% with current
liabilities.
The result of this financial structure is a positive turnover fund of
866.350,14 Euros, which is equivalent to 13,01% proportion of the
company’s total assets.
This measure has increased with respect to the previous exercise in
432,39% having also increased its proportion with respect to the total assets
of the company.
In the 2006, the assets of the company were formed in 42,07% of Fixed
Assets and in 57,93% of Current Assets.This assets were financed in 17,63% with
own capitals, and in 38,24% with long term debt and in 44,12% with current
liabilities.
The result of this financial structure is a positive turnover fund of
1.277.494,62 Euros, which is equivalent to 13,81% proportion of the
company’s total assets.
This measure has increased with respect to the previous exercise in 47,46%
having also increased its proportion with respect to the total assets of the
company.
RATIOS
Main Ratios
|
|
31/12/2004 (12) |
31/12/2005 (12) |
31/12/2006 (12) |
|
STRUCTURAL RATIOS |
|
|
|
|
Management fund |
-260.645,71 |
866.350,14 |
1.277.494,62 |
|
Management Fund Requirement |
|
|
2.775.002,65 |
|
Indebtedness (%) |
76,63 |
83,11 |
82,37 |
|
External Funds on Net Worth |
3,28 |
4,92 |
4,67 |
|
GENERAL ACTIVITY RATIO |
|
|
|
|
Turnover Increase (%) |
55,87 |
-8,27 |
84,16 |
|
Added value growth (%) |
73,01 |
-19,22 |
151,92 |
|
Cash Flow |
327.596,82 |
200.653,95 |
577.783,85 |
|
Labour Productivity |
11,24 |
8,17 |
5,00 |
|
Assets turnover |
1,44 |
0,76 |
1,01 |
|
Breakdown Point |
1.387.745,95 |
1.437.726,51 |
3.278.474,62 |
|
Security Margin of the Breakdown Point (%) |
74,97 |
71,74 |
64,94 |
|
ACTIVITY RATIOS |
|
|
|
|
Average Payment Period |
|
|
77 |
|
Average Collection Period |
87 |
105 |
117 |
|
Inventory Turnover Period |
69 |
99 |
65 |
|
SOLVENCY RATIOS |
|
|
|
|
Payback Capacity |
0,11 |
0,04 |
0,08 |
|
Assets Guarantee |
1,30 |
1,04 |
1,06 |
|
Short Term Debts Proportion (%) |
98,43 |
41,11 |
53,57 |
|
Interest Coverage |
3,82 |
1,83 |
2,74 |
|
LIQUIDITY RATIOS |
|
|
|
|
Current Ratio |
0,91 |
1,38 |
1,31 |
|
Immediate liquidity |
0,08 |
0,12 |
0,16 |
|
Treasury |
|
|
-1.497.508,03 |
|
Sales on Current Assets |
755 |
582 |
628 |
Results Analysis
Ratios
|
|
31/12/2004 (12) |
31/12/2005 (12) |
31/12/2006 (12) |
|
Economic profitability (%) |
13,81 |
6,87 |
9,94 |
|
Operating Profitability (%) |
9,59 |
9,02 |
9,84 |
|
Equity gearing |
3,70 |
4,38 |
4,59 |
|
Financial profitability (%) |
33,83 |
20,18 |
31,08 |
|
General Profitability (%) |
5,49 |
4,47 |
5,43 |
Comments on the
Results Analysis Ratios
The economic profitability in the year2005 achieved a 6,87% positive
level, due to a 9,02% economic margin and to an assets turnover of0,76%.
The economic profitability in the year has reduced from 13,81% up to 6,87%
of2005, even if it remains positive. This fall is due to the decrease in
operating profitability, that has passe from 9,59% to 9,02%, as assets turnover
whose index has passed from 1,44 to 0,76%.
Financial profitability on 2005 achieved a 20,18%.
The company’s financial structure has instigated its economic
profitability with an indebtedness level of 4,38.
The general profitability on 2005 achieved a 4,47%.
The economic profitability in the year2006 achieved a 9,94% positive
level, due to a 9,84% economic margin and to an assets turnover of1,01%.
The economic profitability in the year has increased from 6,87% up to
9,94%. This growth is due to the economic margin increase, from 9,02% to the
current 9,84Y%, and to the assets turnover index, which in the last period has
achieved 1,01, compared to 0,76 del 2005.
Financial profitability on 2006 achieved a 31,08%.
The company’s financial structure has instigated its economic
profitability with an indebtedness level of 4,59.
The general profitability on 2006 achieved a 5,43%.
SECTORIAL ANÁLYSIS
Large Capital Amounts
and Financial Balance
Figures given in %
|
|
COMPANY (2006) |
SECTOR |
DIFFERENCE |
DIFFERENCE RELATIVE |
|
|
|
|
|
|
ASSETS |
|
|
|
|
|
|
|
|
|
|
A) DUE FROM SHAREHOLDERS FOR UNCALLED CAPITAL |
|
0,08 |
|
|
|
|
|
|
|
|
B) FIXED ASSETS |
29,22 |
33,82 |
-4,60 |
-13,59 |
|
|
|
|
|
|
C) DEFERRED EXPENSES |
12,85 |
0,29 |
12,56 |
4.346,37 |
|
|
|
|
|
|
D) CURRENT ASSETS |
57,93 |
65,82 |
-7,88 |
-11,98 |
|
|
|
|
|
|
ASSETS (A + B + C + D) |
100 |
100 |
|
|
|
|
|
|
|
|
|
|
|
|
|
|
|
|
|
|
|
|
COMPANY (2006) |
SECTOR |
DIFFERENCE |
DIFFERENCE RELATIVE |
|
|
|
|
|
|
LIABILITIES |
|
|
|
|
|
|
|
|
|
|
A) SHAREHOLDERS EQUITY |
17,63 |
34,33 |
-16,70 |
-48,64 |
|
|
|
|
|
|
B) DEFERRED INCOME |
|
2,63 |
|
|
|
|
|
|
|
|
C) PROVISIONS FOR LIABILITIES AND EXPENSES |
|
0,25 |
|
|
|
|
|
|
|
|
D) LONG TERM LIABILITIES |
38,24 |
9,68 |
28,56 |
295,20 |
|
|
|
|
|
|
E) SHORT TERM LIABILITIES |
44,12 |
53,09 |
-8,97 |
-16,90 |
|
|
|
|
|
|
F) SHORT TERM PROVISIONS FOR LIABILITIES AND EXPENSES |
|
0,02 |
|
|
|
|
|
|
|
|
LIABILITIES (A + B + C + D + E + F) |
100 |
100 |
|
|
|
|
|
|
|
Financial Balance
Composition
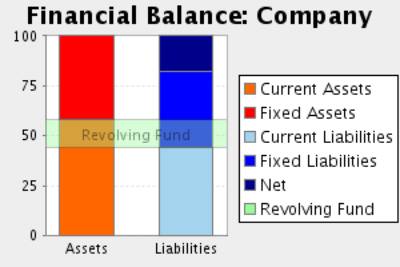
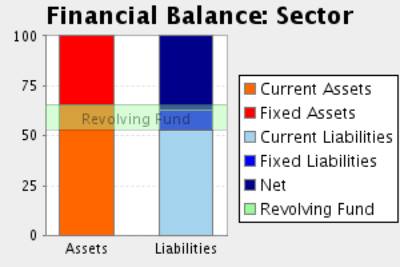
Comments to the
Sectorial Analysis
In the 2006, the assets of the company were formed in 42,07% of fixed
assets and in 57,93Current Assets % In the sector, the proportion of fixed
assets was of 34,18%, 23,07% inferior, and the proportion of current assets was
of 65,82%, 11,98% superior.
The assets were financed in the company in 17,63% with own capitals , in
38,24% with fixed liabilities and in 44,12% with current liabilities In the
sector, the self financing represented 36,96%, 52,30% superior. On the other
hand the long term debts represented in the sector an average of 9,92%
financing, with a relative difference of 285,29% in favour of the companyAnd,
short term liabilities represented in the sector an average of 53,11%
financing, with a relative difference of 16,93% favourable to the sector
The result of this company’s financial structure is a turnover fund that
represents 13,81% of the total assets; in the sector, this same proportion is
12,70%, therefore, we can say that the company’s turnover fund is 8,73% higher
than the one in of the sector.
Analytical Account of
Results
Figures given in
%
|
|
COMPANY (2006) |
SECTOR |
DIFFERENCE |
DIFFERENCE RELATIVE |
|
Turnover |
99,94 |
98,23 |
1,71 |
1,74 |
|
Other operating income |
0,06 |
1,77 |
-1,71 |
-96,61 |
|
Production Value |
100,00 |
100,00 |
0,00 |
0,00 |
|
Operating expenses |
84,85 |
80,56 |
4,29 |
5,33 |
|
Other operation expenses |
1,91 |
8,06 |
-6,15 |
-76,30 |
|
Added value |
13,24 |
11,38 |
1,86 |
16,29 |
|
Labour cost |
2,65 |
7,61 |
-4,96 |
-65,17 |
|
Gross Economic Result |
10,59 |
3,78 |
6,81 |
180,31 |
|
Assets depreciation |
0,65 |
1,34 |
-0,70 |
-51,67 |
|
Variation in provision for current assets and bad debt losses |
0,10 |
0,15 |
-0,05 |
-33,77 |
|
Net Economic Result |
9,84 |
2,28 |
7,56 |
331,20 |
|
Financial income |
0,36 |
0,36 |
0,00 |
0,56 |
|
Financial Charges |
2,24 |
0,60 |
1,64 |
270,86 |
|
Variation in financial investment provision |
|
0,01 |
|
|
|
Ordinary Activities Result |
7,96 |
2,02 |
5,94 |
293,09 |
|
Extraordinary income |
0,29 |
0,61 |
-0,32 |
-52,54 |
|
Extraordinary charges |
0,00 |
0,19 |
-0,19 |
-100,00 |
|
Variation in provision in fixed assets |
|
0,01 |
|
|
|
Results before Taxes |
8,25 |
2,43 |
5,82 |
239,37 |
|
Corporate taxes |
2,82 |
0,79 |
2,03 |
258,78 |
|
Net Result |
5,42 |
1,64 |
3,78 |
229,48 |
|
Assets depreciation |
0,65 |
1,34 |
-0,70 |
-51,67 |
|
Change of Provisions |
0,10 |
0,18 |
-0,08 |
-43,18 |
|
Net Self-Financing |
6,18 |
3,17 |
3,01 |
95,20 |
Main Ratios
|
|
COMPANY (2006) |
PTILE25 |
PTILE50 |
PTILE75 |
|
STRUCTURAL RATIOS |
|
|
|
|
|
Management fund |
1.277.494,62 |
-15,02 |
443,25 |
1.289,07 |
|
Management Fund Requirement |
2.775.002,65 |
-1.538,29 |
-335,77 |
248,58 |
|
Indebtedness (%) |
82,37 |
53,13 |
69,27 |
81,23 |
|
External Funds on Net Worth |
4,67 |
1,13 |
2,25 |
4,33 |
|
GENERAL ACTIVITY RATIO |
|
|
|
|
|
Turnover Increase (%) |
84,16 |
-4,73 |
3,64 |
11,82 |
|
Added value growth (%) |
151,92 |
-5,88 |
5,40 |
17,02 |
|
Cash Flow |
577.783,85 |
139,99 |
281,50 |
539,56 |
|
Labour Productivity |
5,00 |
1,25 |
1,48 |
1,89 |
|
Assets turnover |
1,01 |
1,69 |
2,49 |
3,57 |
|
Breakdown Point |
3.278.474,62 |
7.455.936,42 |
10.255.298,66 |
15.982.400,43 |
|
Security Margin of the Breakdown Point (%) |
64,94 |
4,16 |
10,38 |
19,91 |
|
ACTIVITY RATIOS |
|
|
|
|
|
Average Payment Period |
77 |
0 |
47 |
80 |
|
Average Collection Period |
117 |
37 |
59 |
88 |
|
Inventory Turnover Period |
65 |
5 |
17 |
37 |
|
SOLVENCY RATIOS |
|
|
|
|
|
Payback Capacity |
0,08 |
0,04 |
0,08 |
0,16 |
|
Assets Guarantee |
1,06 |
1,22 |
1,44 |
1,87 |
|
Short Term Debts Proportion (%) |
53,57 |
80,05 |
93,88 |
99,67 |
|
Interest Coverage |
2,74 |
1,55 |
4,84 |
15,12 |
|
LIQUIDITY RATIOS |
|
|
|
|
|
Current Ratio |
1,31 |
0,99 |
1,17 |
1,50 |
|
Immediate liquidity |
0,16 |
0,04 |
0,11 |
0,36 |
|
Treasury |
-1.497.508,03 |
-741,76 |
59,81 |
561,86 |
|
Sales on Current Assets |
628 |
905 |
1.316 |
1.899 |
Results Analysis
Ratios
|
|
COMPANY (2006) |
PTILE25 |
PTILE50 |
PTILE75 |
|
Economic profitability (%) |
9,94 |
1,79 |
3,93 |
7,29 |
|
Operating Profitability (%) |
9,84 |
0,65 |
1,56 |
3,11 |
|
Equity gearing |
4,59 |
1,65 |
2,50 |
4,01 |
|
Financial profitability (%) |
31,08 |
3,85 |
8,10 |
16,27 |
|
General Profitability (%) |
5,43 |
0,37 |
0,91 |
2,02 |
RATING EXPLANATIONS
|
RATING |
STATUS |
PROPOSED CREDIT LINE |
|
|
>86 |
Aaa |
Possesses an extremely sound financial base with the strongest
capability for timely payment of interest and principal sums |
Unlimited |
|
71-85 |
Aa |
Possesses adequate working capital. No caution needed for credit
transaction. It has above average (strong) capability for payment of interest
and principal sums |
Large |
|
56-70 |
A |
Financial & operational base are regarded healthy. General
unfavourable factors will not cause fatal effect. Satisfactory capability for
payment of interest and principal sums |
Fairly Large |
|
41-55 |
Ba |
Overall operation is considered normal. Capable to meet normal
commitments. |
Satisfactory |
|
26-40 |
B |
Unfavourable & favourable factors carry similar weight in credit
consideration. Capability to overcome financial difficulties seems
comparatively below average. |
Small |
|
11-25 |
Ca |
Adverse factors are apparent. Repayment of interest and principal sums
in default or expected to be in default upon maturity |
Limited with
full security |
|
<10 |
C |
Absolute credit risk exists. Caution needed to be exercised |
Credit not
recommended |
|
NR |
In view of the lack of information, we have no basis upon which to
recommend credit dealings |
No Rating |
|
This score serves as a reference to assess SC’s credit risk
and to set the amount of credit to be extended. It is calculated from a composite
of weighted scores obtained from each of the major sections of this report. The
assessed factors and their relative weights (as indicated through %) are as
follows:
Financial
condition (40%) Ownership
background (20%) Payment
record (10%)
Credit history
(10%) Market trend
(10%) Operational
size (10%)