![]()
MIRA
INFORM REPORT
|
Report Date : |
02.06.2008 |
IDENTIFICATION
DETAILS
|
Name : |
SISTEMAS TECNICOS DE ENCOFRADOS SA |
|
|
|
|
Registered Office : |
Street Llobregat,
8 - Sector Molle, Cp 08150, Parets Del Valles Barcelona |
|
|
|
|
Country : |
Spain |
|
|
|
|
Financials (as on) : |
31.12.2006 |
|
|
|
|
Date of Incorporation : |
|
|
|
|
|
Legal Form : |
Joint Stock Company |
|
|
|
|
Line of Business : |
RATING &
COMMENTS
|
MIRA’s Rating : |
A |
|
RATING |
STATUS |
PROPOSED CREDIT LINE |
|
|
56-70 |
A |
Financial & operational base are regarded healthy. General
unfavourable factors will not cause fatal effect. Satisfactory capability for
payment of interest and principal sums |
Fairly Large |
|
Maximum Credit Limit : |
5.790.751,63 € |
|
|
|
|
Status : |
Good |
|
|
|
|
Payment Behaviour : |
Regular |
|
|
|
|
Litigation : |
Clear |
FINANCIAL
REPORT
SISTEMAS TECNICOS DE ENCOFRADOS SA
TAX NUMBER: A08747404
EXECUTIVE SUMMARY
Identification
Current Business Name: SISTEMAS TECNICOS
DE ENCOFRADOS SA
Commercial Name: SISTEMAS TECNICOS ENCOFRADOS STEN
Other names: YES
Current Address: STREET LLOBREGAT,
8 - SECTOR MOLLE, CP 08150, PARETS DEL VALLES BARCELONA
Branches: 1
Telephone number: 935738770 Fax: 935623369
URL: www.sten.es
Corporate e-mail: sten@sten.es
Commercial Risk
Credit Appraisal:
5.790.751,63 €
Legal Actions: NO
Financial Information
Latest Balance sheet sales (2006): 143.391.288,00 € (MERCANTILE REGISTER)
Result: 23.263.932 €
Total Assets: 171.264.787 €
Social Capital: 166.000,00 €
Employees: 465
Commercial Information
Constitution Date: 05/05/1982
Business activity: Mfg. of metal
structures & parts of structures
NACE Code: 2811
International Operations: Imports
Corporate Structure
President:
Parent Company:
Participations: 6
Other Complementary Information
Latest proceeding published in BORME: 24/03/2008 Change
of statutes
Latest press article: 18/08/2006 CINCO
DIAS (SUBSIDIARIES INFORMATION)
Bank Entities: Yes
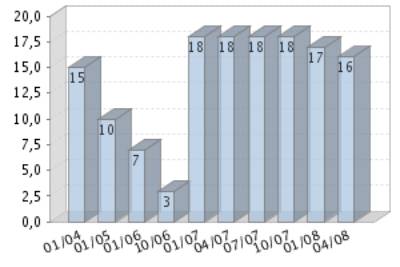
Rating Evolution
Financial Situation
Fiscal year2006
|
Treasury |
Excellent |
|
Indebtedness |
Weak |
|
Profitability |
Very good |
|
Balance |
Excellent |
Performance
|
Legal Actions |
None or Negligible |
|
Business
Trajectory |
Excellent |
INCIDENTS

Summary
LEGAL ACTIONS: No legal incidences registered
CLAIM FILED AGAINST THE ADMINISTRATION: No administrative
claims registered
AFFECTED BY:
6 Company / Companies in Insolvency Proceedings.
FINANCIAL ELEMENTS AND SECTORIAL
COMPARATIVE
FINANCIAL ELEMENTS
Figures given in €
|
|
2004 (12) |
2005 (12) |
2006 (12) |
% ASSETS |
|
|
|
|
|
|
BALANCE SHEET ANALYSIS |
|
|
|
|
|
|
|
|
|
|
OWN FUNDS |
61.288.736,14 |
68.950.521,89 |
86.214.454,00 |
50,34 |
|
|
|
|
|
|
DEBT |
35.019.195,10 |
57.847.359,03 |
85.050.333,00 |
49,66 |
|
|
|
|
|
|
FIXED ASSETS |
26.683.927,21 |
36.747.752,46 |
50.346.308,00 |
29,40 |
|
|
|
|
|
|
TOTAL ASSETS |
96.307.931,24 |
126.797.880,92 |
171.264.787,00 |
|
|
|
|
|
|
|
|
|
|
|
|
|
|
|
|
|
|
|
2004 (12) |
2005 (12) |
2006 (12) |
% SALES |
|
|
|
|
|
|
PROFIT AND LOSS ACCOUNT ANALYSIS |
|
|
|
|
|
|
|
|
|
|
SALES |
101.764.900,89 |
113.504.411,65 |
143.391.288,00 |
|
|
|
|
|
|
|
ADDED VALUE |
59.286.277,72 |
63.791.238,96 |
74.313.830,00 |
51,83 |
|
|
|
|
|
|
EBITDA |
45.073.674,67 |
47.187.881,97 |
54.762.486,00 |
38,19 |
|
|
|
|
|
|
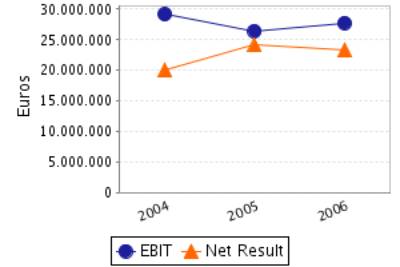
EBIT |
29.192.158,04 |
26.444.139,30 |
27.774.851,00 |
19,37 |
|
|
|
|
|
|
NET RESULT |
20.002.458,06 |
24.136.785,75 |
23.263.932,00 |
16,22 |
|
|
|
|
|
Balance Sheets Items
Analysis
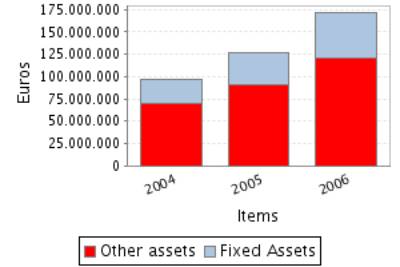
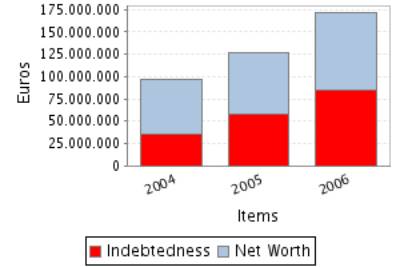
Balance Sheet
Comments
Total assets of the company grew 31,66% between 2004 and 2005.
This growth is a consequence of the fixed assets increase of 37,71%.
This growth has been mainly financed with a debt increase of 65,19%.
Nevertheless the net worth increased 12,50%.
Total assets of the company grew 35,07% between 2005 and 2006.
This growth is a consequence of the fixed assets increase of 37,01%.
This growth has been mainly financed with a debt increase of 47,03%. Nevertheless
the net worth increased 25,04%.
Profit and Loss
Account Analysis
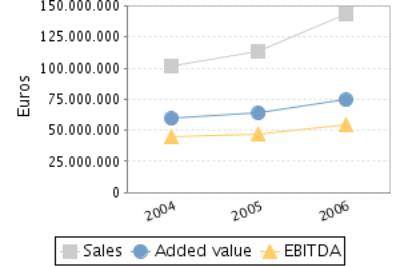
Profit and Loss
Account Comments
The company’s sales figure grew 11,54% between 2004 and 2005.
The company’s EBIT decreased in 9,41% between 2004 and 2005.
This evolution implies a reduction in the company’s operating
profitability.
The result of these variations is a decrease of the company’s Economic
Profitability of 31,20% in the analysed period, being this profitability of
20,86% in the year 2005.
The company’s Net Result grew 20,67% between 2004 and 2005.
This evolution, compared to the EBIT’s performance, implies that the
financial and extraordinary activities have had a positive effect in the
company’s Financial Profitability.
The result of these variations is an increase of the company’s Economic
Profitability of 7,26% in the analysed period, being equal to 35,01% in the
year 2005.
The company’s sales figure grew 26,33% between 2005 and 2006.
The company’s EBIT grew 5,03% between 2005 and 2006.
This evolution implies a reduction in the company’s operating
profitability.
The result of these variations is a decrease of the company’s Economic
Profitability of 22,24% in the analysed period, being this profitability of
16,22% in the year 2006.
The company’s Net Result decreased in 3,62% between 2005 and 2006.
This evolution, compared to the EBIT’s performance, implies that the
financial and extraordinary activities have had a negative effect in the
company’s Financial Profitability.
The result of these variations is a reduction of the company’s
profitability of 22,92% in the analysed period, being equal to 26,98% in the
year 2006.
ANNUAL FINANCIAL REPORT
ADDITIONAL DATA
Source: annual financial report 2006
Results Distribution
Figures given in €
|
DISTRIBUTION
BASE |
DISTRIBUTION TO |
||
|
Profit and Loss |
23.263.932,00 |
Retained earnings |
0,00 |
|
Carry Over |
0,00 |
Voluntary Reserve |
23.263.932,00 |
|
Voluntary reserves |
0,00 |
Prior years losses |
0,00 |
|
Reserves |
0,00 |
Carry Over |
0,00 |
|
Other concepts |
0,00 |
Other funds |
0,00 |
|
Total of Amounts to be distributed |
23.263.932,00 |
Dividends |
0,00 |
|
|
|
Other Applications |
0,00 |
Auditing
Auditors’ opinion: FAVOURABLE WITH RESERVATIONS
Auditor: KPMG AUDITORES S.L.
Auditing exceptions:
LA SOCIEDAD PRESENTABA AL 31 DE DICIEMBRE DE 2005 UN SALDO DE
EXISTENCIAS DE MATERIA PRIMA POR IMPORTE DE 3.859 MILES DE EUROS QUE SE
ENCONTRABAN UBICADAS, A DICHA FECHA, EN DIVERSOS TALLERES EXTERNOS Y EN LOS
PROPIOS ALMACENES DE LA SOCIEDAD. DADO QUE NUESTRO ENCARGO DE AUDITORIA NOS FUE
COMUNICADO CON POSTERIORIDAD AL 31 DE DICIEMBRE DE 2005 NO PUDIMOS ASISTIR A LA
TOMA DE INVENTARIOS FISICOS DE EXISTENCIAS A LA FECHA INDICADA, NI HEMOS PODIDO
SATISFACERNOS, MEDIANTE OTROS PROCEDIMIENTOS DE AUDITORIA EFECTIVOS, DE LAS
UNIDADES EN EXISTENCIA REPRESENTATIVAS DEL MENCIONADO IMPORTE NI DE LA CIFRA DE
VARIACION DE EXISTENCIAS RELACIONADA POR IMPORTE DE 2.439 MILES DE EUROS Y QUE
FIGURA BAJO EL CAPITULO “APROVISIONAMIENTOS” DE LA CUENTA DE PERDIDAS Y
GANANCIAS ADJUNTA. COMO CONSECUENCIA DE UNA OPERACION DE REESTRUCTURACION
INTRAGRUPO EFECTUADA DURANTE EL EJERCICIO 2005, LA SOCIEDAD ENAJENO UN EDIFICIO
A UNA SOCIEDAD VINCULADA. DICHA OPERACION SE REALIZO A VALOR DE MERCADO,
DETERMN
COMPARATIVE SECTOR ANALYSIS
Values table
Figures expressed in %
|
|
COMPANY (2006) |
SECTOR |
DIFFERENCE |
DIFFERENCE RELATIVE |
|
|
|
|
|
|
BALANCE SHEET ANALYSIS: % on the total
assets |
|
|
|
|
|
|
|
|
|
|
OWN FUNDS |
50,34 |
29,54 |
20,80 |
70,40 |
|
|
|
|
|
|
DEBT |
49,66 |
70,46 |
-20,80 |
-29,52 |
|
|
|
|
|
|
FIXED ASSETS |
29,40 |
40,12 |
-10,73 |
-26,73 |
|
|
|
|
|
|
|
|
|
|
|
|
|
|
|
|
|
|
COMPANY (2006) |
SECTOR |
DIFFERENCE |
DIFFERENCE RELATIVE |
|
|
|
|
|
|
PROFIT AND LOSS ACCOUNT ANALYSIS: % on the total
operating income |
|
|
|
|
|
|
|
|
|
|
SALES |
77,26 |
94,84 |
-17,58 |
-18,54 |
|
|
|
|
|
|
ADDED VALUE |
40,04 |
25,77 |
14,27 |
55,39 |
|
|
|
|
|
|
EBIT |
14,97 |
5,65 |
9,31 |
164,73 |
|
|
|
|
|
|
NET RESULT |
12,53 |
6,18 |
6,35 |
102,66 |
|
|
|
|
|
Sector Composition
Compared sector (NACE): 281
Number of companies: 22
Size (Sales Figure) : > 40.000.000,00
Euros
Comments on the
sectorial comparative
Compared to its sector the assets of the companies show an inferior
proportion of fixed assets. Specifically the difference with the sector average
is -10,73% , which means a relative difference of -26,73% .
In liabilities composition the company appeals on a wider scale to self
financing, being the proportion of net worth of 20,80% superior, which means a
relative difference of 70,40% . As a consequence, external financing sources
are less used by the company in 20,80% less than the sector, which means a
difference of 29,52% .
The proportion that the sales mean to the company’s total ordinary
income is 77,26%, 17,58% lower than in the sector, which means a relative
difference of 18,54% .
The company’s EBIT was positive and was 14,97% with regard to the total
ordinary income, 9,31% higher than in the sector, which means a relative
difference of 164,73% .
The company’s capacity to generate operating income is higher than the
one of the sector as its ratio EBIT/Sales is higher (ES Company versus ES
Sector).
The company’s net result was positive and equal to 12,53% with regard to
the total ordinary income, 6,35% less than the sector, which means a relative
difference of 102,66% .
The financial and extraordinary results and the tax impact have had a
negative impact on the Net result in the company with a worse behaviour than in
the sector; as a consequence, the company shows a worse Net Result/EBIT ratio
(REBEmpresa vs. REBSector).
ADDRESSES
Current Legal Seat Address:
STREET LLOBREGAT, 8 - SECTOR MOLLE
08150
PARETS DEL VALLES BARCELONA
Characteristics of
the current address
Type of premises: office, factory
Property: owned; with no official confirmation
Local Situation: main
|
STREET |
POSTAL CODE |
TOWN |
PROVINCE |
|
STREET OCTAVIO LACANTE PALLISSON 59 |
08100 |
MOLLET DEL VALLES |
Barcelona |
1 branches registered
CORPORATE STRUCTURE
ADMINISTRATIVE LINKS
Main Board members,
Directors and Auditor ![]()
|
POSITION |
SURNAMES AND
NAME |
APPOINTMENT DATE |
|
|
PRESIDENT |
UBINANA FELIX JOSE LUIS |
11/07/2007 |
|
|
ADMINISTRATOR |
PENJA STRATEGY S.L |
11/07/2007 |
|
|
ADMINISTRATOR |
UBINANA ECHARTE MARIA CARMEN |
11/07/2007 |
|
|
ADMINISTRATOR |
UBINANA ECHARTE JOSE LUIS |
11/07/2007 |
|
|
ADMINISTRATOR |
UBINANA ECHARTE MARTA |
11/07/2007 |
|
|
ADMINISTRATOR |
BALLESTER FORNES MAITE |
11/07/2007 |
|
|
ADMINISTRATOR |
VINAS RODRIGUEZ DANIEL |
11/07/2007 |
|
|
ADMINISTRATOR |
NUENO INIESTA PEDRO |
11/07/2007 |
|
|
SECRETARY |
ARRAUT AMAT JAVIER |
11/07/2007 |
|
|
AUDITOR |
APPOINTMENT DATE |
||
|
KPMG AUDITORES S.L |
11/07/2007 |
||
Functional Managers
|
POSITION |
SURNAMES AND
NAME |
|
Financial Manager |
VALUDA LLUIS |
FINANCIAL LINKS
|
|
BUSINESS NAME |
CIF / COUNTRY |
% |
SOURCE |
DATA INF. |
|
|
SOCIEDADES UBE AGRUPADAS S.L. |
B62347117 |
70,00 |
OWN SOURCES |
07/02/2008 |
|
|
3I INTERNATIONAL HOLDINGS |
UNITED KINGDOM |
30,00 |
OWN SOURCES |
07/02/2008 |
You can obtain business information of a foreign company at the
pageD&B International
|
|
BUSINESS NAME |
CIF / COUNTRY |
% |
SOURCE |
DATA INF. |
|
|
STEN SYSTEMS INTERNATIONAL S.L. |
B63923957 |
100,00 |
TRADE REG. |
31/12/2006 |
|
|
STEN-SISTEMAS TECNICOS DE COFRAGENS SOCIEDADE UNIPESSOAL LDA. |
PORTUGAL |
100,00 |
TRADE REG. |
31/12/2006 |
|
|
DINAMIC TALL S.L. |
B61837720 |
10,00 |
TRADE REG. |
31/12/2006 |
|
|
DINAMIC PUNTAL S.L. |
B63049068 |
10,00 |
TRADE REG. |
31/12/2006 |
|
|
FINAVES I SOCIEDAD DE CAPITAL RIESGO DE REGIMEN COMUN S.A. |
A62166251 |
6,25 |
TRADE REG. |
31/12/2006 |
|
|
STEN SOC.UNIPERONAL LDA. |
|
Indet. |
OWN SOURCES |
08/11/2005 |
You can obtain business information of a foreign company at the
pageD&B International
CREDIT INFORMATION
Constitution Date: 05/05/1982
Foundation Date: 01/01/1980
Founder / Origin: Alfredo Cervera
Planas, que en la fecha indicada lo aportó a la titular
Business activity 
Activity: Mfg. of metal structures & parts of
structures
NACE Code: 2811
NACE Activity: Manufacture of
metal structures and parts of structures
Business: FABRICACION DE
PRODUCTOS METALICOS ESTRUCTURALES.
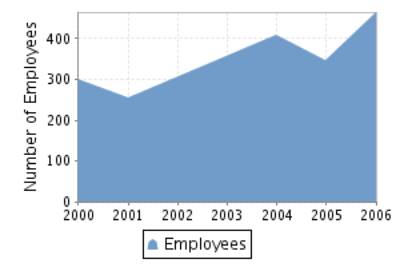
Employees 
Number of total employees: 465 (2008)
Number of fixed employees: 65,81%
Number of temporary employees: 34,19%
Employees evolution
COMMERCIAL OPERATIONS 
SUPPLIERS
|
BUSINESS NAME |
INTERNATIONAL |
|
SISTEMAS
TECNICOS DE COFRAGENS SOCIEDADE UNIPESSOAL LDA. |
YES |
|
INGENIERIA DE
ENCOFRADOS Y SERVICIOS S.L. |
NO |
|
SOCIEDADES UBE
AGRUPADAS S.L. |
NO |
3 proveedores
SALES
Collection (estimated):
On a credit basis: 100%
National Distribution: 100%
CLIENTS
|
BUSINESS NAME |
INTERNATIONAL |
|
SISTEMAS
TECNICOS DE COFRAGENS SOCIEDADE UNIPESSOAL LDA. |
YES |
1 clientes
Banks 
|
ENTITY |
BRANCH |
ADDRESS |
TOWN OR CITY |
PROVINCE |
|
BANCO BILBAO VIZCAYA ARGENTARIA, S.A. |
|
|
PARETS DEL VALLES |
|
|
BANCO POPULAR ESPAÑOL, S.A. |
|
|
PARETS DEL VALLES |
|
2 bank entities registered
Brands, Signs and
Commercial Names ![]()
Name: SISTEMAS TECNICOS ENCOFRADOS STEN (Valid)
Type: DENOMINATIVE Date: 02/08/2001
Name: INGENIERIA DE ENCOFRADOS Y SERVICIOS, S.L. (Valid)
Type: DENOMINATIVE Date: 19/03/1997
LEGAL STRUCTURE
Constitution Data
Register Date: 05/05/1982
Current Legal Form: JOINT STOCK
COMPANY
Current Capital: 166.000,00 €
Legal Aspects
Obligation to fill in Financial
Statements: YES
Chamber census: YES (2006)
Listed on a Stock Exchange: NO
B.O.R.M.E.(Official Companies
Registry Gazette) 
Registered Proceedings
|
PROCEEDINGS |
DATE |
NOTICE NUM. |
TRADE REG. |
|
Change of statutes |
24/03/2008 |
155713 |
Barcelona |
|
Appointments |
27/08/2007 |
441464 |
Barcelona |
|
Resignations |
27/08/2007 |
441463 |
Barcelona |
|
Appointments |
23/07/2007 |
387278 |
Barcelona |
Other Proceedings published
|
PROCEEDINGS |
DATE |
NOTICE NUM. |
TRADE REG. |
|
Registration of accounts (2006) Individual |
03/12/2007 |
1110113 |
Barcelona |
Press articles

18/08/2006 CINCO DIAS (SUBSIDIARIES INFORMATION)
LA SDAD. DE CAPITAL RIESGO 3I ANUNCIO EL 17/08/06 LA ADQUISICION DE UNA
PARTICIPACION DEL 30% DEL CAPITAL DE SISTEMAS TECNICOS ENCOFRADOS (STEN). LA
OPERACION ES FRUTO DE UN ACUERDO CON LOS FUNDADORES Y ACCIONISTAS MAYORITARIOS
DE STEN, QUE MANTIENEN UNA PARTICIPACION MAYORITARIA DEL 70%, Y PRETENDE IMPULSAR
LA INTERNACIONALIZACION DE LA RAMA ESPAÑOLA DE LA EMPRESA. STEN SE DEDICA AL
DESARROLLO DE SISTEMAS ENCOFRADOS Y ANDAMIAJE PARA PROYECTOS DE EDIFICACION Y
FACTURO EN 2005 UN TOTAL DE 128,4 MM. DE EUROS. CUENTA CON 12 DELEGACIONES Y
ALMACENES EN VALENCIA, SEVILLA Y MALLORCA.
07/10/2003 EL P. CATALUNYA (BUSINESS AWARDS INFORMATION)
EL SEMANARIO ECONOMICO DOSSIER ECONOMIC HA ENTREGADO LOS PREMIOS EN SU
QUINTA EDICION. ENTRE LAS EMPRESAS PREMIADAS SE ENCUENTRA LA EMPRESA CATALANA
STEN.
FINANCIAL INFORMATION
The information on the last account contained in this report is
extracted from the Mercantile Register file of the legal address of the Company
and dated 11/10/2007.
BALANCE SHEET
Assets
Figures given in €
|
|
31/12/2004 (12) |
31/12/2005 (12) |
31/12/2006 (12) |
|
A) DUE FROM SHAREHOLDERS FOR UNCALLED CAPITAL |
|
|
|
|
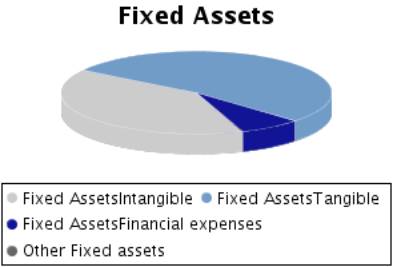
B) FIXED ASSETS |
26.683.927,21 |
36.747.752,46 |
50.346.308,00 |
|
I. Incorporation costs |
|
|
|
|
II. Intangible fixed assets |
807.868,53 |
3.972.830,12 |
20.034.617,00 |
|
R & D expenses |
|
|
241.681,00 |
|
Concessions, patents, licences , trademarks |
|
|
1.634.431,00 |
|
Goodwill |
|
|
|
|
Acquired rights from finance leases |
|
|
|
|
Software |
|
167.545,14 |
382.686,00 |
|
Leasing |
1.245.451,17 |
4.542.143,05 |
24.757.879,00 |
|
Cash advance |
|
|
|
|
Provisions |
|
|
|
|
Depreciation |
-437.582,64 |
-736.858,07 |
-6.982.060,00 |
|
III. Tangible fixed assets |
23.903.802,27 |
30.611.199,87 |
26.573.964,00 |
|
Property, plant and equipment |
5.199,30 |
5.199,30 |
5.199,00 |
|
Machinery, equipment and other |
4.164.024,80 |
4.710.862,22 |
4.009.408,00 |
|
Other property plant and equipment |
4.819.286,76 |
4.948.869,96 |
6.607.121,00 |
|
Prepaid expenses on fixed assets |
|
|
|
|
Other assets |
59.143.123,56 |
72.339.165,12 |
74.676.618,00 |
|
Provisions |
-454.322,00 |
-722.784,00 |
|
|
Depreciation |
-43.773.510,15 |
-50.670.112,73 |
-58.724.382,00 |
|
IV. Financial fixed assets |
1.972.256,41 |
2.163.722,47 |
3.737.727,00 |
|
Shares in affiliated companies |
1.502.530,00 |
1.532.430,00 |
1.532.528,00 |
|
Receivables in affiliated companies |
|
|
647.500,00 |
|
Shares in associated companies |
|
|
691.163,00 |
|
Loans to associated companies |
|
|
|
|
Securities |
187.533,29 |
187.533,29 |
187.534,00 |
|
Other loans |
|
|
|
|
Long term deposits and guarantees |
282.193,12 |
443.759,18 |
667.503,00 |
|
Provisions |
|
|
|
|
Taxes receivable |
|
|
11.499,00 |
|
V.Owners equity |
|
|
|
|
VI.Long term trade liabilities |
|
|
|
|
C) DEFERRED EXPENSES |
2.919,44 |
106.558,35 |
716.428,00 |
|
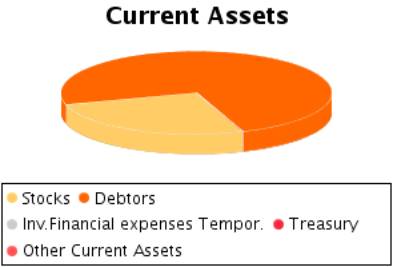
D) CURRENT ASSETS |
69.621.084,59 |
89.943.570,11 |
120.202.051,00 |
|
I. Shareholders by required outlays |
|
|
|
|
II. Stocks |
12.928.898,24 |
18.827.280,30 |
31.436.825,00 |
|
Goods available for sale |
12.928.898,24 |
18.661.498,42 |
|
|
Raw material inventory |
|
|
11.899.892,00 |
|
Work in Progress |
|
|
|
|
Finished goods |
|
|
19.445.967,00 |
|
Subproducts and recycled materials |
|
|
|
|
Cash advance |
|
165.781,88 |
90.966,00 |
|
Provisions |
|
|
|
|
III. Debtors |
56.289.437,29 |
68.714.121,91 |
88.656.862,00 |
|
Clients |
55.180.113,16 |
69.906.334,45 |
91.004.673,00 |
|
Amounts owned by affiliated companies |
6.243.877,57 |
5.969.003,05 |
7.408.859,00 |
|
Amounts owned by associated companies |
|
|
|
|
Other debts |
|
|
|
|
Staff Expenses |
43.522,54 |
76.630,98 |
207.531,00 |
|
Government |
494.133,45 |
1.502.553,56 |
730.360,00 |
|
Provisions |
-5.672.209,43 |
-8.740.400,13 |
-10.694.561,00 |
|
IV. Temporary financial investment |
6.371,72 |
500,00 |
|
|
Shares in affiliated companies |
|
|
|
|
Receivables in affiliated companies |
|
|
|
|
Shares in associated companies |
|
|
|
|
Loans to associated companies |
|
|
|
|
Short term investment |
|
|
|
|
Other loans |
|
|
|
|
Short Term Deposit and guarantees |
6.371,72 |
500,00 |
|
|
Provisions |
|
|
|
|
V. Short-term own shares |
|
|
|
|
VI. Treasury |
313.167,27 |
479.601,78 |
108.364,00 |
|
VII. Periodification adjustments |
83.210,07 |
1.922.066,12 |
|
|
ASSETS (A + B + C + D) |
96.307.931,24 |
126.797.880,92 |
171.264.787,00 |
Assets composition
Liabilities
Figures given in €
|
|
31/12/2004 (12) |
31/12/2005 (12) |
31/12/2006 (12) |
|
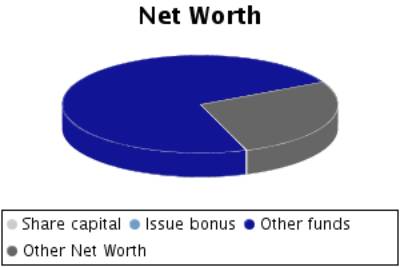
A) SHAREHOLDERS EQUITY |
61.288.736,14 |
68.950.521,89 |
86.214.454,00 |
|
I. Share capital |
165.999,98 |
165.999,98 |
166.000,00 |
|
II. Issue bonus |
|
|
|
|
III.Revaluation reserve |
|
|
|
|
IV.Reserves |
41.120.278,10 |
44.647.736,16 |
62.784.522,00 |
|
Retained earnings |
49.006,09 |
49.006,09 |
49.006,00 |
|
Sinking fund from owner equity |
|
|
|
|
Reserve for the parent company capital |
|
|
|
|
Statutory reserve |
|
|
|
|
Other funds |
41.071.272,01 |
44.598.730,07 |
62.735.516,00 |
|
Capital adjustments in Euros |
|
|
|
|
V.Results from previous years |
|
|
|
|
Carry Over |
|
|
|
|
Prior years losses |
|
|
|
|
Loans from partners for losses compensation |
|
|
|
|
VI.Profit and Losses |
20.002.458,06 |
24.136.785,75 |
23.263.932,00 |
|
VII.Dividend paid during the year |
|
|
|
|
VIII.Own shares for capital reduction |
|
|
|
|
B) DEFERRED INCOME |
|
|
|
|
Capital grants |
|
|
|
|
Positive change difference |
|
|
|
|
Other deferred income |
|
|
|
|
Fiscal deferred income |
|
|
|
|
C) PROVISIONS FOR LIABILITIES AND EXPENSES |
|
|
|
|
Provision for pensions plans |
|
|
|
|
Provision for taxes |
|
|
|
|
Other provisions |
|
|
|
|
Reversion fund |
|
|
|
|
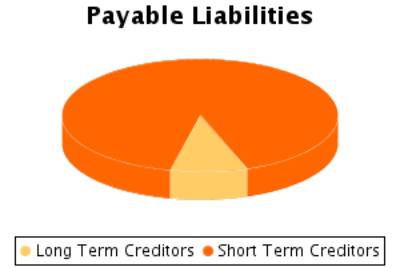
D) LONG TERM LIABILITIES |
7.883,04 |
1.846.292,54 |
7.680.714,00 |
|
I.Negotiable bonds and other negotiable values |
|
|
|
|
Non convertible securities |
|
|
|
|
Convertible securities |
|
|
|
|
Other convertible debentures |
|
|
|
|
II.Debt with bank entities |
7.883,04 |
1.846.292,54 |
7.605.433,00 |
|
Long term bank loans |
|
|
|
|
Leasing |
7.883,04 |
1.846.292,54 |
7.605.433,00 |
|
III.Debts with associated and affiliated
companies |
|
|
|
|
With affiliated companies |
|
|
|
|
Associated companies |
|
|
|
|
IV. Other creditors |
|
|
75.281,00 |
|
Bills payable |
|
|
|
|
Other debts |
|
|
|
|
Long term deposit and guaranties |
|
|
|
|
Taxes receivable |
|
|
75.281,00 |
|
V. Deferred debts on shares |
|
|
|
|
From affiliated companies |
|
|
|
|
From associated companies |
|
|
|
|
Other companies |
|
|
|
|
VI. Long term debt with creditor |
|
|
|
|
E) SHORT TERM LIABILITIES |
35.011.312,06 |
56.001.066,49 |
77.369.619,00 |
|
I.Negotiable bonds and other negotiable values |
|
|
|
|
Non convertible securities |
|
|
|
|
Convertible securities |
|
|
|
|
Other convertible debentures |
|
|
|
|
Interests from bonds |
|
|
|
|
II.Debt with bank entities |
11.748.154,29 |
25.454.491,71 |
40.780.238,00 |
|
Loans and other debts |
11.612.170,48 |
23.260.222,02 |
28.886.615,00 |
|
Debt interest |
|
|
|
|
Leasing |
135.983,81 |
2.194.269,69 |
11.893.623,00 |
|
III. Short term debts with associated and
affiliated companies |
893.200,00 |
2.895.890,82 |
4.828.994,00 |
|
With affiliated companies |
893.200,00 |
2.895.890,82 |
4.828.994,00 |
|
Associated companies |
|
|
|
|
IV. Commercial creditors |
11.758.366,20 |
13.403.526,63 |
19.472.299,00 |
|
Accounts payable |
|
50.573,86 |
1.384.129,00 |
|
Expenses |
11.758.366,20 |
13.352.952,77 |
18.088.170,00 |
|
Bills payable |
|
|
|
|
V. Other non-commercial debt |
8.700.554,57 |
12.653.315,90 |
9.262.752,00 |
|
Government |
7.314.483,05 |
11.235.835,76 |
7.972.246,00 |
|
Bills payable |
|
|
|
|
Other debts |
|
49.631,57 |
|
|
Accounts receivable |
1.304.634,58 |
1.225.864,52 |
1.244.329,00 |
|
Short term deposits and guarantees |
81.436,94 |
141.984,05 |
46.177,00 |
|
VI. Provisions for current assets |
1.911.037,00 |
1.203.295,87 |
1.534.933,00 |
|
VII. Periodification adjustments |
|
390.545,56 |
1.490.403,00 |
|
F) SHORT TERM PROVISIONS FOR LIABILITIES AND
EXPENSES |
|
|
|
|
LIABILITIES (A + B + C + D + E + F) |
96.307.931,24 |
126.797.880,92 |
171.264.787,00 |
Liabilities Composition
PROFIT AND LOSS ACCOUNT
Itams of the Profit
and Loss Account
Figures given in €
|
|
31/12/2004 (12) |
31/12/2005 (12) |
31/12/2006 (12) |
|
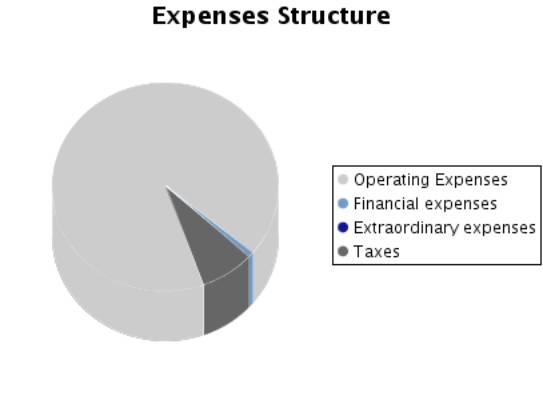
A) EXPENSES (A.1 a A.16) |
107.957.874,25 |
134.179.874,61 |
171.825.766,00 |
|
A.1.Reduction in stocks of finished goods and
work in progress |
|
|
|
|
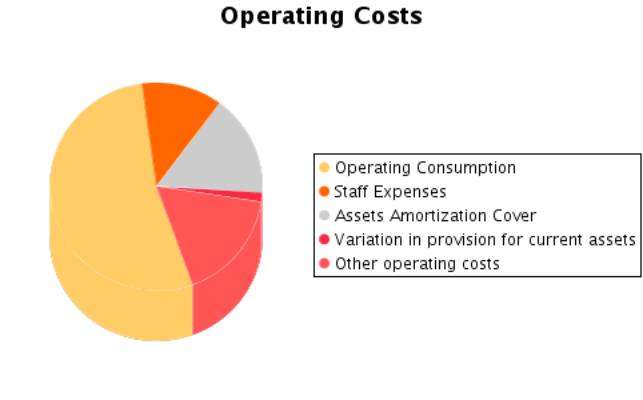
A.2.Supplies |
49.508.382,40 |
63.558.835,31 |
84.242.522,00 |
|
Material consumed |
|
|
|
|
Raw materials consumed |
29.401.548,18 |
32.601.079,14 |
47.872.682,00 |
|
Other expenses |
20.106.834,22 |
30.957.756,17 |
36.369.840,00 |
|
A.3. Labour cost |
14.212.603,05 |
16.603.356,99 |
19.551.344,00 |
|
Wages |
11.175.663,60 |
13.223.295,58 |
15.770.570,00 |
|
Social security expenses |
3.036.939,45 |
3.380.061,41 |
3.780.774,00 |
|
A.4. Assets depreciation |
15.021.998,62 |
18.383.293,09 |
24.701.836,00 |
|
A.5.Variance in the traffic provisions |
859.518,01 |
2.360.449,58 |
2.285.799,00 |
|
Variance in provision for inventory |
|
|
|
|
Variance in provision for bad debts |
456.260,01 |
3.068.190,71 |
1.954.162,00 |
|
Variance in provision for other current assets |
403.258,00 |
-707.741,13 |
331.637,00 |
|
A.6. Other operating costs |
16.441.453,05 |
20.283.909,62 |
27.040.642,00 |
|
External costs |
16.205.729,70 |
19.694.166,57 |
26.405.160,00 |
|
Taxes |
235.723,35 |
589.743,05 |
635.482,00 |
|
Other day to day expenses |
|
|
|
|
Allowance to reversion fund |
|
|
|
|
A.I.OPERATING RESULT (B.1+B.2+B.3+B.4-A.1-A.2-A.3-A.4-A.5-A.6) |
29.192.158,04 |
26.444.139,30 |
27.774.851,00 |
|
A.7.Financial expenses and similar |
341.829,82 |
646.093,38 |
1.311.490,00 |
|
Debts with related companies |
341.829,82 |
646.093,38 |
1.311.490,00 |
|
Debts with associated companies |
|
|
|
|
By debts with third parties and similar expenses |
|
|
|
|
Losses from financial investments |
|
|
|
|
A.8. Variation in financial investment provision |
|
|
|
|
A.9.Negative exchange difference |
6.155,75 |
13.833,00 |
12.744,00 |
|
A.II.POSITIVE FINANCIAL RESULTS
(B.5+B.6+B.7+B.8-A.7-A.8-A.9) |
|
|
|
|
A.III.PROFIT FROM ORDINARY ACTIVITIES
(A.I+A.II-B.I-B.II) |
29.072.827,15 |
26.113.768,26 |
27.023.191,00 |
|
A.10. Variation in provision in fixed assets |
151.647,00 |
268.462,00 |
-722.784,00 |
|
A.11. Losses in fixed assets |
681.000,78 |
|
1.743,00 |
|
A.12. Losses from own shares and bonds |
|
|
|
|
A.13. Extraordinary charges |
|
|
584,00 |
|
A.14.Other exercises’ expenses and losses |
|
|
|
|
A.IV.POSITIVE EXTRAORDINARY RESULT
(B.9+B.10+B.11+B.12+B.13-A.10-A.11-A.12-A.13-A.14) |
1.662.916,68 |
10.084.659,13 |
9.640.587,00 |
|
A.V.PROFIT BEFORE TAXES (A.III+A.IV-B.III-B.IV) |
30.735.743,83 |
36.198.427,39 |
36.663.778,00 |
|
A.15.Corporate Taxes |
10.733.285,77 |
12.061.641,64 |
13.399.846,00 |
|
A.16. Other taxes |
|
|
|
|
A.VI.EXERCISE RESULT (PROFIT) (A.V-A.14-A.15) |
20.002.458,06 |
24.136.785,75 |
23.263.932,00 |
|
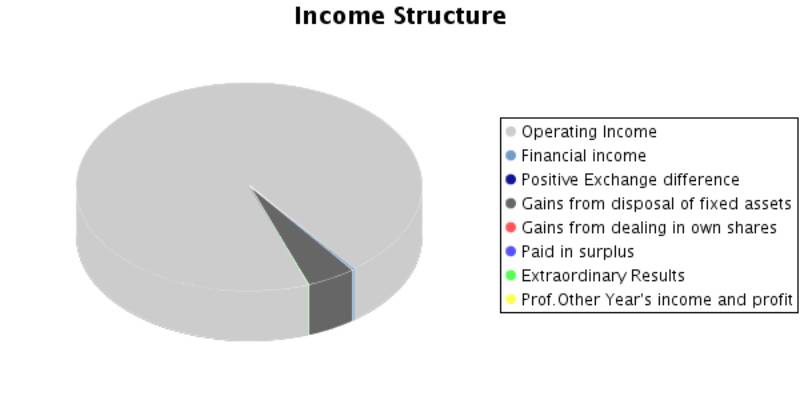
B) INCOMES (B.1 a B13) |
127.960.332,31 |
158.316.660,36 |
195.089.698,00 |
|
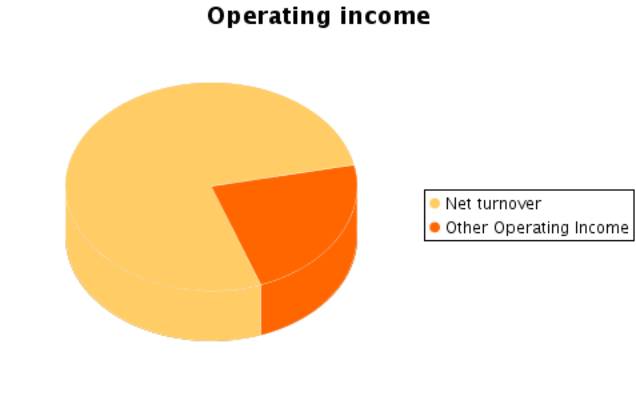
B.1. Turnover |
101.764.900,89 |
113.504.411,65 |
143.391.288,00 |
|
Sales |
112.507.168,16 |
58.533.758,56 |
71.618.838,00 |
|
Services provided |
|
79.744.684,27 |
102.293.239,00 |
|
Refunds and sale reminders |
-10.742.267,27 |
-24.774.031,18 |
-30.520.789,00 |
|
B.2.Increase in inventory of finished goods and
works in progress |
|
|
|
|
B.3.Expenses capitalized |
17.964.791,14 |
28.149.979,55 |
34.730.229,00 |
|
B.4. Other operating income |
5.506.421,14 |
5.979.592,69 |
7.475.477,00 |
|
Other incomes |
5.491.109,08 |
5.974.847,24 |
7.475.477,00 |
|
Grants |
15.312,06 |
4.745,45 |
|
|
Excess in provision for liabilities and charges |
|
|
|
|
B.I.OPERATING LOSSES
(A.1+A.2+A.3+A.4+A.5+A.6-B.1-B.2-B.3-B.4) |
|
|
|
|
B.5.Incomes from share participations |
2.883,00 |
3.199,20 |
3.526,00 |
|
From affiliated companies |
2.883,00 |
3.199,20 |
3.526,00 |
|
From associated companies |
|
|
|
|
From other companies |
|
|
|
|
B.6.Income from other securities and credits to
fixed assets |
|
|
7.454,00 |
|
From affiliated companies |
|
|
7.454,00 |
|
From associated companies |
|
|
|
|
Other companies |
|
|
|
|
B.7.Other interests and similar |
213.471,79 |
326.355,67 |
561.594,00 |
|
From affiliated companies |
213.471,79 |
326.355,67 |
561.594,00 |
|
From associated companies |
|
|
|
|
Other Interests |
|
|
|
|
Profits from investments |
|
|
|
|
B.8. Positive change difference |
12.299,89 |
0,47 |
|
|
B.II. NEGATIVE FINANCIAL RESULTS
(A.7+A.8+A.9-B.5-B.6-B.7-B.8) |
119.330,89 |
330.371,04 |
751.660,00 |
|
B.III.LOSSES FROM ORDINARY ACTIVITIES
(B.I+B.II-A.I-A.II) |
|
|
|
|
B.9.B.9. Gains from disposal of fixed assets |
2.495.564,46 |
9.663.364,66 |
8.817.045,00 |
|
B.10.Gains from dealing in own shares |
|
|
|
|
B.11. Paid in surplus |
|
|
|
|
B.12. Extraordinary income |
|
81.170,87 |
103.085,00 |
|
B.13.Other year’s income and profits |
|
608.585,60 |
|
|
B.IV.NEGATIVE EXTRAORDINARY LOSSES
(A.10+A.11+A.12+A.13+A.14-B.9-B.10-B.11-B.12-B.13) |
|
|
|
|
B.V.LOSS BEFORE TAXES (B.III+B.IV-A.III-A.IV) |
|
|
|
|
B.VI.EXERCISE RESULTS (LOSS) (B.V+A.14+A.15) |
|
|
|
Composition of the
Profit and Loss Account
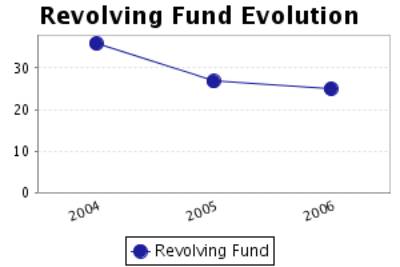
FINANCIAL BALANCE
Here the Main Capital Amounts of the company and the Revolving Fund
Evolution are analysed.
Financial Balance
Table
Figures given in €
|
|
31/12/2004 (12) |
% |
31/12/2005 (12) |
% |
31/12/2006 (12) |
% |
|
A) DUE FROM SHAREHOLDERS FOR UNCALLED CAPITAL |
|
|
|
|
|
|
|
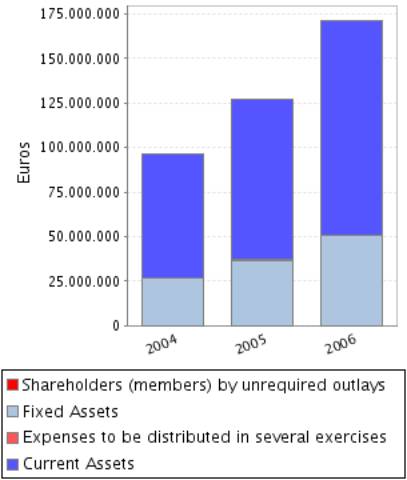
B) FIXED ASSETS |
26.683.927,21 |
27,71 |
36.747.752,46 |
28,98 |
50.346.308,00 |
29,40 |
|
C) DEFERRED EXPENSES |
2.919,44 |
0,00 |
106.558,35 |
0,08 |
716.428,00 |
0,42 |
|
D) CURRENT ASSETS |
69.621.084,59 |
72,29 |
89.943.570,11 |
70,93 |
120.202.051,00 |
70,18 |
|
ASSETS (A + B + C + D) |
96.307.931,24 |
|
126.797.880,92 |
|
171.264.787,00 |
|
|
|
||||||
|
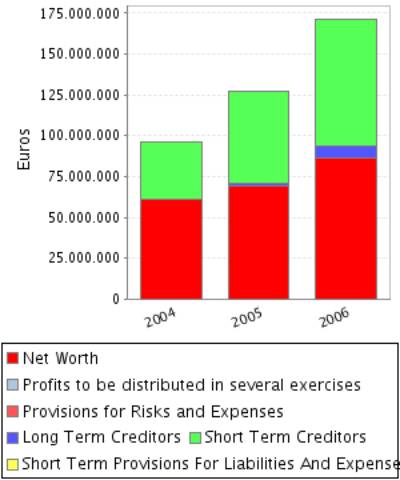
A) SHAREHOLDERS EQUITY |
61.288.736,14 |
63,64 |
68.950.521,89 |
54,38 |
86.214.454,00 |
50,34 |
|
B) DEFERRED INCOME |
|
|
|
|
|
|
|
C) PROVISIONS FOR LIABILITIES AND EXPENSES |
|
|
|
|
|
|
|
D) LONG TERM LIABILITIES |
7.883,04 |
0,01 |
1.846.292,54 |
1,46 |
7.680.714,00 |
4,48 |
|
E) SHORT TERM LIABILITIES |
35.011.312,06 |
36,35 |
56.001.066,49 |
44,17 |
77.369.619,00 |
45,18 |
|
F) SHORT TERM PROVISIONS FOR LIABILITIES AND EXPENSES |
|
|
|
|
|
|
|
LIABILITIES (A + B + C + D + E + F) |
96.307.931,24 |
|
126.797.880,92 |
|
171.264.787,00 |
|
Financial Balance
Composition
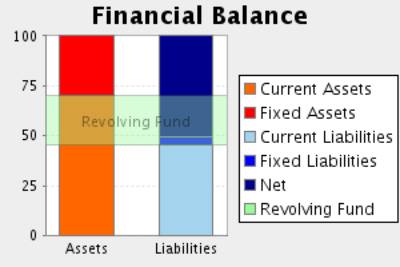
Comments on Financial
Balance
In the 2004, the assets of the company were formed in 27,71% of Fixed
Assets and in 72,29% of Current Assets.This assets were financed in 63,64% with
own capitals, and in 0,01% with long term debt and in 36,35% with current
liabilities.
The result of this financial structure is a positive turnover fund of
34.609.772,53 Euros, which is equivalent to 35,94% proportion of the
company’s total assets.
In the 2005, the assets of the company were formed in 29,07% of Fixed
Assets and in 70,93% of Current Assets.This assets were financed in 54,38% with
own capitals, and in 1,46% with long term debt and in 44,17% with current
liabilities.
The result of this financial structure is a positive turnover fund of
33.942.503,62 Euros, which is equivalent to 26,77% proportion of the
company’s total assets.
This measure has diminished with respect to the previous exercise in
1,93% having also diminished its proportion with respect to the total assets of
the company.
In the 2006, the assets of the company were formed in 29,82% of Fixed
Assets and in 70,18% of Current Assets.This assets were financed in 50,34% with
own capitals, and in 4,48% with long term debt and in 45,18% with current
liabilities.
The result of this financial structure is a positive turnover fund of
42.832.432,00 Euros, which is equivalent to 25,01% proportion of the company’s
total assets.
This measure has increased with respect to the previous exercise in
26,19% having, however, diminished its proportion with respect to the total
assets of the company.
RATIOS
Main Ratios
|
|
31/12/2004 (12) |
31/12/2005 (12) |
31/12/2006 (12) |
|
STRUCTURAL RATIOS |
|
|
|
|
Management fund |
34.609.772,53 |
33.942.503,62 |
42.832.432,00 |
|
Management Fund Requirement |
46.038.387,83 |
58.916.893,55 |
83.504.306,00 |
|
Indebtedness (%) |
36,36 |
45,62 |
49,66 |
|
External Funds on Net Worth |
0,57 |
0,84 |
0,99 |
|
GENERAL ACTIVITY RATIO |
|
|
|
|
Turnover Increase (%) |
|
11,54 |
26,33 |
|
Added value growth (%) |
|
7,60 |
16,50 |
|
Cash Flow |
36.035.621,69 |
45.148.990,42 |
49.528.783,00 |
|
Labour Productivity |
4,17 |
3,84 |
3,80 |
|
Assets turnover |
1,06 |
0,90 |
0,84 |
|
Breakdown Point |
76.959.050,45 |
101.198.697,11 |
134.736.595,31 |
|
Security Margin of the Breakdown Point (%) |
38,55 |
31,45 |
27,40 |
|
ACTIVITY RATIOS |
|
|
|
|
Average Payment Period |
86 |
76 |
83 |
|
Average Collection Period |
199 |
218 |
223 |
|
Inventory Turnover Period |
46 |
60 |
79 |
|
SOLVENCY RATIOS |
|
|
|
|
Payback Capacity |
1,03 |
0,78 |
0,58 |
|
Assets Guarantee |
2,75 |
2,19 |
2,00 |
|
Short Term Debts Proportion (%) |
99,98 |
96,81 |
90,97 |
|
Interest Coverage |
97,01 |
52,93 |
31,08 |
|
LIQUIDITY RATIOS |
|
|
|
|
Current Ratio |
1,99 |
1,61 |
1,55 |
|
Immediate liquidity |
0,01 |
0,01 |
0,00 |
|
Treasury |
-11.428.615,30 |
-24.974.389,93 |
-40.671.874,00 |
|
Sales on Current Assets |
526 |
454 |
429 |
Results Analysis
Ratios
|
|
31/12/2004 (12) |
31/12/2005 (12) |
31/12/2006 (12) |
|
Economic profitability (%) |
30,31 |
20,86 |
16,22 |
|
Operating Profitability (%) |
28,69 |
23,30 |
19,37 |
|
Equity gearing |
1,56 |
1,82 |
1,93 |
|
Financial profitability (%) |
32,64 |
35,01 |
26,98 |
|
General Profitability (%) |
19,66 |
21,26 |
16,22 |
Comments on the
Results Analysis Ratios
The economic profitability in the year2005 achieved a 20,86% positive
level, due to a 23,30% economic margin and to an assets turnover of0,90%.
The economic profitability in the year has reduced from 30,31% up to
20,86% of2005, even if it remains positive. This fall is due to the decrease in
operating profitability, that has passe from 28,69% to 23,30%, as assets
turnover whose index has passed from 1,06 to 0,90%.
Financial profitability on 2005 achieved a 35,01%.
The company’s financial structure has instigated its economic
profitability with an indebtedness level of 1,82.
The general profitability on 2005 achieved a 21,26%.
The economic profitability in the year2006 achieved a 16,22% positive
level, due to a 19,37% economic margin and to an assets turnover of0,84%.
The economic profitability in the year has reduced from 20,86% up to
16,22% of2006, even if it remains positive. This fall is due to the decrease in
operating profitability, that has passe from 23,30% to 19,37%, as assets
turnover whose index has passed from 0,90 to 0,84%.
Financial profitability on 2006 achieved a 26,98%.
The company’s financial structure has instigated its economic
profitability with an indebtedness level of 1,93.
The general profitability on 2006 achieved a 16,22%.
SECTORIAL ANÁLYSIS
Large Capital Amounts
and Financial Balance
Figures given in %
|
|
COMPANY (2006) |
SECTOR |
DIFFERENCE |
DIFFERENCE RELATIVE |
|
|
|
|
|
|
ASSETS |
|
|
|
|
|
|
|
|
|
|
A) DUE FROM SHAREHOLDERS FOR UNCALLED CAPITAL |
|
0,00 |
|
|
|
|
|
|
|
|
B) FIXED ASSETS |
29,40 |
40,12 |
-10,72 |
-26,72 |
|
|
|
|
|
|
C) DEFERRED EXPENSES |
0,42 |
0,34 |
0,08 |
22,45 |
|
|
|
|
|
|
D) CURRENT ASSETS |
70,18 |
59,54 |
10,65 |
17,88 |
|
|
|
|
|
|
ASSETS (A + B + C + D) |
100 |
100 |
|
|
|
|
|
|
|
|
|
|
|
|
|
|
|
|
|
|
|
|
COMPANY (2006) |
SECTOR |
DIFFERENCE |
DIFFERENCE RELATIVE |
|
|
|
|
|
|
LIABILITIES |
|
|
|
|
|
|
|
|
|
|
A) SHAREHOLDERS EQUITY |
50,34 |
29,28 |
21,06 |
71,92 |
|
|
|
|
|
|
B) DEFERRED INCOME |
|
0,26 |
|
|
|
|
|
|
|
|
C) PROVISIONS FOR LIABILITIES AND EXPENSES |
|
0,78 |
|
|
|
|
|
|
|
|
D) LONG TERM LIABILITIES |
4,48 |
19,91 |
-15,43 |
-77,50 |
|
|
|
|
|
|
E) SHORT TERM LIABILITIES |
45,18 |
49,77 |
-4,59 |
-9,23 |
|
|
|
|
|
|
F) SHORT TERM PROVISIONS FOR LIABILITIES AND EXPENSES |
|
0,00 |
|
|
|
|
|
|
|
|
LIABILITIES (A + B + C + D + E + F) |
100 |
100 |
|
|
|
|
|
|
|
Financial Balance
Composition
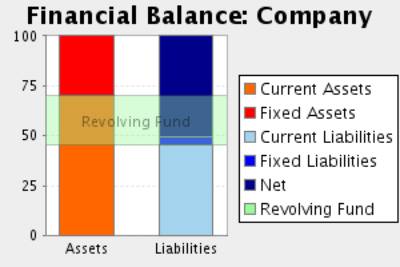
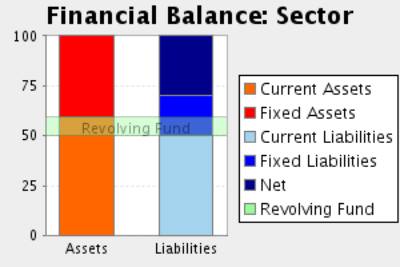
Comments to the
Sectorial Analysis
In the 2006, the assets of the company were formed in 29,82% of fixed
assets and in 70,18Current Assets % In the sector, the proportion of fixed
assets was of 40,46%, 26,31% superior, and the proportion of current assets was
of 59,54%, 17,88% inferior.
The assets were financed in the company in 50,34% with own capitals , in
4,48% with fixed liabilities and in 45,18% with current liabilities In the
sector, the self financing represented 29,54%, 70,40% inferior. On the other
hand the long term debts represented in the sector an average of 20,69%
financing, with a relative difference of 78,34% favourable to the sectorAnd,
short term liabilities represented in the sector an average of 49,77% financing,
with a relative difference of 9,23% favourable to the sector
The result of this company’s financial structure is a turnover fund that
represents 25,01% of the total assets; in the sector, this same proportion is
9,76%, therefore, we can say that the company’s turnover fund is 156,17% higher
than the one in of the sector.
Analytical Account of
Results
Figures given in %
|
|
COMPANY (2006) |
SECTOR |
DIFFERENCE |
DIFFERENCE RELATIVE |
|
Turnover |
77,26 |
94,84 |
-17,58 |
-18,54 |
|
Other operating income |
22,74 |
5,16 |
17,58 |
340,70 |
|
Production Value |
100,00 |
100,00 |
0,00 |
0,00 |
|
Operating expenses |
45,39 |
62,95 |
-17,56 |
-27,90 |
|
Other operation expenses |
14,57 |
11,28 |
3,29 |
29,17 |
|
Added value |
40,04 |
25,77 |
14,27 |
55,39 |
|
Labour cost |
10,53 |
16,64 |
-6,11 |
-36,73 |
|
Gross Economic Result |
29,51 |
9,12 |
20,38 |
223,40 |
|
Assets depreciation |
13,31 |
3,24 |
10,07 |
310,17 |
|
Variation in provision for current assets and bad debt losses |
1,23 |
0,23 |
1,00 |
441,85 |
|
Net Economic Result |
14,97 |
5,65 |
9,32 |
164,82 |
|
Financial income |
0,31 |
2,50 |
-2,19 |
-87,60 |
|
Financial Charges |
0,71 |
1,51 |
-0,80 |
-52,98 |
|
Variation in financial investment provision |
|
-0,02 |
|
|
|
Ordinary Activities Result |
14,56 |
6,67 |
7,89 |
118,36 |
|
Extraordinary income |
4,81 |
3,04 |
1,77 |
58,48 |
|
Extraordinary charges |
0,00 |
0,92 |
-0,92 |
-100,00 |
|
Variation in provision in fixed assets |
-0,39 |
0,32 |
-0,71 |
-222,26 |
|
Results before Taxes |
19,75 |
8,47 |
11,28 |
133,29 |
|
Corporate taxes |
7,22 |
2,28 |
4,94 |
216,53 |
|
Net Result |
12,53 |
6,18 |
6,34 |
102,59 |
|
Assets depreciation |
13,31 |
3,24 |
10,07 |
310,17 |
|
Change of Provisions |
0,84 |
0,52 |
0,32 |
61,23 |
|
Net Self-Financing |
26,69 |
9,95 |
16,74 |
168,21 |
Main Ratios
|
|
COMPANY (2006) |
PTILE25 |
PTILE50 |
PTILE75 |
|
STRUCTURAL RATIOS |
|
|
|
|
|
Management fund |
42.832.432,00 |
388,98 |
11.435,81 |
17.223,25 |
|
Management Fund Requirement |
83.504.306,00 |
-22.778,31 |
-8.393,72 |
510,82 |
|
Indebtedness (%) |
49,66 |
62,64 |
74,01 |
81,80 |
|
External Funds on Net Worth |
0,99 |
1,68 |
2,85 |
4,50 |
|
GENERAL ACTIVITY RATIO |
|
|
|
|
|
Turnover Increase (%) |
26,33 |
-2,04 |
13,69 |
27,64 |
|
Added value growth (%) |
16,50 |
-8,75 |
3,85 |
11,31 |
|
Cash Flow |
49.528.783,00 |
2.719,35 |
3.960,31 |
7.480,94 |
|
Labour Productivity |
3,80 |
1,23 |
1,74 |
3,01 |
|
Assets turnover |
0,84 |
0,70 |
1,18 |
1,39 |
|
Breakdown Point |
134.736.595,31 |
37.269.412,78 |
70.956.197,10 |
102.012.816,46 |
|
Security Margin of the Breakdown Point (%) |
27,40 |
6,52 |
14,61 |
31,45 |
|
ACTIVITY RATIOS |
|
|
|
|
|
Average Payment Period |
83 |
64 |
120 |
207 |
|
Average Collection Period |
223 |
114 |
143 |
220 |
|
Inventory Turnover Period |
79 |
13 |
31 |
63 |
|
SOLVENCY RATIOS |
|
|
|
|
|
Payback Capacity |
0,58 |
0,06 |
0,08 |
0,22 |
|
Assets Guarantee |
2,00 |
1,22 |
1,35 |
1,60 |
|
Short Term Debts Proportion (%) |
90,97 |
68,68 |
84,80 |
95,93 |
|
Interest Coverage |
31,08 |
1,34 |
4,50 |
9,15 |
|
LIQUIDITY RATIOS |
|
|
|
|
|
Current Ratio |
1,55 |
1,00 |
1,23 |
1,49 |
|
Immediate liquidity |
0,00 |
0,02 |
0,09 |
0,31 |
|
Treasury |
-40.671.874,00 |
-12.406,16 |
-6.653,70 |
3.004,91 |
|
Sales on Current Assets |
429 |
443 |
606 |
818 |
Results Analysis
Ratios
|
|
COMPANY (2006) |
PTILE25 |
PTILE50 |
PTILE75 |
|
Economic profitability (%) |
16,22 |
2,78 |
3,83 |
8,75 |
|
Operating Profitability (%) |
19,37 |
2,44 |
5,79 |
8,20 |
|
Equity gearing |
1,93 |
2,52 |
3,71 |
6,00 |
|
Financial profitability (%) |
26,98 |
5,63 |
16,92 |
26,63 |
|
General Profitability (%) |
16,22 |
1,42 |
3,40 |
7,94 |
NOTES
The address included in your enquiry Cl Octavio Lacaute 59 Pg Ind Can
Magarola,Mollet del Valles, belong to a branch.
RATING
EXPLANATIONS
|
RATING |
STATUS |
PROPOSED CREDIT LINE |
|
|
>86 |
Aaa |
Possesses an extremely sound financial base with the strongest
capability for timely payment of interest and principal sums |
Unlimited |
|
71-85 |
Aa |
Possesses adequate working capital. No caution needed for credit transaction.
It has above average (strong) capability for payment of interest and
principal sums |
Large |
|
56-70 |
A |
Financial & operational base are regarded healthy. General unfavourable
factors will not cause fatal effect. Satisfactory capability for payment of
interest and principal sums |
Fairly Large |
|
41-55 |
Ba |
Overall operation is considered normal. Capable to meet normal
commitments. |
Satisfactory |
|
26-40 |
B |
Unfavourable & favourable factors carry similar weight in credit
consideration. Capability to overcome financial difficulties seems
comparatively below average. |
Small |
|
11-25 |
Ca |
Adverse factors are apparent. Repayment of interest and principal sums
in default or expected to be in default upon maturity |
Limited with
full security |
|
<10 |
C |
Absolute credit risk exists. Caution needed to be exercised |
Credit not
recommended |
|
NR |
In view of the lack of information, we have no basis upon which to
recommend credit dealings |
No Rating |
|
This score serves as a reference to assess SC’s credit risk
and to set the amount of credit to be extended. It is calculated from a composite
of weighted scores obtained from each of the major sections of this report. The
assessed factors and their relative weights (as indicated through %) are as
follows:
Financial
condition (40%) Ownership
background (20%) Payment
record (10%)
Credit history
(10%) Market trend
(10%) Operational
size (10%)