![]()
MIRA
INFORM REPORT
|
Report Date : |
10.06.2008 |
IDENTIFICATION
DETAILS
|
Name : |
QUALICAPS EUROPE S.A. |
|
|
|
|
Registered Office : |
Street De La Granja (P I Alcobendas), 49 28108
Alcobendas Madrid |
|
|
|
|
Country : |
Spain |
|
|
|
|
Financials (as on) : |
31.12.2006 |
|
|
|
|
Date of Incorporation : |
|
|
|
|
|
Legal Form : |
Joint Stock Company |
|
|
|
|
Line of Business : |
Manufacturing of Basic
Pharmaceutical Products |
RATING &
COMMENTS
|
MIRA’s Rating : |
Aa |
|
RATING |
STATUS |
PROPOSED CREDIT LINE |
|
|
71-85 |
Aa |
Possesses adequate working capital. No caution needed for credit
transaction. It has above average (strong) capability for payment of interest
and principal sums |
Large |
|
Maximum Credit Limit : |
1.360.000,24 € |
|
|
|
|
Status : |
Very Good |
|
|
|
|
Payment Behaviour : |
Regular |
|
|
|
|
Litigation : |
Clear |
FINANCIAL
REPORT
QUALICAPS EUROPE S.A.
TAX NUMBER: A80412836
EXECUTIVE SUMMARY
Identification
Current Business Name: QUALICAPS EUROPE
S.A.
Other names: YES
Current Address: STREET DE
LA GRANJA (P I ALCOBENDAS), 49, CP 28108, ALCOBENDAS MADRID
Telephone number: 916630800 Fax: 916630830
URL: www.qualicaps.com
Corporate e-mail: rrhqualicaps@qualicaps.es
Commercial Risk
Credit Appraisal:
1.360.000,24 €
Legal Actions: NO
Financial Information
Latest Balance sheet sales (2006): 40.402.400,00 € (MERCANTILE REGISTER)
Result: 614.675 €
Total Assets: 63.460.781 €
Social Capital: 15.626.000,00 €
Employees: 240
Commercial Information
Constitution Date: 10/09/1992
Business activity: Mfg. of basic
pharmaceutical products
NACE Code: 2441
International Operations: Imports and
Exports
Corporate Structure
President:
Parent Company:
Other Complementary Information
Latest proceeding published in BORME: 29/11/2007 Registration
of accounts
Latest press article: 06/12/2005 GACETA
NEG (INFORMATION ON LEGAL ANNOUNCE)
Bank Entities: Yes
Credit Appraisal
Maximum Credit (from 0 a 6,000,000 €):
1.360.000,24 €
Rating Evolution

Financial Situation
Fiscal year2006
|
Treasury |
Excellent |
|
Indebtedness |
Very Weak |
|
Profitability |
Average |
|
Balance |
Excellent |
Performance
|
Legal Actions |
None or Negligible |
|
Business Trajectory |
Excellent |
|
|
|
INCIDENTS

Summary
LEGAL ACTIONS: No legal
incidences registered
CLAIM FILED AGAINST THE ADMINISTRATION: No administrative
claims registered
AFFECTED BY: No significant
element.
FINANCIAL ELEMENTS AND SECTORIAL
COMPARATIVE
FINANCIAL ELEMENTS
Figures given in €
|
|
2004 (12) |
2005 (12) |
2006 (12) |
% ASSETS |
|
|
|
|
|
|
BALANCE SHEET ANALYSIS |
|
|
|
|
|
|
|
|
|
|
OWN FUNDS |
35.975.195,00 |
39.159.430,00 |
40.282.330,00 |
63,48 |
|
|
|
|
|
|
DEBT |
7.147.041,00 |
29.259.594,00 |
23.178.451,00 |
36,52 |
|
|
|
|
|
|
FIXED ASSETS |
16.198.658,00 |
17.582.225,00 |
17.165.649,00 |
27,05 |
|
|
|
|
|
|
TOTAL ASSETS |
43.122.236,00 |
68.419.024,00 |
63.460.781,00 |
|
|
|
|
|
|
|
|
|
|
|
|
|
|
|
|
|
|
|
2004 (12) |
2005 (12) |
2006 (12) |
% SALES |
|
|
|
|
|
|
PROFIT AND LOSS ACCOUNT ANALYSIS |
|
|
|
|
|
|
|
|
|
|
SALES |
33.004.553,00 |
35.829.641,00 |
40.402.400,00 |
|
|
|
|
|
|
|
ADDED VALUE |
18.739.610,00 |
20.136.089,00 |
22.050.678,00 |
54,58 |
|
|
|
|
|
|
EBITDA |
8.754.439,00 |
9.297.582,00 |
11.623.993,00 |
28,77 |
|
|
|
|
|
|
EBIT |
5.462.477,00 |
7.260.405,00 |
9.446.526,00 |
23,38 |
|
|
|
|
|
|
NET RESULT |
3.843.623,00 |
4.844.620,00 |
614.675,00 |
1,52 |
|
|
|
|
|
Balance Sheets Items Analysis
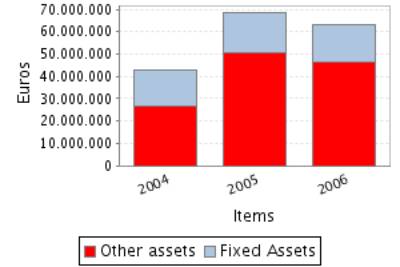

Balance Sheet Comments
Total assets of the company grew 58,66% between 2004 and 2005.
This growth has been inferior in the case of the fixed assets that
increased just in 8,54%.
This growth has been mainly financed with a debt increase of 309,39%.
Nevertheless the net worth increased 8,85%.
Total assets of the company decreased in 7,25% between 2005 and 2006.
This decrease in the amount total assets, has been reflected in a
reduction of the fixed assets of 2,37%.
Assets reduction contrasts with net worth growth of 2,87%. Therefore,
the company’s indebtedness has reduced in 20,78%.
Profit and Loss Account Analysis


Profit and Loss
Account Comments
The company’s sales figure grew 8,56% between 2004 and 2005.
The company’s EBIT grew 32,91% between 2004 and 2005.
This evolution implies an increase in the company’s operating
profitability.
The result of these variations is a decrease of the company’s Economic
Profitability of 16,23% in the analysed period, being this profitability of 10,61%
in the year 2005.
The company’s Net Result grew 26,04% between 2004 and 2005.
This evolution, compared to the EBIT’s performance, implies that the
financial and extraordinary activities have had a negative effect in the
company’s Financial Profitability.
The result of these variations is an increase of the company’s Economic
Profitability of 15,79% in the analysed period, being equal to 12,37% in the
year 2005.
The company’s sales figure grew 12,76% between 2005 and 2006.
The company’s EBIT grew 30,11% between 2005 and 2006.
This evolution implies an increase in the company’s operating
profitability.
The result of these variations is an increase of the company’s Economic
Profitability of 40,28% in the analysed period, being this profitability of
14,89% in the year 2006.
The company’s Net Result decreased in 87,31% between 2005 and 2006.
This evolution, compared to the EBIT’s performance, implies that the
financial and extraordinary activities have had a negative effect in the
company’s Financial Profitability.
The result of these variations is a reduction of the company’s
profitability of 87,67% in the analysed period, being equal to 1,53% in the
year 2006.
ANNUAL FINANCIAL REPORT
ADDITIONAL DATA
Source: annual financial report 2006
Results Distribution
Figures given in €
|
DISTRIBUTION
BASE |
DISTRIBUTION TO |
||
|
Profit and Loss |
614.675,00 |
Retained earnings |
0,00 |
|
Carry Over |
0,00 |
Voluntary Reserve |
614.675,00 |
|
Voluntary reserves |
0,00 |
Prior years losses |
0,00 |
|
Reserves |
0,00 |
Carry Over |
0,00 |
|
Other concepts |
0,00 |
Other funds |
0,00 |
|
Total of Amounts to be distributed |
614.675,00 |
Dividends |
0,00 |
|
|
|
Other Applications |
0,00 |
Auditing
Auditors’ opinion: FAVOURABLE
Auditor: KPMG AUDITORES S.L.
COMPARATIVE SECTOR ANALYSIS
Values table
Figures expressed in %
|
|
COMPANY (2006) |
SECTOR |
DIFFERENCE |
DIFFERENCE RELATIVE |
|
|
|
|
|
|
BALANCE SHEET ANALYSIS: % on the total
assets |
|
|
|
|
|
|
|
|
|
|
OWN FUNDS |
63,48 |
47,57 |
15,90 |
33,43 |
|
|
|
|
|
|
DEBT |
36,52 |
52,43 |
-15,90 |
-30,34 |
|
|
|
|
|
|
FIXED ASSETS |
27,05 |
37,96 |
-10,91 |
-28,74 |
|
|
|
|
|
|
|
|
|
|
|
|
|
|
|
|
|
|
COMPANY (2006) |
SECTOR |
DIFFERENCE |
DIFFERENCE RELATIVE |
|
|
|
|
|
|
PROFIT AND LOSS ACCOUNT ANALYSIS: % on the total
operating income |
|
|
|
|
|
|
|
|
|
|
SALES |
99,87 |
95,94 |
3,92 |
4,09 |
|
|
|
|
|
|
ADDED VALUE |
54,51 |
27,23 |
27,28 |
100,16 |
|
|
|
|
|
|
EBIT |
23,35 |
8,60 |
14,75 |
171,52 |
|
|
|
|
|
|
NET RESULT |
1,52 |
7,84 |
-6,32 |
-80,61 |
|
|
|
|
|
Sector Composition
Compared sector (NACE): 244
Number of companies: 64
Size (Sales Figure) : > 40.000.000,00
Euros
Comments on the sectorial
comparative
Compared to its sector the assets of the companies show an inferior
proportion of fixed assets. Specifically the difference with the sector average
is -10,91% , which means a relative difference of -28,74% .
In liabilities composition the company appeals on a wider scale to self
financing, being the proportion of net worth of 15,90% superior, which means a
relative difference of 33,43% . As a consequence, external financing sources
are less used by the company in 15,90% less than the sector, which means a
difference of 30,34% .
The proportion that the sales mean to the company’s total ordinary
income is 99,87%, 3,92% higher than in the sector, which means a relative
difference of 4,09% .
The company’s EBIT was positive and was 23,35% with regard to the total
ordinary income, 14,75% higher than in the sector, which means a relative
difference of 171,52% .
The company’s capacity to generate operating income is higher than the
one of the sector as its ratio EBIT/Sales is higher (ES Company versus ES
Sector).
The company’s net result was positive and equal to 1,52% with regard to
the total ordinary income, 6,32% less than the sector, which means a relative
difference of 80,61% .
The financial and extraordinary results and the tax impact have had a
negative impact on the Net result in the company with a worse behaviour than in
the sector; as a consequence, the company shows a worse Net Result/EBIT ratio
(REBEmpresa vs. REBSector).
ADDRESSES
Current Legal Seat Address:
STREET DE LA GRANJA (P I ALCOBENDAS), 49
28108 ALCOBENDAS MADRID
Previous Seat Address:
AVENIDA INDUSTRIA (P I ALCOBENDAS), 30
28108
ALCOBENDAS MADRID
Characteristics of
the current address
Type of premises: office, factory,
warehouse
Property: owned; with no official confirmation
Local Situation: secondary
CORPORATE STRUCTURE
ADMINISTRATIVE LINKS
Main Board members,
Directors and Auditor ![]()
|
POSITION |
SURNAMES AND
NAME |
APPOINTMENT DATE |
|
|
PRESIDENT |
MARTINEZ SIERRA CARLOS |
09/01/2007 |
|
|
ADMINISTRATOR |
HUGILL HERBERT L |
29/09/2006 |
|
|
ADMINISTRATOR |
KAWAHARA HIROSHI |
02/10/2006 |
|
|
ADMINISTRATOR |
TOMIOKA TAKAOMI |
09/01/2007 |
|
|
ADMINISTRATOR |
HARRIS RYAN |
09/01/2007 |
|
|
SECRETARY |
CASANUEVA NARDIZ RAFAEL |
07/06/2005 |
|
|
AUDITOR |
APPOINTMENT DATE |
||
|
KPMG AUDITORES SL |
23/08/2006 |
||
Functional Managers
|
POSITION |
SURNAMES AND
NAME |
|
General Manager |
MARTINEZ SIERRA CARLOS |
|
Financial Manager |
MARTINEZ SIERRA CARLOS |
|
Human Resources Manager |
BERMEJO JUAN FRANCISCO |
|
Purchases Manager |
CASTELLANOS ANGELA |
|
IT Manager |
MARTINEZ JOSE ANGEL |
FINANCIAL LINKS
|
|
BUSINESS NAME |
CIF / COUNTRY |
% |
SOURCE |
DATA INF. |
|
|
SHIONOGI EUROPE B.V. |
PAÍSES BAJOS |
76,92 |
OWN SOURCES |
27/11/2007 |
|
|
SHIONOGI & CO LTD |
JAPÓN |
23,08 |
OWN SOURCES |
27/11/2007 |
You can obtain business information of a foreign company at the
pageD&B International
CREDIT INFORMATION
Constitution Date: 10/09/1992
Foundation Date: 01/01/1992
Founder / Origin: LA TITULAR ES LA
FUNDADORA INICIAL DEL NEGOCIO
Business activity 
Activity: Mfg. of basic pharmaceutical products
NACE Code: 2441
NACE Activity: Manufacture of
basic pharmaceutical products
Business: FABRICACION Y COMERCIALIZACION DE CAPSULAS,
PRINCIPALMENTE PARA USO FARMACEUTICO, O MAQUINARIA DE LLENADO DE CAPSULAS, ASI
COMO DE CUALQUIER OTRA MAQUINA O EQUIPOS RELACIONADOS CON AQUELLAS.
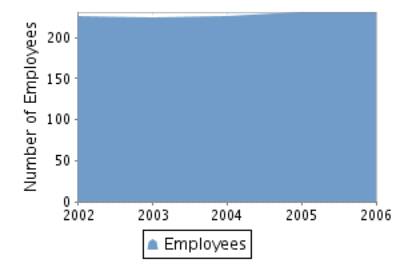
Employees 
Number of total employees: 240 (2007)
Number of fixed employees: 100,00%
Number of temporary employees: 0,00%
Employees evolution
COMMERCIAL OPERATIONS 
SUPPLIERS
|
BUSINESS NAME |
INTERNATIONAL |
|
SHIONOGI
QUALICAPS CO |
NO |
|
QUALICAPS INC |
YES |
|
SHIONOGI
QUALICAPS INC |
NO |
|
QUALICAPS CO
LIMITED |
YES |
4 proveedores
SALES
Collection (estimated):
On a credit basis: 100%
Export Percentage: 80%
Exports to: Comunidad Europea
National Distribution: 20%
CLIENTS
|
BUSINESS NAME |
INTERNATIONAL |
|
SHIONOGI
QUALICAPS INC |
YES |
|
QUALICAPS INC |
YES |
|
SHIONOGI
QUALICAPS CO |
YES |
|
QUALICAPS CO
LIMITED |
YES |
4 clientes
Banks 
|
ENTITY |
BRANCH |
ADDRESS |
TOWN OR CITY |
PROVINCE |
|
SUMITOMO MITSUI BANKING CORPORATION |
|
|
JAPON |
|
|
BANCO BILBAO VIZCAYA ARGENTARIA, S.A. |
|
|
ALCOBENDAS |
|
2 bank entities registered
Brands, Signs and Commercial Names 
FORMER NAMES:
•
SHIONOGI QUALICAPS SA
•
SHIONOGUI QUALICAPS S A
LEGAL STRUCTURE
Constitution Data
Register Date: 10/09/1992
Register town: Madrid
Announcement number: 353655
Current structure data 
Current Legal Form: JOINT STOCK
COMPANY
Current Capital:
15.626.000,00 €
Legal Aspects
Obligation to fill in Financial
Statements: YES
Chamber census: YES (2006)
Listed on a Stock Exchange: NO
B.O.R.M.E.(Official Companies
Registry Gazette) 
Registered Proceedings
|
PROCEEDINGS |
DATE |
NOTICE NUM. |
TRADE REG. |
|
Declaration of individual ownership |
07/02/2007 |
72074 |
Madrid |
|
Re-elections |
09/01/2007 |
14185 |
Madrid |
|
Resignations |
02/10/2006 |
475836 |
Madrid |
Other Proceedings published
|
PROCEEDINGS |
DATE |
NOTICE NUM. |
TRADE REG. |
|
Registration of accounts (2006) Individual |
29/11/2007 |
1084461 |
Madrid |
|
Registration of accounts (2005) Individual |
20/10/2006 |
795445 |
Madrid |
Press articles

06/12/2005 GACETA NEG (INFORMATION ON LEGAL ANNOUNCE)
LA JUNTA GENERAL EXTRAORDINARIA DE SHIONOGI QUALICAPS, S.A., CELEBRADA
EL 30/11/05, ACORDO MODIFICAR LA DENOMINACION SOCIAL POR LA DE QUALICAPS
EUROPE, S.A.
26/09/2005 EXPANSIÓN (SUBSIDIARIES INFORMATION)
EL FONDO CARLYLE HA CERRADO UN ACUERDO PARA ADQUIRIR LA FARMACEUTICA
JAPONESA SHIONOGI Y CUATRO DE SUS FILIALES. UNA DE ESTAS 4 DIVISIONES, SHIONOGI
QUALICAPS, ESTA UBICADA EN ALCOBENDAS (MADRID) Y ES LA RESPONSABLE DE ATENDER
TODO EL MERCADO EUROPEO.
FINANCIAL INFORMATION
The information on the last account contained in this report is
extracted from the Mercantile Register file of the legal address of the Company
and dated 23/11/2007.
BALANCE SHEET
Assets
Figures given in €
|
|
31/12/2004 (12) |
31/12/2005 (12) |
31/12/2006 (12) |
|
A) DUE FROM SHAREHOLDERS FOR UNCALLED CAPITAL |
|
|
|
|
B) FIXED ASSETS |
16.198.658,00 |
17.582.225,00 |
17.165.649,00 |
|
I. Incorporation costs |
|
|
|
|
II. Intangible fixed assets |
128.119,00 |
105.058,00 |
38.953,00 |
|
R & D expenses |
|
|
|
|
Concessions, patents, licences , trademarks |
|
|
|
|
Goodwill |
|
|
|
|
Acquired rights from finance leases |
|
|
|
|
Software |
479.504,00 |
511.142,00 |
534.177,00 |
|
Leasing |
92.782,00 |
92.782,00 |
|
|
Cash advance |
|
|
|
|
Provisions |
|
|
|
|
Depreciation |
-444.167,00 |
-498.866,00 |
-495.224,00 |
|
III. Tangible fixed assets |
16.028.967,00 |
17.439.224,00 |
17.089.693,00 |
|
Property, plant and equipment |
12.304.785,00 |
14.056.520,00 |
14.089.299,00 |
|
Machinery, equipment and other |
15.976.240,00 |
17.178.095,00 |
18.110.014,00 |
|
Other property plant and equipment |
10.656.813,00 |
10.885.482,00 |
11.026.568,00 |
|
Prepaid expenses on fixed assets |
1.119.658,00 |
340.395,00 |
719.395,00 |
|
Other assets |
569.510,00 |
611.064,00 |
758.858,00 |
|
Provisions |
|
|
|
|
Depreciation |
-24.598.039,00 |
-25.632.332,00 |
-27.614.441,00 |
|
IV. Financial fixed assets |
41.572,00 |
37.943,00 |
37.003,00 |
|
Shares in affiliated companies |
|
|
|
|
Receivables in affiliated companies |
|
|
|
|
Shares in associated companies |
|
|
|
|
Loans to associated companies |
|
|
|
|
Securities |
|
|
|
|
Other loans |
845,00 |
845,00 |
845,00 |
|
Long term deposits and guarantees |
40.727,00 |
37.098,00 |
36.158,00 |
|
Provisions |
|
|
|
|
Taxes receivable |
|
|
|
|
V.Owners equity |
|
|
|
|
VI.Long term trade liabilities |
|
|
|
|
C) DEFERRED EXPENSES |
|
|
|
|
D) CURRENT ASSETS |
26.923.578,00 |
50.836.799,00 |
46.295.132,00 |
|
I. Shareholders by required outlays |
|
|
|
|
II. Stocks |
5.707.437,00 |
5.271.849,00 |
5.729.279,00 |
|
Goods available for sale |
|
|
|
|
Raw material inventory |
2.076.988,00 |
2.363.775,00 |
1.579.140,00 |
|
Work in Progress |
14.835,00 |
127.861,00 |
65.339,00 |
|
Finished goods |
3.760.674,00 |
2.944.652,00 |
4.211.051,00 |
|
Subproducts and recycled materials |
|
|
|
|
Cash advance |
|
|
|
|
Provisions |
-145.060,00 |
-164.439,00 |
-126.251,00 |
|
III. Debtors |
5.439.488,00 |
6.957.868,00 |
8.084.249,00 |
|
Clients |
5.064.676,00 |
6.617.085,00 |
7.531.723,00 |
|
Amounts owned by affiliated companies |
269.261,00 |
323.921,00 |
495.126,00 |
|
Amounts owned by associated companies |
|
|
|
|
Other debts |
68.162,00 |
49.736,00 |
55.569,00 |
|
Staff Expenses |
22.075,00 |
8.177,00 |
7.698,00 |
|
Government |
253.395,00 |
121.706,00 |
245.750,00 |
|
Provisions |
-238.081,00 |
-162.757,00 |
-251.617,00 |
|
IV. Temporary financial investment |
15.460.730,00 |
28.839.399,00 |
27.264.147,00 |
|
Shares in affiliated companies |
|
|
|
|
Receivables in affiliated companies |
|
25.679.005,00 |
24.107.309,00 |
|
Shares in associated companies |
|
|
|
|
Loans to associated companies |
|
|
|
|
Short term investment |
15.460.730,00 |
3.160.394,00 |
3.156.838,00 |
|
Other loans |
|
|
|
|
Short Term Deposit and guarantees |
|
|
|
|
Provisions |
|
|
|
|
V. Short-term own shares |
|
|
|
|
VI. Treasury |
261.084,00 |
9.703.278,00 |
5.150.336,00 |
|
VII. Periodification adjustments |
54.839,00 |
64.405,00 |
67.121,00 |
|
ASSETS (A + B + C + D) |
43.122.236,00 |
68.419.024,00 |
63.460.781,00 |
Assets composition


Liabilities
Figures given in €
|
|
31/12/2004 (12) |
31/12/2005 (12) |
31/12/2006 (12) |
|
A) SHAREHOLDERS EQUITY |
35.953.341,00 |
38.875.963,00 |
39.490.638,00 |
|
I. Share capital |
15.626.000,00 |
15.626.000,00 |
15.626.000,00 |
|
II. Issue bonus |
|
|
|
|
III.Revaluation reserve |
1.303.475,00 |
1.303.475,00 |
1.303.475,00 |
|
IV.Reserves |
15.180.243,00 |
17.101.868,00 |
21.946.488,00 |
|
Retained earnings |
2.576.623,00 |
2.960.985,00 |
3.125.200,00 |
|
Sinking fund from owner equity |
|
|
|
|
Reserve for the parent company capital |
|
|
|
|
Statutory reserve |
|
|
|
|
Other funds |
12.603.305,00 |
14.140.568,00 |
18.820.973,00 |
|
Capital adjustments in Euros |
315,00 |
315,00 |
315,00 |
|
V.Results from previous years |
|
|
|
|
Carry Over |
|
|
|
|
Prior years losses |
|
|
|
|
Loans from partners for losses compensation |
|
|
|
|
VI.Profit and Losses |
3.843.623,00 |
4.844.620,00 |
614.675,00 |
|
VII.Dividend paid during the year |
|
|
|
|
VIII.Own shares for capital reduction |
|
|
|
|
B) DEFERRED INCOME |
21.854,00 |
283.467,00 |
791.692,00 |
|
Capital grants |
|
|
|
|
Positive change difference |
21.854,00 |
283.467,00 |
791.692,00 |
|
Other deferred income |
|
|
|
|
Fiscal deferred income |
|
|
|
|
C) PROVISIONS FOR LIABILITIES AND EXPENSES |
|
|
|
|
Provision for pensions plans |
|
|
|
|
Provision for taxes |
|
|
|
|
Other provisions |
|
|
|
|
Reversion fund |
|
|
|
|
D) LONG TERM LIABILITIES |
146.161,00 |
|
|
|
I.Negotiable bonds and other negotiable values |
|
|
|
|
Non convertible securities |
|
|
|
|
Convertible securities |
|
|
|
|
Other convertible debentures |
|
|
|
|
II.Debt with bank entities |
23.958,00 |
|
|
|
Long term bank loans |
23.958,00 |
|
|
|
Leasing |
|
|
|
|
III.Debts with associated and affiliated
companies |
|
|
|
|
With affiliated companies |
|
|
|
|
Associated companies |
|
|
|
|
IV. Other creditors |
122.203,00 |
|
|
|
Bills payable |
|
|
|
|
Other debts |
|
|
|
|
Long term deposit and guaranties |
|
|
|
|
Taxes receivable |
122.203,00 |
|
|
|
V. Deferred debts on shares |
|
|
|
|
From affiliated companies |
|
|
|
|
From associated companies |
|
|
|
|
Other companies |
|
|
|
|
VI. Long term debt with creditor |
|
|
|
|
E) SHORT TERM LIABILITIES |
7.000.880,00 |
29.259.594,00 |
23.178.451,00 |
|
I.Negotiable bonds and other negotiable values |
|
|
|
|
Non convertible securities |
|
|
|
|
Convertible securities |
|
|
|
|
Other convertible debentures |
|
|
|
|
Interests from bonds |
|
|
|
|
II.Debt with bank entities |
45.881,00 |
23.958,00 |
|
|
Loans and other debts |
45.881,00 |
23.958,00 |
|
|
Debt interest |
|
|
|
|
Leasing |
|
|
|
|
III. Short term debts with associated and
affiliated companies |
935.547,00 |
22.778.991,00 |
15.824.639,00 |
|
With affiliated companies |
935.547,00 |
22.778.991,00 |
15.824.639,00 |
|
Associated companies |
|
|
|
|
IV. Commercial creditors |
3.800.158,00 |
4.086.041,00 |
5.735.380,00 |
|
Accounts payable |
|
|
|
|
Expenses |
3.800.158,00 |
4.086.041,00 |
5.735.380,00 |
|
Bills payable |
|
|
|
|
V. Other non-commercial debt |
2.219.294,00 |
2.370.604,00 |
1.618.432,00 |
|
Government |
1.418.829,00 |
1.529.449,00 |
654.635,00 |
|
Bills payable |
|
|
|
|
Other debts |
57.188,00 |
50.040,00 |
69.880,00 |
|
Accounts receivable |
743.277,00 |
791.115,00 |
893.917,00 |
|
Short term deposits and guarantees |
|
|
|
|
VI. Provisions for current assets |
|
|
|
|
VII. Periodification adjustments |
|
|
|
|
F) SHORT TERM PROVISIONS FOR LIABILITIES AND
EXPENSES |
|
|
|
|
LIABILITIES (A + B + C + D + E + F) |
43.122.236,00 |
68.419.024,00 |
63.460.781,00 |
Liabilities
Composition


PROFIT AND LOSS ACCOUNT
Itams of the Profit
and Loss Account
Figures given in €
|
|
31/12/2004 (12) |
31/12/2005 (12) |
31/12/2006 (12) |
|
A) EXPENSES (A.1 a A.16) |
30.224.842,00 |
31.541.746,00 |
42.438.542,00 |
|
A.1.Reduction in stocks of finished goods and
work in progress |
|
702.996,00 |
|
|
A.2.Supplies |
7.610.112,00 |
7.487.575,00 |
10.528.358,00 |
|
Material consumed |
|
|
|
|
Raw materials consumed |
7.610.112,00 |
7.487.575,00 |
10.528.358,00 |
|
Other expenses |
|
|
|
|
A.3. Labour cost |
9.985.171,00 |
10.838.507,00 |
10.426.685,00 |
|
Wages |
7.545.167,00 |
8.116.107,00 |
7.959.857,00 |
|
Social security expenses |
2.440.004,00 |
2.722.400,00 |
2.466.828,00 |
|
A.4. Assets depreciation |
3.010.766,00 |
2.021.079,00 |
2.126.795,00 |
|
A.5.Variance in the traffic provisions |
281.196,00 |
16.098,00 |
50.672,00 |
|
Variance in provision for inventory |
109.852,00 |
19.378,00 |
-38.188,00 |
|
Variance in provision for bad debts |
171.344,00 |
-3.280,00 |
88.860,00 |
|
Variance in provision for other current assets |
|
|
|
|
A.6. Other operating costs |
7.342.668,00 |
7.558.666,00 |
9.105.113,00 |
|
External costs |
7.220.879,00 |
7.407.705,00 |
8.977.052,00 |
|
Taxes |
121.789,00 |
150.961,00 |
128.061,00 |
|
Other day to day expenses |
|
|
|
|
Allowance to reversion fund |
|
|
|
|
A.I.OPERATING RESULT
(B.1+B.2+B.3+B.4-A.1-A.2-A.3-A.4-A.5-A.6) |
5.462.477,00 |
7.260.405,00 |
9.446.526,00 |
|
A.7.Financial expenses and similar |
24.924,00 |
87.312,00 |
359.541,00 |
|
Debts with related companies |
24.924,00 |
62.813,00 |
324.374,00 |
|
Debts with associated companies |
|
|
|
|
By debts with third parties and similar expenses |
|
24.499,00 |
35.167,00 |
|
Losses from financial investments |
|
|
|
|
A.8. Variation in financial investment provision |
|
|
|
|
A.9.Negative exchange difference |
84.453,00 |
332.716,00 |
1.670.561,00 |
|
A.II.POSITIVE FINANCIAL RESULTS
(B.5+B.6+B.7+B.8-A.7-A.8-A.9) |
201.564,00 |
71.606,00 |
|
|
A.III.PROFIT FROM ORDINARY ACTIVITIES
(A.I+A.II-B.I-B.II) |
5.664.041,00 |
7.332.011,00 |
8.762.494,00 |
|
A.10. Variation in provision in fixed assets |
|
|
|
|
A.11. Losses in fixed assets |
1.763,00 |
222,00 |
|
|
A.12. Losses from own shares and bonds |
|
|
|
|
A.13. Extraordinary charges |
6.513,00 |
45.160,00 |
5.817.828,00 |
|
A.14.Other exercises’ expenses and losses |
|
|
|
|
A.IV.POSITIVE EXTRAORDINARY RESULT
(B.9+B.10+B.11+B.12+B.13-A.10-A.11-A.12-A.13-A.14) |
56.858,00 |
|
|
|
A.V.PROFIT BEFORE TAXES (A.III+A.IV-B.III-B.IV) |
5.720.899,00 |
7.296.035,00 |
2.967.664,00 |
|
A.15.Corporate Taxes |
1.877.276,00 |
2.451.415,00 |
2.352.989,00 |
|
A.16. Other taxes |
|
|
|
|
A.VI.EXERCISE RESULT (PROFIT) (A.V-A.14-A.15) |
3.843.623,00 |
4.844.620,00 |
614.675,00 |
|
B) INCOMES (B.1 a B13) |
34.068.465,00 |
36.386.366,00 |
43.053.217,00 |
|
B.1. Turnover |
33.004.553,00 |
35.829.641,00 |
40.402.400,00 |
|
Sales |
33.004.553,00 |
35.829.641,00 |
40.402.400,00 |
|
Services provided |
|
|
|
|
Refunds and sale reminders |
|
|
|
|
B.2.Increase in inventory of finished goods and
works in progress |
638.025,00 |
|
1.228.717,00 |
|
B.3.Expenses capitalized |
|
|
|
|
B.4. Other operating income |
49.812,00 |
55.685,00 |
53.032,00 |
|
Other incomes |
49.812,00 |
55.685,00 |
53.032,00 |
|
Grants |
|
|
|
|
Excess in provision for liabilities and charges |
|
|
|
|
B.I.OPERATING LOSSES
(A.1+A.2+A.3+A.4+A.5+A.6-B.1-B.2-B.3-B.4) |
|
|
|
|
B.5.Incomes from share participations |
|
|
|
|
From affiliated companies |
|
|
|
|
From associated companies |
|
|
|
|
From other companies |
|
|
|
|
B.6.Income from other securities and credits to
fixed assets |
283.102,00 |
244.247,00 |
118.948,00 |
|
From affiliated companies |
|
|
118.948,00 |
|
From associated companies |
|
|
|
|
Other companies |
283.102,00 |
244.247,00 |
|
|
B.7.Other interests and similar |
4.647,00 |
125.951,00 |
597.078,00 |
|
From affiliated companies |
|
121.997,00 |
463.631,00 |
|
From associated companies |
|
|
|
|
Other Interests |
4.647,00 |
3.954,00 |
133.447,00 |
|
Profits from investments |
|
|
|
|
B.8. Positive change difference |
23.192,00 |
121.436,00 |
630.044,00 |
|
B.II. NEGATIVE FINANCIAL RESULTS
(A.7+A.8+A.9-B.5-B.6-B.7-B.8) |
|
|
684.032,00 |
|
B.III.LOSSES FROM ORDINARY ACTIVITIES
(B.I+B.II-A.I-A.II) |
|
|
|
|
B.9.B.9. Gains from disposal of fixed assets |
1.625,00 |
565,00 |
3.434,00 |
|
B.10.Gains from dealing in own shares |
|
|
|
|
B.11. Paid in surplus |
|
|
|
|
B.12. Extraordinary income |
28,00 |
26,00 |
6,00 |
|
B.13.Other year’s income and profits |
63.481,00 |
8.815,00 |
19.558,00 |
|
B.IV.NEGATIVE EXTRAORDINARY LOSSES
(A.10+A.11+A.12+A.13+A.14-B.9-B.10-B.11-B.12-B.13) |
|
35.976,00 |
5.794.830,00 |
|
B.V.LOSS BEFORE TAXES (B.III+B.IV-A.III-A.IV) |
|
|
|
|
B.VI.EXERCISE RESULTS (LOSS) (B.V+A.14+A.15) |
|
|
|
Composition of the
Profit and Loss Account


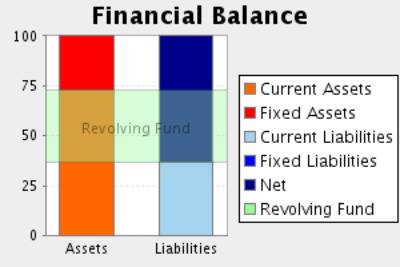
FINANCIAL BALANCE
Here the Main Capital Amounts of the company and the Revolving Fund
Evolution are analysed.
Financial Balance
Table
Figures given in €
|
|
31/12/2004 (12) |
% |
31/12/2005 (12) |
% |
31/12/2006 (12) |
% |
|
A) DUE FROM SHAREHOLDERS FOR UNCALLED CAPITAL |
|
|
|
|
|
|
|
B) FIXED ASSETS |
16.198.658,00 |
37,56 |
17.582.225,00 |
25,70 |
17.165.649,00 |
27,05 |
|
C) DEFERRED EXPENSES |
|
|
|
|
|
|
|
D) CURRENT ASSETS |
26.923.578,00 |
62,44 |
50.836.799,00 |
74,30 |
46.295.132,00 |
72,95 |
|
ASSETS (A + B + C + D) |
43.122.236,00 |
|
68.419.024,00 |
|
63.460.781,00 |
|
|
|
||||||
|
A) SHAREHOLDERS EQUITY |
35.953.341,00 |
83,38 |
38.875.963,00 |
56,82 |
39.490.638,00 |
62,23 |
|
B) DEFERRED INCOME |
21.854,00 |
0,05 |
283.467,00 |
0,41 |
791.692,00 |
1,25 |
|
C) PROVISIONS FOR LIABILITIES AND EXPENSES |
|
|
|
|
|
|
|
D) LONG TERM LIABILITIES |
146.161,00 |
0,34 |
|
|
|
|
|
E) SHORT TERM LIABILITIES |
7.000.880,00 |
16,23 |
29.259.594,00 |
42,77 |
23.178.451,00 |
36,52 |
|
F) SHORT TERM PROVISIONS FOR LIABILITIES AND EXPENSES |
|
|
|
|
|
|
|
LIABILITIES (A + B + C + D + E + F) |
43.122.236,00 |
|
68.419.024,00 |
|
63.460.781,00 |
|
Financial Balance
Composition

Comments on Financial
Balance
In the 2004, the assets of the company were formed in 37,56% of Fixed
Assets and in 62,44% of Current Assets.This assets were financed in 83,43% with
own capitals, and in 0,34% with long term debt and in 16,23% with current
liabilities.
The result of this financial structure is a positive turnover fund of
19.922.698,00 Euros, which is equivalent to 46,20% proportion of the
company’s total assets.
In the 2005, the assets of the company were formed in 25,70% of Fixed
Assets and in 74,30% of Current Assets.This assets were financed in 57,23% with
own capitals and in 42,77% with current liabilities.
The result of this financial structure is a positive turnover fund of
21.577.205,00 Euros, which is equivalent to 31,54% proportion of the
company’s total assets.
This measure has increased with respect to the previous exercise in
8,30% having, however, diminished its proportion with respect to the total
assets of the company.
In the 2006, the assets of the company were formed in 27,05% of Fixed
Assets and in 72,95% of Current Assets.This assets were financed in 63,48% with
own capitals and in 36,52% with current liabilities.
The result of this financial structure is a positive turnover fund of
23.116.681,00 Euros, which is equivalent to 36,43% proportion of the
company’s total assets.
This measure has increased with respect to the previous exercise in
7,13% having also increased its proportion with respect to the total assets of
the company.
RATIOS
Main Ratios
|
|
31/12/2004 (12) |
31/12/2005 (12) |
31/12/2006 (12) |
|
STRUCTURAL RATIOS |
|
|
|
|
Management fund |
19.922.698,00 |
21.577.205,00 |
23.116.681,00 |
|
Management Fund Requirement |
4.246.765,00 |
-16.941.514,00 |
-9.297.802,00 |
|
Indebtedness (%) |
16,57 |
42,76 |
36,52 |
|
External Funds on Net Worth |
0,20 |
0,75 |
0,58 |
|
GENERAL ACTIVITY RATIO |
|
|
|
|
Turnover Increase (%) |
9,58 |
8,56 |
12,76 |
|
Added value growth (%) |
21,70 |
7,45 |
9,51 |
|
Cash Flow |
7.135.585,00 |
6.881.797,00 |
2.792.142,00 |
|
Labour Productivity |
1,88 |
1,86 |
2,12 |
|
Assets turnover |
0,76 |
0,52 |
0,64 |
|
Breakdown Point |
26.131.706,31 |
26.477.696,28 |
28.189.227,93 |
|
Security Margin of the Breakdown Point (%) |
20,94 |
26,22 |
30,32 |
|
ACTIVITY RATIOS |
|
|
|
|
Average Payment Period |
196 |
180 |
222 |
|
Average Collection Period |
59 |
70 |
72 |
|
Inventory Turnover Period |
62 |
53 |
51 |
|
SOLVENCY RATIOS |
|
|
|
|
Payback Capacity |
1,00 |
0,24 |
0,12 |
|
Assets Guarantee |
6,03 |
2,34 |
2,74 |
|
Short Term Debts Proportion (%) |
97,96 |
100,00 |
100,00 |
|
Interest Coverage |
245,61 |
73,08 |
0,54 |
|
LIQUIDITY RATIOS |
|
|
|
|
Current Ratio |
3,85 |
1,74 |
2,00 |
|
Immediate liquidity |
2,25 |
1,32 |
1,40 |
|
Treasury |
15.675.933,00 |
38.518.719,00 |
32.414.483,00 |
|
Sales on Current Assets |
441 |
254 |
314 |
Results Analysis
Ratios
|
|
31/12/2004 (12) |
31/12/2005 (12) |
31/12/2006 (12) |
|
Economic profitability (%) |
12,67 |
10,61 |
14,89 |
|
Operating Profitability (%) |
16,55 |
20,26 |
23,38 |
|
Equity gearing |
1,24 |
1,76 |
1,46 |
|
Financial profitability (%) |
10,68 |
12,37 |
1,53 |
|
General Profitability (%) |
11,65 |
13,52 |
1,52 |
Comments on the
Results Analysis Ratios
The economic profitability in the year2005 achieved a 10,61% positive
level, due to a 20,26% economic margin and to an assets turnover of0,52%.
The economic profitability in the year has reduced from 12,67% up to
10,61% of2005, even if it remains positive. The decrease in assets turnover
from 0,76% to the current level of 0,52has provoked this drop, which has not
been compensated by the parallel increase of the economic margin from 20,26% to
16,55%.
Financial profitability on 2005 achieved a 12,37%.
The company’s financial structure has instigated its economic
profitability with an indebtedness level of 1,76.
The general profitability on 2005 achieved a 13,52%.
The economic profitability in the year2006 achieved a 14,89% positive
level, due to a 23,38% economic margin and to an assets turnover of0,64%.
The economic profitability in the year has increased from 10,61% up to
14,89%. This growth is due to the economic margin increase, from 20,26% to the
current 23,38Y%, and to the assets turnover index, which in the last period has
achieved 0,64, compared to 0,52 del 2005.
Financial profitability on 2006 achieved a 1,53%.
The company’s financial structure has instigated its economic
profitability with an indebtedness level of 1,46.
The general profitability on 2006 achieved a 1,52%.
SECTORIAL ANÁLYSIS
Large Capital Amounts
and Financial Balance
Figures given in %
|
|
COMPANY (2006) |
SECTOR |
DIFFERENCE |
DIFFERENCE RELATIVE |
|
|
|
|
|
|
ASSETS |
|
|
|
|
|
|
|
|
|
|
A) DUE FROM SHAREHOLDERS FOR UNCALLED CAPITAL |
|
0,00 |
|
|
|
|
|
|
|
|
B) FIXED ASSETS |
27,05 |
37,96 |
-10,91 |
-28,74 |
|
|
|
|
|
|
C) DEFERRED EXPENSES |
|
0,11 |
|
|
|
|
|
|
|
|
D) CURRENT ASSETS |
72,95 |
61,93 |
11,02 |
17,79 |
|
|
|
|
|
|
ASSETS (A + B + C + D) |
100 |
100 |
|
|
|
|
|
|
|
|
|
|
|
|
|
|
|
|
|
|
|
|
COMPANY (2006) |
SECTOR |
DIFFERENCE |
DIFFERENCE RELATIVE |
|
|
|
|
|
|
LIABILITIES |
|
|
|
|
|
|
|
|
|
|
A) SHAREHOLDERS EQUITY |
62,23 |
47,09 |
15,14 |
32,15 |
|
|
|
|
|
|
B) DEFERRED INCOME |
1,25 |
0,48 |
0,77 |
160,42 |
|
|
|
|
|
|
C) PROVISIONS FOR LIABILITIES AND EXPENSES |
|
1,05 |
|
|
|
|
|
|
|
|
D) LONG TERM LIABILITIES |
|
11,64 |
|
|
|
|
|
|
|
|
E) SHORT TERM LIABILITIES |
36,52 |
39,48 |
-2,96 |
-7,49 |
|
|
|
|
|
|
F) SHORT TERM PROVISIONS FOR LIABILITIES AND EXPENSES |
|
0,27 |
|
|
|
|
|
|
|
|
LIABILITIES (A + B + C + D + E + F) |
100 |
100 |
|
|
|
|
|
|
|
Financial Balance Composition


Comments to the
Sectorial Analysis
In the 2006, the assets of the company were formed in 27,05% of fixed
assets and in 72,95Current Assets % In the sector, the proportion of fixed
assets was of 38,07%, 28,94% superior, and the proportion of current assets was
of 61,93%, 17,79% inferior.
The assets were financed in the company in 63,48% with own capitals and
in 36,52% with current liabilities In the sector, the self financing
represented 47,57%, 33,44% inferior. On the other hand the long term debts
represented in the sector an average of 39,74% financing, with a relative difference
of 8,11% favourable to the sector
The result of this company’s financial structure is a turnover fund that
represents 36,43% of the total assets; in the sector, this same proportion is
22,19%, therefore, we can say that the company’s turnover fund is 64,17% higher
than the one in of the sector.
Analytical Account of Results
Figures given in %
|
|
COMPANY (2006) |
SECTOR |
DIFFERENCE |
DIFFERENCE RELATIVE |
|
Turnover |
99,87 |
95,94 |
3,93 |
4,09 |
|
Other operating income |
0,13 |
4,06 |
-3,93 |
-96,79 |
|
Production Value |
100,00 |
100,00 |
0,00 |
0,00 |
|
Operating expenses |
22,99 |
52,01 |
-29,02 |
-55,80 |
|
Other operation expenses |
22,51 |
20,76 |
1,75 |
8,43 |
|
Added value |
54,51 |
27,23 |
27,28 |
100,18 |
|
Labour cost |
25,77 |
15,15 |
10,62 |
70,12 |
|
Gross Economic Result |
28,73 |
12,08 |
16,65 |
137,77 |
|
Assets depreciation |
5,26 |
3,19 |
2,07 |
64,84 |
|
Variation in provision for current assets and bad debt losses |
0,13 |
0,29 |
-0,16 |
-55,48 |
|
Net Economic Result |
23,35 |
8,60 |
14,75 |
171,51 |
|
Financial income |
3,33 |
2,53 |
0,80 |
31,72 |
|
Financial Charges |
5,02 |
1,19 |
3,83 |
322,91 |
|
Variation in financial investment provision |
|
0,03 |
|
|
|
Ordinary Activities Result |
21,66 |
9,91 |
11,75 |
118,48 |
|
Extraordinary income |
0,06 |
0,73 |
-0,67 |
-91,74 |
|
Extraordinary charges |
14,38 |
0,58 |
13,80 |
2.370,79 |
|
Variation in provision in fixed assets |
|
0,42 |
|
|
|
Results before Taxes |
7,34 |
9,64 |
-2,30 |
-23,83 |
|
Corporate taxes |
5,82 |
1,80 |
4,02 |
223,15 |
|
Net Result |
1,52 |
7,84 |
-6,31 |
-80,60 |
|
Assets depreciation |
5,26 |
3,19 |
2,07 |
64,84 |
|
Change of Provisions |
0,13 |
0,74 |
-0,61 |
-82,41 |
|
Net Self-Financing |
6,90 |
11,76 |
-4,86 |
-41,35 |
Main Ratios
|
|
COMPANY (2006) |
PTILE25 |
PTILE50 |
PTILE75 |
|
STRUCTURAL RATIOS |
|
|
|
|
|
Management fund |
23.116.681,00 |
8.907,58 |
17.200,05 |
29.726,00 |
|
Management Fund Requirement |
-9.297.802,00 |
-673,34 |
9.470,18 |
18.712,30 |
|
Indebtedness (%) |
36,52 |
30,73 |
49,00 |
62,86 |
|
External Funds on Net Worth |
0,58 |
0,44 |
0,96 |
1,69 |
|
GENERAL ACTIVITY RATIO |
|
|
|
|
|
Turnover Increase (%) |
12,76 |
1,55 |
6,78 |
14,63 |
|
Added value growth (%) |
9,51 |
-5,08 |
4,35 |
14,96 |
|
Cash Flow |
2.792.142,00 |
5.293,75 |
10.466,91 |
19.313,94 |
|
Labour Productivity |
2,12 |
1,43 |
1,74 |
2,13 |
|
Assets turnover |
0,64 |
0,87 |
1,10 |
1,47 |
|
Breakdown Point |
28.189.227,93 |
43.212.748,16 |
69.685.141,95 |
124.319.147,31 |
|
Security Margin of the Breakdown Point (%) |
30,32 |
7,90 |
16,00 |
23,69 |
|
ACTIVITY RATIOS |
|
|
|
|
|
Average Payment Period |
222 |
45 |
75 |
123 |
|
Average Collection Period |
72 |
80 |
98 |
146 |
|
Inventory Turnover Period |
51 |
37 |
56 |
74 |
|
SOLVENCY RATIOS |
|
|
|
|
|
Payback Capacity |
0,12 |
0,14 |
0,26 |
0,56 |
|
Assets Guarantee |
2,74 |
1,59 |
2,04 |
3,26 |
|
Short Term Debts Proportion (%) |
100,00 |
67,14 |
86,46 |
96,16 |
|
Interest Coverage |
0,54 |
5,17 |
14,80 |
45,78 |
|
LIQUIDITY RATIOS |
|
|
|
|
|
Current Ratio |
2,00 |
1,35 |
1,67 |
2,22 |
|
Immediate liquidity |
1,40 |
0,03 |
0,10 |
0,36 |
|
Treasury |
32.414.483,00 |
-533,80 |
1.313,66 |
7.951,56 |
|
Sales on Current Assets |
314 |
533 |
676 |
873 |
Results Analysis
Ratios
|
|
COMPANY (2006) |
PTILE25 |
PTILE50 |
PTILE75 |
|
Economic profitability (%) |
14,89 |
4,65 |
8,50 |
17,31 |
|
Operating Profitability (%) |
23,38 |
3,40 |
8,83 |
13,75 |
|
Equity gearing |
1,46 |
1,38 |
1,86 |
2,54 |
|
Financial profitability (%) |
1,53 |
7,17 |
15,19 |
24,98 |
|
General Profitability (%) |
1,52 |
2,35 |
6,28 |
11,76 |
RATING
EXPLANATIONS
|
RATING |
STATUS |
PROPOSED CREDIT LINE |
|
|
>86 |
Aaa |
Possesses an extremely sound financial base with the strongest
capability for timely payment of interest and principal sums |
Unlimited |
|
71-85 |
Aa |
Possesses adequate working capital. No caution needed for credit transaction.
It has above average (strong) capability for payment of interest and
principal sums |
Large |
|
56-70 |
A |
Financial & operational base are regarded healthy. General
unfavourable factors will not cause fatal effect. Satisfactory capability for
payment of interest and principal sums |
Fairly Large |
|
41-55 |
Ba |
Overall operation is considered normal. Capable to meet normal
commitments. |
Satisfactory |
|
26-40 |
B |
Unfavourable & favourable factors carry similar weight in credit consideration.
Capability to overcome financial difficulties seems comparatively below
average. |
Small |
|
11-25 |
Ca |
Adverse factors are apparent. Repayment of interest and principal sums
in default or expected to be in default upon maturity |
Limited with
full security |
|
<10 |
C |
Absolute credit risk exists. Caution needed to be exercised |
Credit not
recommended |
|
NR |
In view of the lack of information, we have no basis upon which to
recommend credit dealings |
No Rating |
|
This score serves as a reference to assess SC’s credit risk
and to set the amount of credit to be extended. It is calculated from a
composite of weighted scores obtained from each of the major sections of this
report. The assessed factors and their relative weights (as indicated through
%) are as follows:
Financial
condition (40%) Ownership
background (20%) Payment
record (10%)
Credit history
(10%) Market trend
(10%) Operational
size (10%)