![]()
MIRA
INFORM REPORT
|
Report Date : |
13.06.2008 |
IDENTIFICATION
DETAILS
|
Name : |
INDUSTRIAS PUIGJANER SA |
|
|
|
|
Registered Office : |
Street Pintor Vila Cinca, 30 P.I. Can Humet De Dalt 08213 Polinya Barcelona |
|
|
|
|
Country : |
Spain |
|
|
|
|
Financials (as on) : |
31.12.2006 |
|
|
|
|
Date of Incorporation : |
|
|
|
|
|
Legal Form : |
Joint Stock Company |
|
|
|
|
Line of Business : |
Manufacturer of Machinery, Mechanical Equipment |
RATING &
COMMENTS
|
MIRA’s Rating : |
Ba |
|
RATING |
STATUS |
PROPOSED CREDIT LINE |
|
|
41-55 |
Ba |
Overall operation is considered normal. Capable to meet normal
commitments. |
Satisfactory |
|
Maximum Credit Limit : |
300.001,20 € |
|
|
|
|
Status : |
Satisfactory |
|
|
|
|
Payment Behaviour : |
Regular |
|
|
|
|
Litigation : |
Exists |
FINANCIAL
REPORT
INDUSTRIAS PUIGJANER SA
TAX NUMBER: A08297491
EXECUTIVE SUMMARY
Identification
Current Business Name: INDUSTRIAS
PUIGJANER SA
Commercial Name: DENN
Other names: NO
Current Address: STREET PINTOR
VILA CINCA, 30 P.I. CAN HUMET DE
DALT, CP 08213, POLINYA BARCELONA
Telephone number: 937132001 Fax: 937131125
URL: www.denn.es Corporate e-mail: denn@denn.es
Commercial Risk
Credit Appraisal: 300.001,20 €
Legal Actions: YES
Financial Information
Latest Balance sheet sales (2006): 7.591.746,17 € (MERCANTILE REGISTER)
Result: 402.348,32 €
Total Assets: 8.631.377,26 €
Social Capital: 405.683,17 €
Employees: 52
Commercial Information
Constitution Date: 23/09/1972
Business activity: Mfg. of
machinery, mechanical equipment
NACE Code: 2940
International Operations: Imports and
Exports
Corporate Structure
Administrator:
Participations: 5
Other Complementary Information
Latest proceeding published in BORME: 04/02/2008 Registration
of accounts
Latest press article: 23/03/2006 VANGUARDIA (GENERAL
INFORMATION)
Bank Entities: Yes
Credit Appraisal
Maximum Credit (from 0 a 6,000,000 €):
300.001,20 €
Rating Evolution
Financial Situation
Fiscal year2006
|
Treasury |
Excellent |
|
Indebtedness |
Weak |
|
Profitability |
Sufficient |
|
Balance |
Excellent |
Performance
|
Legal Actions |
None or Negligible |
|
Business
Trajectory |
Excellent |
INCIDENTS

Summary
|
LEGAL ACTIONS: 1 ( last:
09/11/1998 )Insolvency Proceeding: |
1 |
|
Civil Court: |
0 |
|
Social Court/ Industrial Tribunal: |
0 |
CLAIM FILED AGAINST THE ADMINISTRATION: No administrative
claims registered
AFFECTED BY: No significant element.
Last Legal Actions
Figures expressed in €
INSOLVENCY PROCEEDING
1 incidence(s)
|
DATE |
CLAIM TYPE |
INCIDENCE STATUS |
ASSETS |
LIABILITIES |
|
09/11/1998 |
TEMPORARY RECEIVERSHIP |
SUSPENSION OF PAYMENTS/DISCHARGE |
3.424.142 |
1.841.833,55 |
FINANCIAL ELEMENTS AND SECTORIAL
COMPARATIVE
FINANCIAL ELEMENTS
Figures given in €
|
|
2004 (12) |
2005 (12) |
2006 (12) |
% ASSETS |
|
|
|
|
|
|
BALANCE SHEET ANALYSIS |
|
|
|
|
|
|
|
|
|
|
OWN FUNDS |
3.116.906,32 |
3.558.600,65 |
4.364.451,70 |
50,56 |
|
|
|
|
|
|
DEBT |
6.791.355,97 |
6.209.780,08 |
4.266.925,56 |
49,44 |
|
|
|
|
|
|
FIXED ASSETS |
2.593.588,59 |
1.989.858,76 |
2.456.060,90 |
28,46 |
|
|
|
|
|
|
TOTAL ASSETS |
9.908.262,29 |
9.768.380,73 |
8.631.377,26 |
|
|
|
|
|
|
|
|
|
|
|
|
|
|
|
|
|
|
|
2004 (12) |
2005 (12) |
2006 (12) |
% SALES |
|
|
|
|
|
|
PROFIT AND LOSS ACCOUNT ANALYSIS |
|
|
|
|
|
|
|
|
|
|
SALES |
8.867.345,64 |
7.410.349,94 |
7.591.746,17 |
|
|
|
|
|
|
|
ADDED VALUE |
3.380.053,12 |
2.523.781,57 |
3.060.550,79 |
40,31 |
|
|
|
|
|
|
EBITDA |
1.363.917,21 |
379.047,12 |
894.833,21 |
11,79 |
|
|
|
|
|
|
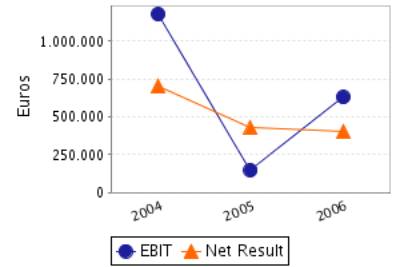
EBIT |
1.179.437,62 |
146.597,02 |
629.669,38 |
8,29 |
|
|
|
|
|
|
NET RESULT |
701.150,86 |
426.023,33 |
402.348,32 |
5,30 |
|
|
|
|
|
Balance Sheets Items Analysis
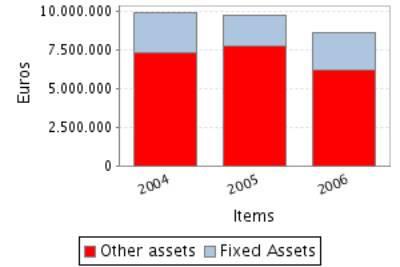
Balance Sheet
Comments
Total assets of the company decreased in 1,41% between 2004 and 2005.
This decrease has been greater in the fixed assets that reduced in
-23,28%.
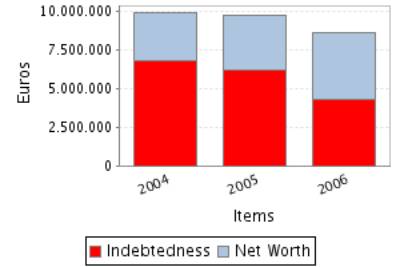
Assets reduction contrasts with net worth growth of 14,17%. Therefore,
the company’s indebtedness has reduced in 8,56%.
Total assets of the company decreased in 11,64% between 2005 and 2006.
In spite of the decrease in the amount of total assets, fixed assets
grew 23,43%.
Assets reduction contrasts with net worth growth of 22,65%. Therefore,
the company’s indebtedness has reduced in 31,29%.
Profit and Loss Account Analysis
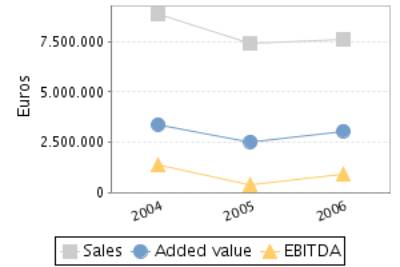
Profit and Loss
Account Comments
The company’s sales figure decreased in 16,43% between 2004 and 2005.
The company’s EBIT decreased in 87,57% between 2004 and 2005.
This evolution implies a reduction in the company’s operating
profitability.
The result of these variations is a decrease of the company’s Economic
Profitability of 87,39% in the analysed period, being this profitability of
1,50% in the year 2005.
The company’s Net Result decreased in 39,24% between 2004 and 2005.
This evolution, compared to the EBIT’s performance, implies that the
financial and extraordinary activities have had a positive effect in the
company’s Financial Profitability.
The result of these variations is a reduction of the company’s
profitability of 46,78% in the analysed period, being equal to 11,97% in the
year 2005.
The company’s sales figure grew 2,45% between 2005 and 2006.
The company’s EBIT grew 329,52% between 2005 and 2006.
This evolution implies an increase in the company’s operating
profitability.
The result of these variations is an increase of the company’s Economic
Profitability of 386,11% in the analysed period, being this profitability of
7,30% in the year 2006.
The company’s Net Result decreased in 5,56% between 2005 and 2006.
This evolution, compared to the EBIT’s performance, implies that the
financial and extraordinary activities have had a negative effect in the
company’s Financial Profitability.
The result of these variations is a reduction of the company’s
profitability of 23,00% in the analysed period, being equal to 9,22% in the
year 2006.
ANNUAL FINANCIAL REPORT
ADDITIONAL DATA
Source: annual financial report 2006
Results Distribution
Figures given in €
|
DISTRIBUTION
BASE |
DISTRIBUTION TO |
||
|
Profit and Loss |
402.348,32 |
Retained earnings |
0,00 |
|
Carry Over |
0,00 |
Voluntary Reserve |
307.848,32 |
|
Voluntary reserves |
0,00 |
Prior years losses |
0,00 |
|
Reserves |
0,00 |
Carry Over |
0,00 |
|
Other concepts |
0,00 |
Other funds |
0,00 |
|
Total of Amounts to be distributed |
402.348,32 |
Dividends |
94.500,00 |
|
|
|
Other Applications |
0,00 |
Auditing
Auditors’ opinion: FAVOURABLE
Auditor: RSB AUDITORES
ASOCIADOS SL
COMPARATIVE SECTOR ANALYSIS
Values table
Figures expressed in %
|
|
COMPANY (2006) |
SECTOR |
DIFFERENCE |
DIFFERENCE RELATIVE |
|
|
|
|
|
|
BALANCE SHEET ANALYSIS: % on the total
assets |
|
|
|
|
|
|
|
|
|
|
OWN FUNDS |
50,56 |
45,53 |
5,04 |
11,07 |
|
|
|
|
|
|
DEBT |
49,44 |
54,47 |
-5,04 |
-9,25 |
|
|
|
|
|
|
FIXED ASSETS |
28,46 |
31,22 |
-2,76 |
-8,84 |
|
|
|
|
|
|
|
|
|
|
|
|
|
|
|
|
|
|
COMPANY (2006) |
SECTOR |
DIFFERENCE |
DIFFERENCE RELATIVE |
|
|
|
|
|
|
PROFIT AND LOSS ACCOUNT ANALYSIS: % on the total
operating income |
|
|
|
|
|
|
|
|
|
|
SALES |
93,15 |
98,64 |
-5,49 |
-5,57 |
|
|
|
|
|
|
ADDED VALUE |
37,55 |
31,93 |
5,62 |
17,61 |
|
|
|
|
|
|
EBIT |
7,73 |
4,80 |
2,93 |
60,93 |
|
|
|
|
|
|
NET RESULT |
4,94 |
3,24 |
1,69 |
52,23 |
|
|
|
|
|
Sector Composition
Compared sector (NACE): 294
Number of companies: 22
Size (Sales Figure) : 7.000.000,00 -
40.000.000,00 Euros
Comments on the
sectorial comparative
Compared to its sector the assets of the companies show an inferior
proportion of fixed assets. Specifically the difference with the sector average
is -2,76% , which means a relative difference of -8,84% .
In liabilities composition the company appeals on a wider scale to self
financing, being the proportion of net worth of 5,04% superior, which means a
relative difference of 11,07% . As a consequence, external financing sources
are less used by the company in 5,04% less than the sector, which means a
difference of 9,25% .
The proportion that the sales mean to the company’s total ordinary
income is 93,15%, 5,49% lower than in the sector, which means a relative
difference of 5,57% .
The company’s EBIT was positive and was 7,73% with regard to the total
ordinary income, 2,93% higher than in the sector, which means a relative
difference of 60,93% .
The company’s capacity to generate operating income is higher than the
one of the sector as its ratio EBIT/Sales is higher (ES Company versus ES
Sector).
The company’s net result was positive and equal to 4,94% with regard to
the total ordinary income, 1,69% higher than in the sector, which means a
relative difference of 52,23% .
The financial and extraordinary results and the tax impact have had a
negative impact on the Net result in the company with a worse behaviour than in
the sector; as a consequence, the company shows a worse Net Result/EBIT ratio
(REBEmpresa vs. REBSector).
ADDRESSES
Current Legal Seat Address:
STREET PINTOR VILA CINCA, 30 P.I. CAN HUMET DE DALT
08213 POLINYA BARCELONA
Previous Seat Address:
STREET PINTOR VILACINCA, 30
08213
POLINYA BARCELONA
Characteristics of the current
address
Type of premises: office, factory,
warehouse
Property: owned; with no official confirmation
Local Situation: secondary
CORPORATE STRUCTURE
ADMINISTRATIVE LINKS
Main Board members,
Directors and Auditor ![]()
|
POSITION |
SURNAMES AND
NAME |
APPOINTMENT DATE |
|
|
ADMINISTRATOR |
PUIGJANER COLOM EDUARD |
05/09/2007 |
|
|
ADMINISTRATOR |
PUIGJANER COLOM JOAN FRANCESC |
05/09/2007 |
|
|
AUDITOR |
APPOINTMENT DATE |
||
|
RSB AUDITORES ASOCIADOS SL |
04/01/2008 |
||
Functional Managers
|
POSITION |
SURNAMES AND
NAME |
|
Financial Manager |
PUIGJANER COLOM EDUARDO |
|
Human Resources Manager |
PUIGJANER COLOM PAULINA |
|
Commercial Manager |
PUIGJANER COLOM EDUARDO |
|
Exports Manager |
PUIGJANER COLOM EDUARDO |
FINANCIAL LINKS
|
|
BUSINESS NAME |
CIF / COUNTRY |
% |
SOURCE |
DATA INF. |
|
|
PUIGJANER COLOM JUAN FRANCISCO |
|
8,00 |
OWN SOURCES |
20/04/2006 |
|
|
PUIGJANER COLOM EDUARDO |
|
8,00 |
OWN SOURCES |
20/04/2006 |
|
|
INDUSTRIAS PUIGJANER SA |
A08297491 |
1,29 |
OWN SOURCES |
20/04/2006 |
|
|
BUSINESS NAME |
CIF / COUNTRY |
% |
SOURCE |
DATA INF. |
|
|
DENN USA INC |
ESTADOS UNIDOS |
85,00 |
TRADE REG. |
31/12/2006 |
|
|
ITALDENN SPA |
ITALY |
31,00 |
TRADE REG. |
31/12/1995 |
|
|
FRANCE DENN |
FRANCIA |
30,00 |
TRADE REG. |
31/12/1995 |
|
|
INDUSTRIAS PUIGJANER SA |
A08297491 |
1,29 |
OWN SOURCES |
20/04/2006 |
|
|
DENNCO COMERCIAL DE MAQUINARIA S. A. |
A08948812 |
Subsid. |
OWN SOURCES |
07/01/2000 |
You can obtain business information of a foreign company at the
pageD&B International
CREDIT INFORMATION
Constitution Date: 23/09/1972
Business activity 
Activity: Mfg. of machinery, mechanical equipment
NACE Code: 2940
NACE Activity: Manufacture of
machine-tools
Business: FABRICACION DE MAQUINARIA PARA DEFORMACION DE CHAPA, POR EL PROCEDIMIENTO DE POTACION
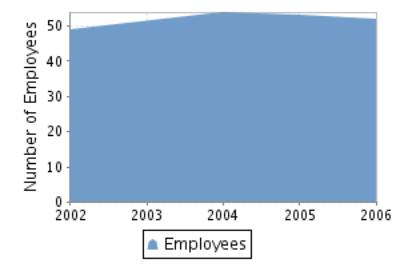
Employees 
Number of total employees: 52 (2006)
Number of fixed employees: 100,00%
Number of temporary employees: 0,00%
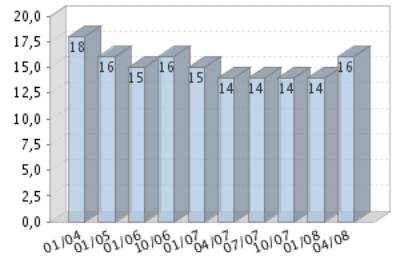
Employees evolution
Banks 
|
ENTITY |
BRANCH |
ADDRESS |
TOWN OR CITY |
PROVINCE |
|
CAJA DE AHORROS Y PENSIONES DE BARCELONA |
|
|
BARCELONA |
|
|
BANCO DE SABADELL, S.A. |
0061 |
CR SENTMENAT 000101 |
POLINYA |
Barcelona |
|
BANCO BILBAO VIZCAYA ARGENTARIA, S.A. |
5540 |
ALFONSO XIII, 25 |
SABADELL |
Barcelona |
3 bank entities registered
LEGAL STRUCTURE
Constitution Data
Register Date: 23/09/1972
Current structure data 
Current Legal Form: JOINT STOCK
COMPANY
Current Capital: 405.683,17 €
Legal Aspects
Obligation to fill in Financial
Statements: YES
Chamber census: YES (2006)
Listed on a Stock Exchange: NO
B.O.R.M.E.(Official Companies
Registry Gazette) 
Registered Proceedings
|
PROCEEDINGS |
DATE |
NOTICE NUM. |
TRADE REG. |
|
Appointments |
04/01/2008 |
5024 |
Barcelona |
|
Appointments |
04/01/2008 |
5007 |
Barcelona |
|
Appointments |
05/09/2007 |
456429 |
Barcelona |
Other Proceedings published
|
PROCEEDINGS |
DATE |
NOTICE NUM. |
TRADE REG. |
|
Registration of accounts (2006) Individual |
04/02/2008 |
54548 |
Barcelona |
|
Registration of accounts (2005) Individual |
11/12/2006 |
978833 |
Barcelona |
Press articles

23/03/2006 VANGUARDIA (GENERAL INFORMATION)
SEAT LIDERARA UN PROYECTO DE INVESTIGACION PARA LA BUSQUEDA DE NUEVOS
MATERIALES DE ACERO MAS RESISTENTES, EN EL QUE PARTICIPARAN OTRAS 15 EMPRESAS Y
5 CENTROS TECNOLOGICOS. EL PROYECTO, IMPULSADO POR EL CENTRO TECNOLOGICO DE
MANRESA (CTM), HA OBTENIDO UNA SUBVENCION DE 30 MM. DE EUROS DEL MINISTERIO DE
INDUSTRIA, TURISMO Y COMERCIO. JUNTO A SEAT PARTICIPAN EN EL PROYECTO DE I+D
OTRAS 5 GRANDES EMPRESAS, COMO GESTAMP, GRUPO ANTOLIN, BATZ Y VIZA, Y OTRAS 9
PEQUEÑAS Y MEDIANAS, COMO MIKALOR, ROWALMA, LANEKO, DENN Y CANDEMAT, ENTRE
OTRAS.
Complementary Information
Segun fuentes bancarias consultadas, la
titular firmo el convenio el
dia 23/2/98, de tal forma que se encuentra a la espera del levantamien
to del expediente de suspension de pagos en los proximos dias.
LEVANTADO EXPEDIENTE SUSPENSION DE PAGOS CON FECHA: 09/11/98
Fuente: B.O. de Barcelona Fecha
fuente: 18/12/98
Juzgado: 8 de Sabadell Auto:
285/94
Condiciones del convenio: quita del 30%, 70% restante se pagaran en un
plazo de 10 anos:
.10% el primero .10% el
sexto
.10% el segundo .10% el
septimo
.10% el tercero .10% el octavo
.10% el cuarto .10% el
noveno
.10% el quinto .10% el
decimo
Miembros de la comision seguidora del convenio: BANCO ESPANOL DE CRE -
DITO SA, BANCO CENTRAL HISPANOAMERICANO SA, REXROTH SA, G I R CONSUL-
TORES ASOCIADOS SL y FERNANDO MARIA BUENO SALAMERO.
FINANCIAL INFORMATION
The information on the last account contained in this report is
extracted from the Mercantile Register file of the legal address of the Company
and dated 16/01/2008.
BALANCE SHEET
Assets
Figures given in €
|
|
31/12/2004 (12) |
31/12/2005 (12) |
31/12/2006 (12) |
|
A) DUE FROM SHAREHOLDERS FOR UNCALLED CAPITAL |
|
|
|
|
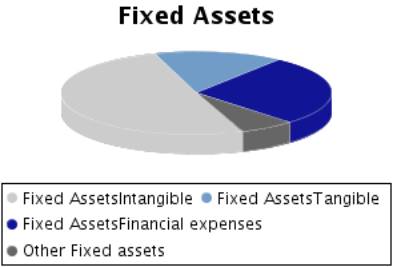
B) FIXED ASSETS |
2.593.588,59 |
1.989.858,76 |
2.456.060,90 |
|
I. Incorporation costs |
|
|
|
|
II. Intangible fixed assets |
699.337,65 |
919.969,23 |
1.241.696,23 |
|
R & D expenses |
46.978,03 |
46.978,03 |
46.978,03 |
|
Concessions, patents, licences , trademarks |
498.826,15 |
906.657,29 |
1.328.902,20 |
|
Goodwill |
|
|
|
|
Acquired rights from finance leases |
|
|
|
|
Software |
47.933,72 |
47.933,72 |
153.774,76 |
|
Leasing |
449.478,03 |
402.510,69 |
358.808,40 |
|
Cash advance |
|
|
|
|
Provisions |
|
|
|
|
Depreciation |
-343.878,28 |
-484.110,50 |
-646.767,16 |
|
III. Tangible fixed assets |
1.138.564,95 |
233.525,79 |
378.000,93 |
|
Property, plant and equipment |
1.179.509,84 |
|
|
|
Machinery, equipment and other |
112.508,76 |
201.574,24 |
251.031,56 |
|
Other property plant and equipment |
59.485,40 |
68.074,21 |
68.474,24 |
|
Prepaid expenses on fixed assets |
|
|
|
|
Other assets |
141.175,32 |
221.081,85 |
418.206,81 |
|
Provisions |
|
|
|
|
Depreciation |
-354.114,37 |
-257.204,51 |
-359.711,68 |
|
IV. Financial fixed assets |
593.685,99 |
674.363,74 |
674.363,74 |
|
Shares in affiliated companies |
198.957,85 |
198.957,85 |
198.957,85 |
|
Receivables in affiliated companies |
|
|
|
|
Shares in associated companies |
|
|
|
|
Loans to associated companies |
|
|
|
|
Securities |
244.728,14 |
289.405,89 |
289.405,89 |
|
Other loans |
|
|
|
|
Long term deposits and guarantees |
150.000,00 |
186.000,00 |
186.000,00 |
|
Provisions |
|
|
|
|
Taxes receivable |
|
|
|
|
V.Owners equity |
162.000,00 |
162.000,00 |
162.000,00 |
|
VI.Long term trade liabilities |
|
|
|
|
C) DEFERRED EXPENSES |
17.739,39 |
9.020,11 |
12.781,32 |
|
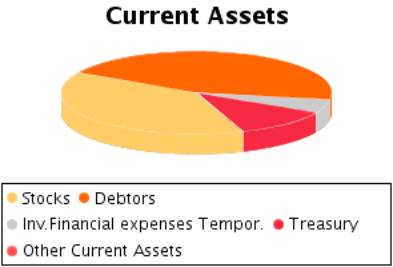
D) CURRENT ASSETS |
7.296.934,31 |
7.769.501,86 |
6.162.535,04 |
|
I. Shareholders by required outlays |
|
|
|
|
II. Stocks |
2.288.480,82 |
2.155.012,51 |
2.392.264,62 |
|
Goods available for sale |
2.256.165,46 |
2.126.882,68 |
2.333.223,07 |
|
Raw material inventory |
|
|
|
|
Work in Progress |
|
|
|
|
Finished goods |
|
|
|
|
Subproducts and recycled materials |
|
|
|
|
Cash advance |
32.315,36 |
28.129,83 |
59.041,55 |
|
Provisions |
|
|
|
|
III. Debtors |
4.182.253,07 |
4.902.498,67 |
2.743.861,44 |
|
Clients |
3.164.768,48 |
3.317.498,13 |
1.252.651,34 |
|
Amounts owned by affiliated companies |
438.813,98 |
438.813,98 |
397.067,98 |
|
Amounts owned by associated companies |
|
|
|
|
Other debts |
4.160,79 |
|
|
|
Staff Expenses |
53.197,34 |
2.135,16 |
1.829,82 |
|
Government |
521.312,48 |
1.144.051,40 |
1.092.312,30 |
|
Provisions |
|
|
|
|
IV. Temporary financial investment |
314.554,85 |
321.382,38 |
308.008,35 |
|
Shares in affiliated companies |
|
|
|
|
Receivables in affiliated companies |
314.554,85 |
321.382,38 |
308.008,35 |
|
Shares in associated companies |
|
|
|
|
Loans to associated companies |
|
|
|
|
Short term investment |
|
|
|
|
Other loans |
|
|
|
|
Short Term Deposit and guarantees |
|
|
|
|
Provisions |
|
|
|
|
V. Short-term own shares |
|
|
|
|
VI. Treasury |
503.910,41 |
382.873,14 |
710.665,47 |
|
VII. Periodification adjustments |
7.735,16 |
7.735,16 |
7.735,16 |
|
ASSETS (A + B + C + D) |
9.908.262,29 |
9.768.380,73 |
8.631.377,26 |
Assets composition
Liabilities
Figures given in €
|
|
31/12/2004 (12) |
31/12/2005 (12) |
31/12/2006 (12) |
|
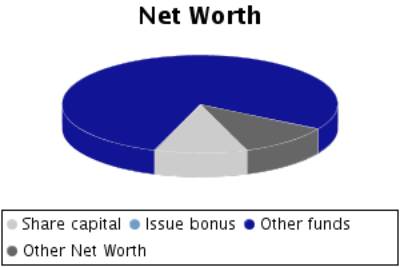
A) SHAREHOLDERS EQUITY |
3.073.684,05 |
3.414.657,38 |
3.722.505,70 |
|
I. Share capital |
405.683,17 |
405.683,17 |
405.683,17 |
|
II. Issue bonus |
|
|
|
|
III.Revaluation reserve |
|
|
|
|
IV.Reserves |
1.966.850,02 |
2.582.950,88 |
2.914.474,21 |
|
Retained earnings |
81.136,63 |
81.136,63 |
81.136,63 |
|
Sinking fund from owner equity |
162.000,00 |
162.000,00 |
162.000,00 |
|
Reserve for the parent company capital |
|
|
|
|
Statutory reserve |
|
|
|
|
Other funds |
1.723.713,39 |
2.339.814,25 |
2.671.337,58 |
|
Capital adjustments in Euros |
|
|
|
|
V.Results from previous years |
|
|
|
|
Carry Over |
|
|
|
|
Prior years losses |
|
|
|
|
Loans from partners for losses compensation |
|
|
|
|
VI.Profit and Losses |
701.150,86 |
426.023,33 |
402.348,32 |
|
VII.Dividend paid during the year |
|
|
|
|
VIII.Own shares for capital reduction |
|
|
|
|
B) DEFERRED INCOME |
43.222,27 |
143.943,27 |
641.946,00 |
|
Capital grants |
43.222,27 |
143.943,27 |
641.946,00 |
|
Positive change difference |
|
|
|
|
Other deferred income |
|
|
|
|
Fiscal deferred income |
|
|
|
|
C) PROVISIONS FOR LIABILITIES AND EXPENSES |
|
|
|
|
Provision for pensions plans |
|
|
|
|
Provision for taxes |
|
|
|
|
Other provisions |
|
|
|
|
Reversion fund |
|
|
|
|
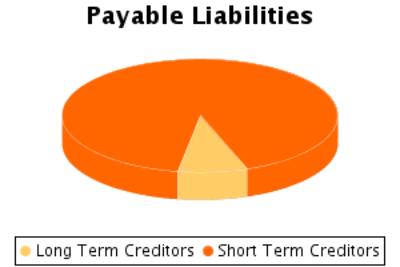
D) LONG TERM LIABILITIES |
1.722.620,91 |
218.117,09 |
348.330,20 |
|
I.Negotiable bonds and other negotiable values |
|
|
192.552,65 |
|
Non convertible securities |
|
|
|
|
Convertible securities |
|
|
192.552,65 |
|
Other convertible debentures |
|
|
|
|
II.Debt with bank entities |
1.722.620,91 |
218.117,09 |
|
|
Long term bank loans |
1.399.108,43 |
|
|
|
Leasing |
323.512,48 |
218.117,09 |
|
|
III.Debts with associated and affiliated
companies |
|
|
|
|
With affiliated companies |
|
|
|
|
Associated companies |
|
|
|
|
IV. Other creditors |
|
|
155.777,55 |
|
Bills payable |
|
|
|
|
Other debts |
|
|
155.777,55 |
|
Long term deposit and guaranties |
|
|
|
|
Taxes receivable |
|
|
|
|
V. Deferred debts on shares |
|
|
|
|
From affiliated companies |
|
|
|
|
From associated companies |
|
|
|
|
Other companies |
|
|
|
|
VI. Long term debt with creditor |
|
|
|
|
E) SHORT TERM LIABILITIES |
5.068.735,06 |
5.991.662,99 |
3.918.595,36 |
|
I.Negotiable bonds and other negotiable values |
|
|
|
|
Non convertible securities |
|
|
|
|
Convertible securities |
|
|
|
|
Other convertible debentures |
|
|
|
|
Interests from bonds |
|
|
|
|
II.Debt with bank entities |
2.754.333,20 |
3.200.565,36 |
1.788.911,60 |
|
Loans and other debts |
2.754.333,20 |
3.200.565,36 |
1.788.911,60 |
|
Debt interest |
|
|
|
|
Leasing |
|
|
|
|
III. Short term debts with associated and
affiliated companies |
|
|
|
|
With affiliated companies |
|
|
|
|
Associated companies |
|
|
|
|
IV. Commercial creditors |
1.938.382,18 |
2.005.278,15 |
1.860.208,58 |
|
Accounts payable |
342.108,76 |
673.704,10 |
672.155,46 |
|
Expenses |
1.596.273,42 |
1.331.574,05 |
1.188.053,12 |
|
Bills payable |
|
|
|
|
V. Other non-commercial debt |
376.019,68 |
785.819,48 |
269.475,18 |
|
Government |
248.507,21 |
742.160,63 |
74.249,23 |
|
Bills payable |
|
|
|
|
Other debts |
127.512,47 |
43.658,85 |
140.738,61 |
|
Accounts receivable |
|
|
54.487,34 |
|
Short term deposits and guarantees |
|
|
|
|
VI. Provisions for current assets |
|
|
|
|
VII. Periodification adjustments |
|
|
|
|
F) SHORT TERM PROVISIONS FOR LIABILITIES AND
EXPENSES |
|
|
|
|
LIABILITIES (A + B + C + D + E + F) |
9.908.262,29 |
9.768.380,73 |
8.631.377,26 |
Liabilities
Composition
PROFIT AND LOSS ACCOUNT
Itams of the Profit
and Loss Account
Figures given in €
|
|
31/12/2004 (12) |
31/12/2005 (12) |
31/12/2006 (12) |
|
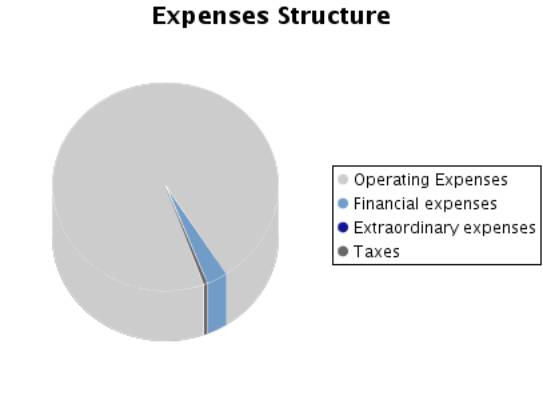
A) EXPENSES (A.1 a A.16) |
8.652.998,13 |
9.338.029,68 |
9.117.767,47 |
|
A.1.Reduction in stocks of finished goods and
work in progress |
|
|
|
|
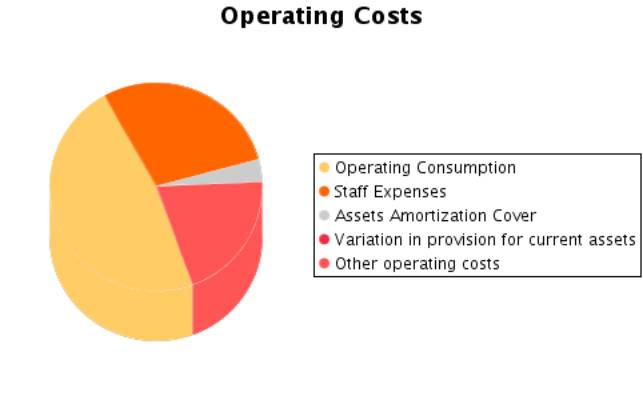
A.2.Supplies |
4.528.973,05 |
4.950.497,10 |
4.893.682,54 |
|
Material consumed |
3.095.125,80 |
1.561.090,59 |
1.114.933,27 |
|
Raw materials consumed |
|
2.308.350,93 |
2.445.280,05 |
|
Other expenses |
1.433.847,25 |
1.081.055,58 |
1.333.469,22 |
|
A.3. Labour cost |
2.016.135,91 |
2.144.734,45 |
2.165.717,58 |
|
Wages |
1.633.815,45 |
1.751.973,50 |
1.710.741,31 |
|
Social security expenses |
382.320,46 |
392.760,95 |
454.976,27 |
|
A.4. Assets depreciation |
147.785,40 |
232.450,10 |
265.163,83 |
|
A.5.Variance in the traffic provisions |
36.694,19 |
|
|
|
Variance in provision for inventory |
|
|
|
|
Variance in provision for bad debts |
36.694,19 |
|
|
|
Variance in provision for other current assets |
|
|
|
|
A.6. Other operating costs |
1.355.050,51 |
1.664.132,42 |
1.516.852,71 |
|
External costs |
1.311.526,21 |
1.648.224,98 |
1.437.615,72 |
|
Taxes |
43.524,30 |
15.907,44 |
79.236,99 |
|
Other day to day expenses |
|
|
|
|
Allowance to reversion fund |
|
|
|
|
A.I.OPERATING RESULT
(B.1+B.2+B.3+B.4-A.1-A.2-A.3-A.4-A.5-A.6) |
1.179.437,62 |
146.597,02 |
629.669,38 |
|
A.7.Financial expenses and similar |
258.325,16 |
275.471,53 |
223.527,11 |
|
Debts with related companies |
|
|
|
|
Debts with associated companies |
|
|
|
|
By debts with third parties and similar expenses |
258.325,16 |
275.409,03 |
223.527,11 |
|
Losses from financial investments |
|
62,50 |
|
|
A.8. Variation in financial investment provision |
|
|
|
|
A.9.Negative exchange difference |
144.706,33 |
|
10.755,86 |
|
A.II.POSITIVE FINANCIAL RESULTS
(B.5+B.6+B.7+B.8-A.7-A.8-A.9) |
|
|
|
|
A.III.PROFIT FROM ORDINARY ACTIVITIES
(A.I+A.II-B.I-B.II) |
803.565,71 |
|
429.669,33 |
|
A.10. Variation in provision in fixed assets |
|
|
|
|
A.11. Losses in fixed assets |
|
|
|
|
A.12. Losses from own shares and bonds |
|
|
|
|
A.13. Extraordinary charges |
8.417,14 |
413,57 |
3.010,42 |
|
A.14.Other exercises’ expenses and losses |
8.181,47 |
31.797,72 |
|
|
A.IV.POSITIVE EXTRAORDINARY RESULT
(B.9+B.10+B.11+B.12+B.13-A.10-A.11-A.12-A.13-A.14) |
46.314,12 |
559.163,68 |
11.736,41 |
|
A.V.PROFIT BEFORE TAXES (A.III+A.IV-B.III-B.IV) |
849.879,83 |
464.556,12 |
441.405,74 |
|
A.15.Corporate Taxes |
148.728,97 |
38.532,79 |
39.057,42 |
|
A.16. Other taxes |
|
|
|
|
A.VI.EXERCISE RESULT (PROFIT) (A.V-A.14-A.15) |
701.150,86 |
426.023,33 |
402.348,32 |
|
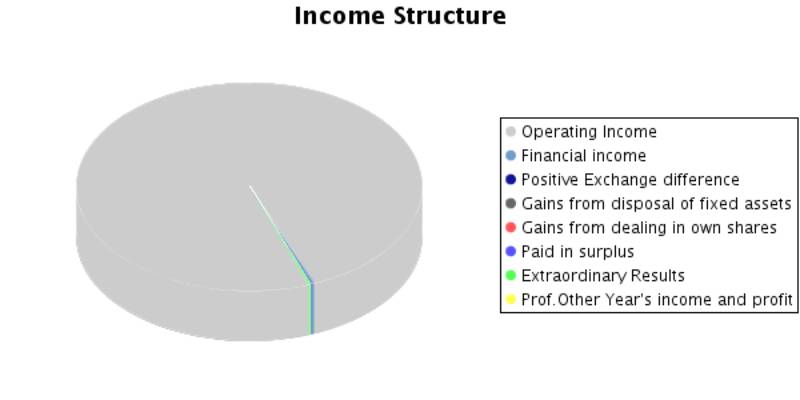
B) INCOMES (B.1 a B13) |
9.354.148,99 |
9.764.053,01 |
9.520.115,79 |
|
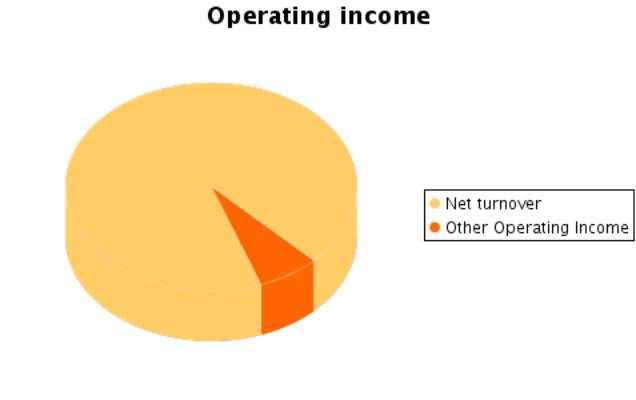
B.1. Turnover |
8.867.345,64 |
7.410.349,94 |
7.591.746,17 |
|
Sales |
8.736.550,59 |
7.126.501,15 |
6.936.141,50 |
|
Services provided |
130.795,05 |
283.848,79 |
655.604,67 |
|
Refunds and sale reminders |
|
|
|
|
B.2.Increase in inventory of finished goods and
works in progress |
345.141,38 |
1.431.807,81 |
1.321.273,66 |
|
B.3.Expenses capitalized |
51.589,66 |
295.365,34 |
|
|
B.4. Other operating income |
|
888,00 |
558.066,21 |
|
Other incomes |
|
888,00 |
|
|
Grants |
|
|
558.066,21 |
|
Excess in provision for liabilities and charges |
|
|
|
|
B.I.OPERATING LOSSES
(A.1+A.2+A.3+A.4+A.5+A.6-B.1-B.2-B.3-B.4) |
|
|
|
|
B.5.Incomes from share participations |
|
|
9.450,00 |
|
From affiliated companies |
|
|
9.450,00 |
|
From associated companies |
|
|
|
|
From other companies |
|
|
|
|
B.6.Income from other securities and credits to
fixed assets |
|
|
|
|
From affiliated companies |
|
|
|
|
From associated companies |
|
|
|
|
Other companies |
|
|
|
|
B.7.Other interests and similar |
24.197,65 |
17.815,14 |
22.088,65 |
|
From affiliated companies |
10.085,85 |
4.383,50 |
|
|
From associated companies |
|
|
|
|
Other Interests |
14.111,80 |
13.431,64 |
22.088,65 |
|
Profits from investments |
|
|
|
|
B.8. Positive change difference |
2.961,93 |
16.451,81 |
2.744,27 |
|
B.II. NEGATIVE FINANCIAL RESULTS
(A.7+A.8+A.9-B.5-B.6-B.7-B.8) |
375.871,91 |
241.204,58 |
200.000,05 |
|
B.III.LOSSES FROM ORDINARY ACTIVITIES (B.I+B.II-A.I-A.II) |
|
94.607,56 |
|
|
B.9.B.9. Gains from disposal of fixed assets |
|
440.175,14 |
663,27 |
|
B.10.Gains from dealing in own shares |
|
|
|
|
B.11. Paid in surplus |
60.013,49 |
151.064,55 |
|
|
B.12. Extraordinary income |
2.899,24 |
135,28 |
14.083,56 |
|
B.13.Other year’s income and profits |
|
|
|
|
B.IV.NEGATIVE EXTRAORDINARY LOSSES
(A.10+A.11+A.12+A.13+A.14-B.9-B.10-B.11-B.12-B.13) |
|
|
|
|
B.V.LOSS BEFORE TAXES (B.III+B.IV-A.III-A.IV) |
|
|
|
|
B.VI.EXERCISE RESULTS (LOSS) (B.V+A.14+A.15) |
|
|
|
Composition of the
Profit and Loss Account
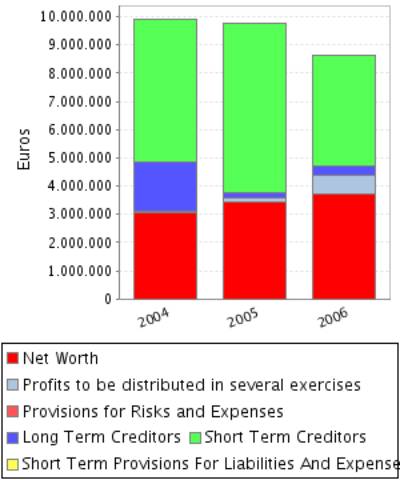
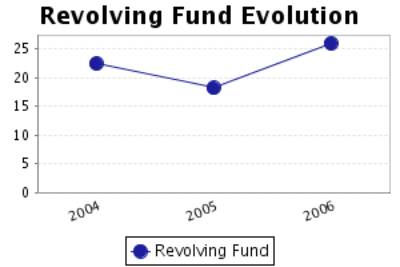
FINANCIAL BALANCE
Here the Main Capital Amounts of the company and the Revolving Fund
Evolution are analysed.
Financial Balance
Table
Figures given in €
|
|
31/12/2004 (12) |
% |
31/12/2005 (12) |
% |
31/12/2006 (12) |
% |
|
A) DUE FROM SHAREHOLDERS FOR UNCALLED CAPITAL |
|
|
|
|
|
|
|
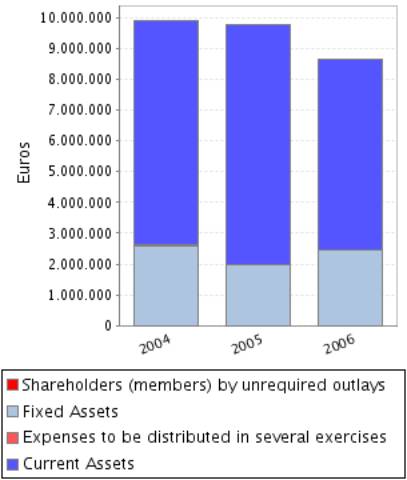
B) FIXED ASSETS |
2.593.588,59 |
26,18 |
1.989.858,76 |
20,37 |
2.456.060,90 |
28,46 |
|
C) DEFERRED EXPENSES |
17.739,39 |
0,18 |
9.020,11 |
0,09 |
12.781,32 |
0,15 |
|
D) CURRENT ASSETS |
7.296.934,31 |
73,64 |
7.769.501,86 |
79,54 |
6.162.535,04 |
71,40 |
|
ASSETS (A + B + C + D) |
9.908.262,29 |
|
9.768.380,73 |
|
8.631.377,26 |
|
|
|
||||||
|
A) SHAREHOLDERS EQUITY |
3.073.684,05 |
31,02 |
3.414.657,38 |
34,96 |
3.722.505,70 |
43,13 |
|
B) DEFERRED INCOME |
43.222,27 |
0,44 |
143.943,27 |
1,47 |
641.946,00 |
7,44 |
|
C) PROVISIONS FOR LIABILITIES AND EXPENSES |
|
|
|
|
|
|
|
D) LONG TERM LIABILITIES |
1.722.620,91 |
17,39 |
218.117,09 |
2,23 |
348.330,20 |
4,04 |
|
E) SHORT TERM LIABILITIES |
5.068.735,06 |
51,16 |
5.991.662,99 |
61,34 |
3.918.595,36 |
45,40 |
|
F) SHORT TERM PROVISIONS FOR LIABILITIES AND EXPENSES |
|
|
|
|
|
|
|
LIABILITIES (A + B + C + D + E + F) |
9.908.262,29 |
|
9.768.380,73 |
|
8.631.377,26 |
|
Financial Balance
Composition
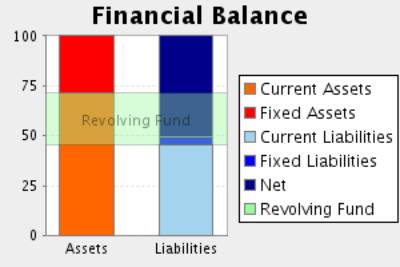
Comments on Financial
Balance
In the 2004, the assets of the company were formed in 26,36% of Fixed
Assets and in 73,64% of Current Assets.This assets were financed in 31,46% with
own capitals, and in 17,39% with long term debt and in 51,16% with current
liabilities.
The result of this financial structure is a positive turnover fund of
2.228.199,25 Euros, which is equivalent to 22,49% proportion of the
company’s total assets.
In the 2005, the assets of the company were formed in 20,46% of Fixed
Assets and in 79,54% of Current Assets.This assets were financed in 36,43% with
own capitals, and in 2,23% with long term debt and in 61,34% with current
liabilities.
The result of this financial structure is a positive turnover fund of
1.777.838,87 Euros, which is equivalent to 18,20% proportion of the
company’s total assets.
This measure has diminished with respect to the previous exercise in
20,21% having also diminished its proportion with respect to the total assets
of the company.
In the 2006, the assets of the company were formed in 28,60% of Fixed
Assets and in 71,40% of Current Assets.This assets were financed in 50,56% with
own capitals, and in 4,04% with long term debt and in 45,40% with current
liabilities.
The result of this financial structure is a positive turnover fund of
2.243.939,68 Euros, which is equivalent to 26,00% proportion of the
company’s total assets.
This measure has increased with respect to the previous exercise in
26,22% having also increased its proportion with respect to the total assets of
the company.
RATIOS
Main Ratios
|
|
31/12/2004 (12) |
31/12/2005 (12) |
31/12/2006 (12) |
|
STRUCTURAL RATIOS |
|
|
|
|
Management fund |
2.228.199,25 |
1.777.838,87 |
2.243.939,68 |
|
Management Fund Requirement |
4.164.067,19 |
4.274.148,71 |
3.014.177,46 |
|
Indebtedness (%) |
68,54 |
63,57 |
49,44 |
|
External Funds on Net Worth |
2,18 |
1,74 |
0,98 |
|
GENERAL ACTIVITY RATIO |
|
|
|
|
Turnover Increase (%) |
18,93 |
-16,43 |
2,45 |
|
Added value growth (%) |
47,23 |
-25,33 |
21,27 |
|
Cash Flow |
885.630,45 |
658.473,43 |
667.512,15 |
|
Labour Productivity |
1,68 |
1,18 |
1,41 |
|
Assets turnover |
0,90 |
0,76 |
0,88 |
|
Breakdown Point |
6.697.372,98 |
7.436.835,30 |
7.028.721,07 |
|
Security Margin of the Breakdown Point (%) |
24,91 |
3,50 |
13,76 |
|
ACTIVITY RATIOS |
|
|
|
|
Average Payment Period |
167 |
205 |
187 |
|
Average Collection Period |
170 |
238 |
130 |
|
Inventory Turnover Period |
93 |
105 |
113 |
|
SOLVENCY RATIOS |
|
|
|
|
Payback Capacity |
0,13 |
0,11 |
0,16 |
|
Assets Guarantee |
1,46 |
1,57 |
2,02 |
|
Short Term Debts Proportion (%) |
74,64 |
96,49 |
91,84 |
|
Interest Coverage |
1,74 |
-5,08 |
-3,14 |
|
LIQUIDITY RATIOS |
|
|
|
|
Current Ratio |
1,44 |
1,30 |
1,57 |
|
Immediate liquidity |
0,16 |
0,12 |
0,26 |
|
Treasury |
-1.935.867,94 |
-2.496.309,84 |
-770.237,78 |
|
Sales on Current Assets |
437 |
343 |
443 |
Results Analysis
Ratios
|
|
31/12/2004 (12) |
31/12/2005 (12) |
31/12/2006 (12) |
|
Economic profitability (%) |
11,90 |
1,50 |
7,30 |
|
Operating Profitability (%) |
13,30 |
1,98 |
8,29 |
|
Equity gearing |
2,17 |
-1,77 |
1,35 |
|
Financial profitability (%) |
22,50 |
11,97 |
9,22 |
|
General Profitability (%) |
7,91 |
5,75 |
5,30 |
Comments on the
Results Analysis Ratios
The economic profitability in the year2005 achieved a 1,50% positive
level, due to a 1,98% economic margin and to an assets turnover of0,76%.
The economic profitability in the year has reduced from 11,90% up to
1,50% of2005, even if it remains positive. This fall is due to the decrease in
operating profitability, that has passe from 13,30% to 1,98%, as assets
turnover whose index has passed from 0,90 to 0,76%.
Financial profitability on 2005 achieved a 11,97%.
The company’s financial structure has endangered its profitability with
an indebtedness level -1,77.
The general profitability on 2005 achieved a 5,75%.
The economic profitability in the year2006 achieved a 7,30% positive
level, due to a 8,29% economic margin and to an assets turnover of0,88%.
The economic profitability in the year has increased from 1,50% up to
7,30%. This growth is due to the economic margin increase, from 1,98% to the
current 8,29Y%, and to the assets turnover index, which in the last period has
achieved 0,88, compared to 0,76 del 2005.
Financial profitability on 2006 achieved a 9,22%.
The company’s financial structure has instigated its economic
profitability with an indebtedness level of 1,35.
The general profitability on 2006 achieved a 5,30%.
SECTORIAL ANÁLYSIS
Large Capital Amounts and Financial Balance
Figures given in %
|
|
COMPANY (2006) |
SECTOR |
DIFFERENCE |
DIFFERENCE RELATIVE |
|
|
|
|
|
|
ASSETS |
|
|
|
|
|
|
|
|
|
|
A) DUE FROM SHAREHOLDERS FOR UNCALLED CAPITAL |
|
0,00 |
|
|
|
|
|
|
|
|
B) FIXED ASSETS |
28,46 |
31,22 |
-2,75 |
-8,83 |
|
|
|
|
|
|
C) DEFERRED EXPENSES |
0,15 |
0,14 |
0,01 |
6,38 |
|
|
|
|
|
|
D) CURRENT ASSETS |
71,40 |
68,64 |
2,76 |
4,02 |
|
|
|
|
|
|
ASSETS (A + B + C + D) |
100 |
100 |
|
|
|
|
|
|
|
|
|
|
|
|
|
|
|
|
|
|
|
|
COMPANY (2006) |
SECTOR |
DIFFERENCE |
DIFFERENCE RELATIVE |
|
|
|
|
|
|
LIABILITIES |
|
|
|
|
|
|
|
|
|
|
A) SHAREHOLDERS EQUITY |
43,13 |
45,05 |
-1,92 |
-4,26 |
|
|
|
|
|
|
B) DEFERRED INCOME |
7,44 |
0,48 |
6,96 |
1.459,75 |
|
|
|
|
|
|
C) PROVISIONS FOR LIABILITIES AND EXPENSES |
|
1,21 |
|
|
|
|
|
|
|
|
D) LONG TERM LIABILITIES |
4,04 |
10,02 |
-5,98 |
-59,66 |
|
|
|
|
|
|
E) SHORT TERM LIABILITIES |
45,40 |
42,91 |
2,49 |
5,80 |
|
|
|
|
|
|
F) SHORT TERM PROVISIONS FOR LIABILITIES AND EXPENSES |
|
0,34 |
|
|
|
|
|
|
|
|
LIABILITIES (A + B + C + D + E + F) |
100 |
100 |
|
|
|
|
|
|
|
Financial Balance Composition
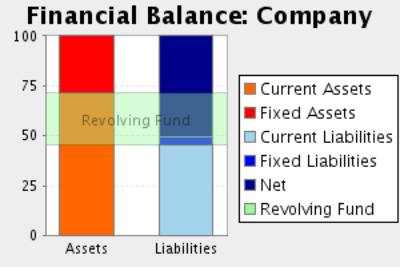
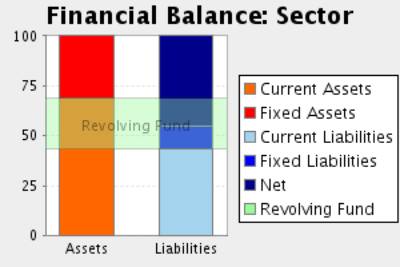
Comments to the
Sectorial Analysis
In the 2006, the assets of the company were formed in 28,60% of fixed
assets and in 71,40Current Assets % In the sector, the proportion of fixed
assets was of 31,36%, 8,79% superior, and the proportion of current assets was
of 68,64%, 4,02% inferior.
The assets were financed in the company in 50,56% with own capitals , in
4,04% with fixed liabilities and in 45,40% with current liabilities In the
sector, the self financing represented 45,53%, 11,06% inferior. On the other
hand the long term debts represented in the sector an average of 11,22%
financing, with a relative difference of 64,00% favourable to the sectorAnd,
short term liabilities represented in the sector an average of 43,25%
financing, with a relative difference of 4,97% in favour of the company
The result of this company’s financial structure is a turnover fund that
represents 26,00% of the total assets; in the sector, this same proportion is
25,39%, therefore, we can say that the company’s turnover fund is 2,40% higher
than the one in of the sector.
Analytical Account of Results
Figures given in %
|
|
COMPANY (2006) |
SECTOR |
DIFFERENCE |
DIFFERENCE RELATIVE |
|
Turnover |
93,15 |
98,64 |
-5,49 |
-5,57 |
|
Other operating income |
6,85 |
1,36 |
5,49 |
405,16 |
|
Production Value |
100,00 |
100,00 |
0,00 |
0,00 |
|
Operating expenses |
43,83 |
53,68 |
-9,85 |
-18,34 |
|
Other operation expenses |
18,61 |
14,39 |
4,22 |
29,31 |
|
Added value |
37,55 |
31,93 |
5,62 |
17,60 |
|
Labour cost |
26,57 |
23,81 |
2,76 |
11,58 |
|
Gross Economic Result |
10,98 |
8,12 |
2,86 |
35,25 |
|
Assets depreciation |
3,25 |
3,85 |
-0,60 |
-15,50 |
|
Variation in provision for current assets and bad debt losses |
|
-0,53 |
|
|
|
Net Economic Result |
7,73 |
4,80 |
2,93 |
61,01 |
|
Financial income |
0,42 |
0,73 |
-0,31 |
-42,78 |
|
Financial Charges |
2,87 |
1,21 |
1,66 |
137,58 |
|
Variation in financial investment provision |
|
0,23 |
|
|
|
Ordinary Activities Result |
5,27 |
4,10 |
1,17 |
28,57 |
|
Extraordinary income |
0,18 |
1,40 |
-1,22 |
-87,13 |
|
Extraordinary charges |
0,04 |
0,42 |
-0,38 |
-90,52 |
|
Variation in provision in fixed assets |
|
-0,25 |
|
|
|
Results before Taxes |
5,42 |
5,32 |
0,10 |
1,84 |
|
Corporate taxes |
0,48 |
2,08 |
-1,60 |
-76,91 |
|
Net Result |
4,94 |
3,24 |
1,70 |
52,33 |
|
Assets depreciation |
3,25 |
3,85 |
-0,60 |
-15,50 |
|
Change of Provisions |
|
-0,55 |
|
|
|
Net Self-Financing |
8,19 |
6,54 |
1,65 |
25,21 |
Main Ratios
|
|
COMPANY (2006) |
PTILE25 |
PTILE50 |
PTILE75 |
|
STRUCTURAL RATIOS |
|
|
|
|
|
Management fund |
2.243.939,68 |
552,64 |
1.728,32 |
7.675,39 |
|
Management Fund Requirement |
3.014.177,46 |
-2.295,04 |
233,52 |
5.185,85 |
|
Indebtedness (%) |
49,44 |
38,61 |
60,35 |
77,47 |
|
External Funds on Net Worth |
0,98 |
0,63 |
1,52 |
3,44 |
|
GENERAL ACTIVITY RATIO |
|
|
|
|
|
Turnover Increase (%) |
2,45 |
-4,31 |
10,01 |
22,23 |
|
Added value growth (%) |
21,27 |
-6,10 |
6,68 |
17,11 |
|
Cash Flow |
667.512,15 |
117,93 |
639,14 |
1.720,70 |
|
Labour Productivity |
1,41 |
0,98 |
1,32 |
1,76 |
|
Assets turnover |
0,88 |
0,75 |
1,14 |
1,46 |
|
Breakdown Point |
7.028.721,07 |
7.370.494,13 |
9.829.625,98 |
22.924.103,52 |
|
Security Margin of the Breakdown Point (%) |
13,76 |
-11,09 |
7,01 |
22,90 |
|
ACTIVITY RATIOS |
|
|
|
|
|
Average Payment Period |
187 |
96 |
130 |
205 |
|
Average Collection Period |
130 |
83 |
124 |
159 |
|
Inventory Turnover Period |
113 |
26 |
82 |
105 |
|
SOLVENCY RATIOS |
|
|
|
|
|
Payback Capacity |
0,16 |
0,03 |
0,12 |
0,33 |
|
Assets Guarantee |
2,02 |
1,29 |
1,66 |
2,61 |
|
Short Term Debts Proportion (%) |
91,84 |
71,32 |
90,97 |
99,38 |
|
Interest Coverage |
-3,14 |
-1,54 |
2,86 |
41,10 |
|
LIQUIDITY RATIOS |
|
|
|
|
|
Current Ratio |
1,57 |
1,07 |
1,37 |
2,27 |
|
Immediate liquidity |
0,26 |
0,02 |
0,13 |
0,54 |
|
Treasury |
-770.237,78 |
-1.640,89 |
116,67 |
2.463,56 |
|
Sales on Current Assets |
443 |
402 |
556 |
757 |
Results Analysis
Ratios
|
|
COMPANY (2006) |
PTILE25 |
PTILE50 |
PTILE75 |
|
Economic profitability (%) |
7,30 |
-3,73 |
3,48 |
11,95 |
|
Operating Profitability (%) |
8,29 |
-4,84 |
2,72 |
9,82 |
|
Equity gearing |
1,35 |
1,16 |
2,03 |
6,14 |
|
Financial profitability (%) |
9,22 |
-4,52 |
6,28 |
15,44 |
|
General Profitability (%) |
5,30 |
-2,30 |
1,72 |
8,21 |
NOTES
ABOUT YOUR REQUEST:
The subject’s correct address is C/ Pintor Vila Cinca, 30 Pol. Ind.
Can Humet de Dalt, Polinya (Barcelona).
The latest balance sheets in the Official Mercantile Register of
this company is for 2006.
In spite of investigations using every source available (public and
private), no additional details than those contained in this report
are available. .
RATING EXPLANATIONS
|
RATING |
STATUS |
PROPOSED CREDIT LINE |
|
|
>86 |
Aaa |
Possesses an extremely sound financial base with the strongest
capability for timely payment of interest and principal sums |
Unlimited |
|
71-85 |
Aa |
Possesses adequate working capital. No caution needed for credit
transaction. It has above average (strong) capability for payment of interest
and principal sums |
Large |
|
56-70 |
A |
Financial & operational base are regarded healthy. General
unfavourable factors will not cause fatal effect. Satisfactory capability for
payment of interest and principal sums |
Fairly Large |
|
41-55 |
Ba |
Overall operation is considered normal. Capable to meet normal
commitments. |
Satisfactory |
|
26-40 |
B |
Unfavourable & favourable factors carry similar weight in credit
consideration. Capability to overcome financial difficulties seems
comparatively below average. |
Small |
|
11-25 |
Ca |
Adverse factors are apparent. Repayment of interest and principal sums
in default or expected to be in default upon maturity |
Limited with
full security |
|
<10 |
C |
Absolute credit risk exists. Caution needed to be exercised |
Credit not
recommended |
|
NR |
In view of the lack of information, we have no basis upon which to
recommend credit dealings |
No Rating |
|
This score serves as a reference to assess SC’s credit risk
and to set the amount of credit to be extended. It is calculated from a composite
of weighted scores obtained from each of the major sections of this report. The
assessed factors and their relative weights (as indicated through %) are as
follows:
Financial
condition (40%) Ownership
background (20%) Payment
record (10%)
Credit history
(10%) Market trend
(10%) Operational
size (10%)