![]()
MIRA
INFORM REPORT
|
Report Date : |
24.06.2008 |
IDENTIFICATION
DETAILS
|
Name : |
KIMROC S.L. |
|
|
|
|
Registered Office : |
Street Ourense, 59 27004 Lugo |
|
|
|
|
Country : |
Spain |
|
|
|
|
Financials (as on) : |
31.12.2006 |
|
|
|
|
Date of Incorporation : |
|
|
|
|
|
Legal Form : |
Limited Liability Company |
|
|
|
|
Line of Business : |
RATING &
COMMENTS
|
MIRA’s Rating : |
Ba |
|
RATING |
STATUS |
PROPOSED CREDIT LINE |
|
|
41-55 |
Ba |
Overall operation is considered normal. Capable to meet normal
commitments. |
Satisfactory |
|
Maximum Credit Limit : |
6.010,12 € |
|
|
|
|
Status : |
Satisfactory |
|
|
|
|
Payment Behaviour : |
No Complaints |
|
|
|
|
Litigation : |
Clear |
FINANCIAL REPORT
KIMROC S.L.
TAX NUMBER: B27243955
EXECUTIVE SUMMARY
Identification
Current Business Name: KIMROC S.L.
Other names: NO
Current Address: STREET OURENSE, 59, CP 27004 LUGO
Telephone number: 982231002 Fax: 986343986
URL: www.kimroc.com Corporate e-mail: francisco.jdematos@tormat.com
Commercial Risk
Credit Appraisal: 6.010,12 €
Legal Actions: NO
Financial Information
Latest Balance sheet sales (2006): 67.704,05 € (MERCANTILE REGISTER)
Result: 914,13 €
Total Assets: 67.544,16 €
Social Capital: 36.061,00 €
Employees: 1
Commercial Information
Constitution Date: 19/05/1999
Business activity: Retail sale
in specialized stores
NACE Code: 5248
International Operations: No business
relationships registered
Corporate Structure
Administrator:
DE MATOS
CARRASCO FRANCISCO JOSE
Other Complementary Information
Latest proceeding published in BORME: 14/08/2007 Registration
of accounts
Bank Entities: No
Credit Appraisal
Maximum Credit (from 0 a 6,000,000 €):
6.010,12 €
Rating Evolution
Financial Situation
Fiscal year2006
|
Treasury |
Excellent |
|
Indebtedness |
Nil |
|
Profitability |
Average |
|
Balance |
Excellent |
Performance
|
Legal Actions |
None or Negligible |
|
Business
Trajectory |
Excellent |
INCIDENTS

Summary
LEGAL ACTIONS: No legal
incidences registered
CLAIM FILED AGAINST THE ADMINISTRATION: No administrative
claims registered
AFFECTED BY: No significant
element.
FINANCIAL ELEMENTS AND SECTORIAL
COMPARATIVE
FINANCIAL ELEMENTS
Figures given in €
|
|
2004 (12) |
2005 (12) |
2006 (12) |
% ASSETS |
|
|
|
|
|
|
BALANCE SHEET
ANALYSIS |
|
|
|
|
|
|
|
|
|
|
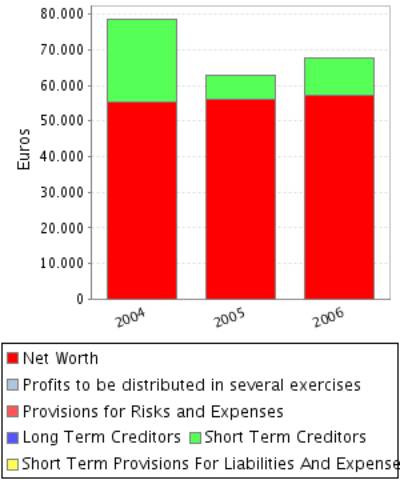
OWN FUNDS |
55.334,39 |
56.181,87 |
57.096,00 |
84,53 |
|
|
|
|
|
|
DEBT |
23.217,78 |
6.453,00 |
10.448,16 |
15,47 |
|
|
|
|
|
|
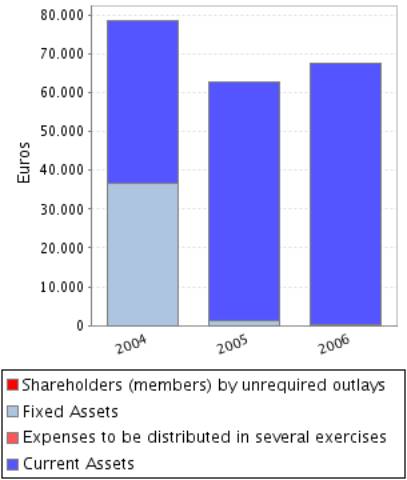
FIXED ASSETS |
36.803,67 |
1.106,67 |
276,67 |
0,41 |
|
|
|
|
|
|
TOTAL ASSETS |
78.552,17 |
62.634,87 |
67.544,16 |
|
|
|
|
|
|
|
|
|
|
|
|
|
|
|
|
|
|
|
2004 (12) |
2005 (12) |
2006 (12) |
% SALES |
|
|
|
|
|
|
PROFIT AND LOSS
ACCOUNT ANALYSIS |
|
|
|
|
|
|
|
|
|
|
SALES |
30.283,60 |
24.800,00 |
67.704,05 |
|
|
|
|
|
|
|
ADDED VALUE |
17.218,83 |
708,81 |
3.680,27 |
5,44 |
|
|
|
|
|
|
EBITDA |
9.517,51 |
708,81 |
3.680,27 |
5,44 |
|
|
|
|
|
|
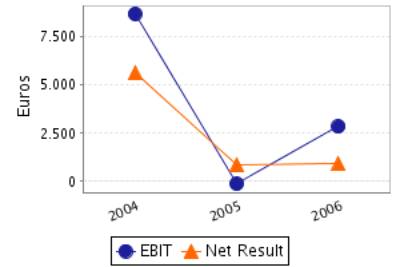
EBIT |
8.687,51 |
-121,19 |
2.850,27 |
4,21 |
|
|
|
|
|
|
NET RESULT |
5.639,47 |
847,21 |
914,13 |
1,35 |
|
|
|
|
|
Balance Sheets Items
Analysis
Balance Sheet
Comments
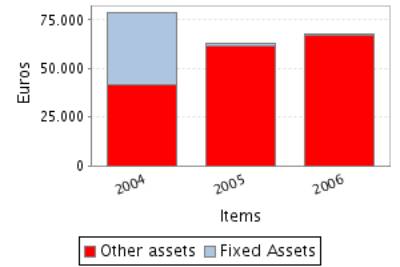
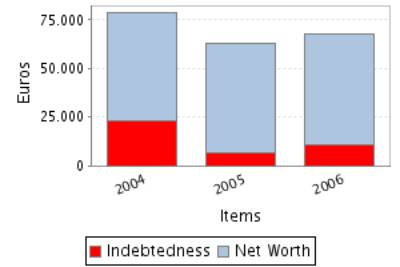
Total assets of the company decreased in 20,26% between 2004 and 2005.
This decrease has been greater in the fixed assets that reduced in
-96,99%.
Assets reduction contrasts with net worth growth of 1,53%. Therefore,
the company’s indebtedness has reduced in 72,21%.
Total assets of the company grew 7,84% between 2005 and 2006.
In spite of the assets’ growth, the fixed assets decreased 75,00%.
This growth has been mainly financed with a debt increase of 61,91%.
Nevertheless the net worth increased 1,63%.
Profit and Loss Account Analysis
Profit and Loss
Account Comments
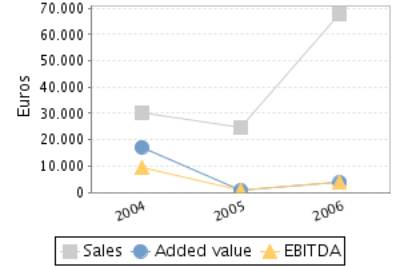
The company’s sales figure decreased in 18,11% between 2004 and 2005.
The company’s EBIT decreased in 101,39% between 2004 and 2005.
This evolution implies a reduction in the company’s operating
profitability.
The result of these variations is a decrease of the company’s Economic
Profitability of 101,75% in the analysed period, being this profitability of
-0,19% in the year 2005.
The company’s Net Result decreased in 84,98% between 2004 and 2005.
This evolution, compared to the EBIT’s performance, implies that the
financial and extraordinary activities have had a positive effect in the
company’s Financial Profitability.
The result of these variations is a reduction of the company’s
profitability of 85,20% in the analysed period, being equal to 1,51% in the
year 2005.
The company’s sales figure grew 173,00% between 2005 and 2006.
The company’s EBIT grew 2.451,90% between 2005 and 2006.
This evolution implies an increase in the company’s operating
profitability.
The result of these variations is an increase of the company’s Economic
Profitability of 2.280,83% in the analysed period, being this profitability of
4,22% in the year 2006.
The company’s Net Result grew 7,90% between 2005 and 2006.
This evolution, compared to the EBIT’s performance, implies that the
financial and extraordinary activities have had a negative effect in the
company’s Financial Profitability.
The result of these variations is an increase of the company’s Economic
Profitability of 6,17% in the analysed period, being equal to 1,60% in the year
2006.
ANNUAL FINANCIAL REPORT
ADDITIONAL DATA
Source: annual financial report 2006
Results Distribution
Figures given in €
|
DISTRIBUTION
BASE |
DISTRIBUTION TO |
||
|
Profit and Loss |
914,13 |
Retained earnings |
91,41 |
|
Carry Over |
0,00 |
Voluntary Reserve |
822,72 |
|
Voluntary reserves |
0,00 |
Prior years losses |
0,00 |
|
Reserves |
0,00 |
Carry Over |
0,00 |
|
Other concepts |
0,00 |
Other funds |
0,00 |
|
Total of Amounts to be distributed |
914,13 |
Dividends |
0,00 |
|
|
|
Other Applications |
0,00 |
COMPARATIVE SECTOR ANALYSIS
Values table
Figures expressed in %
|
|
COMPANY (2006) |
SECTOR |
DIFFERENCE |
DIFFERENCE RELATIVE |
|
|
|
|
|
|
BALANCE SHEET ANALYSIS: % on the total
assets |
|
|
|
|
|
|
|
|
|
|
OWN FUNDS |
84,53 |
36,42 |
48,11 |
132,08 |
|
|
|
|
|
|
DEBT |
15,47 |
63,58 |
-48,11 |
-75,67 |
|
|
|
|
|
|
FIXED ASSETS |
0,41 |
34,52 |
-34,12 |
-98,81 |
|
|
|
|
|
|
|
|
|
|
|
|
|
|
|
|
|
|
COMPANY (2006) |
SECTOR |
DIFFERENCE |
DIFFERENCE RELATIVE |
|
|
|
|
|
|
PROFIT AND LOSS ACCOUNT ANALYSIS: % on the total
operating income |
|
|
|
|
|
|
|
|
|
|
SALES |
100,00 |
98,56 |
1,44 |
1,47 |
|
|
|
|
|
|
ADDED VALUE |
5,44 |
22,31 |
-16,88 |
-75,64 |
|
|
|
|
|
|
EBIT |
4,21 |
3,35 |
0,86 |
25,67 |
|
|
|
|
|
|
NET RESULT |
1,35 |
2,20 |
-0,85 |
-38,66 |
|
|
|
|
|
Sector Composition
Compared sector (NACE): 524
Number of companies: 14770
Size (Sales Figure) : 0 - 2.800.000,00
Euros
Comments on the
sectorial comparative
Compared to its sector the assets of the companies show an inferior
proportion of fixed assets. Specifically the difference with the sector average
is -34,12% , which means a relative difference of -98,81% .
In liabilities composition the company appeals on a wider scale to self
financing, being the proportion of net worth of 48,11% superior, which means a
relative difference of 132,08% . As a consequence, external financing sources
are less used by the company in 48,11% less than the sector, which means a
difference of 75,67% .
The proportion that the sales mean to the company’s total ordinary
income is 100,00%, 1,44% higher than in the sector, which means a relative
difference of 1,47% .
The company’s EBIT was positive and was 4,21% with regard to the total
ordinary income, 0,86% higher than in the sector, which means a relative
difference of 25,67% .
The company’s capacity to generate operating income is higher than the
one of the sector as its ratio EBIT/Sales is higher (ES Company versus ES
Sector).
The company’s net result was positive and equal to 1,35% with regard to
the total ordinary income, 0,85% less than the sector, which means a relative
difference of 38,66% .
The financial and extraordinary results and the tax impact have had a
negative impact on the Net result in the company with a worse behaviour than in
the sector; as a consequence, the company shows a worse Net Result/EBIT ratio
(REBEmpresa vs. REBSector).
ADDRESSES
Current Legal Seat Address:
STREET OURENSE, 59
27004
LUGO
CORPORATE STRUCTURE
ADMINISTRATIVE LINKS
Main Board members,
Directors and Auditor ![]()
|
POSITION |
SURNAMES AND
NAME |
APPOINTMENT DATE |
|
ADMINISTRATOR |
DE MATOS CARRASCO FRANCISCO JOSE |
20/02/2004 |
|
ADMINISTRATOR |
DE MATOS CARRASCO ANA MARIA |
20/02/2004 |
|
ADMINISTRATOR |
CARRASCO DONAIRE MANUELA |
20/02/2004 |
CREDIT INFORMATION
Constitution Date: 19/05/1999
Business activity 
Activity: Retail sale in specialized stores
NACE Code: 5248
NACE Activity: Other retail sale
in specialized stores
Business: LA VENTA, ALQUILER
Y DISTRIBUCION DE PRODUCTOS RELATIVOS A LA MINERIA Y CONSTRUCCION.
Employees 
Number of total employees: 1 (2004)
Number of fixed employees: 100,00%
Number of temporary employees: 0,00%
LEGAL STRUCTURE
Constitution Data
Register Date: 19/05/1999
Register town: Lugo
Announcement number: 402313
Legal form: LIMITED LIABILITY
COMPANY
Social Capital: 36.061 €
Current structure data 
Current Legal Form: LIMITED LIABILITY
COMPANY
Current Capital: 36.061,00 €
Legal Aspects
Obligation to fill in Financial
Statements: YES
Chamber census: YES (2006)
Listed on a Stock Exchange: NO
B.O.R.M.E.(Official Companies
Registry Gazette) 
Registered Proceedings
|
PROCEEDINGS |
DATE |
NOTICE NUM. |
TRADE REG. |
|
Resignations |
20/02/2004 |
91697 |
Lugo |
Other Proceedings published
|
PROCEEDINGS |
DATE |
NOTICE NUM. |
TRADE REG. |
|
Registration of accounts (2006) Individual |
14/08/2007 |
277640 |
Lugo |
|
Registration of accounts (2005) Individual |
11/10/2006 |
710042 |
Lugo |
|
Registration of accounts (2004) Individual |
13/09/2005 |
383889 |
Lugo |
|
Registration of accounts (2003) Individual |
31/08/2004 |
286371 |
Lugo |
FINANCIAL INFORMATION
The information on the last account contained in this report is
extracted from the Mercantile Register file of the legal address of the Company
and dated 08/10/2007.
BALANCE SHEET
Assets
Figures given in €
|
|
31/12/2004 (12) |
31/12/2005 (12) |
31/12/2006 (12) |
|
A) DUE FROM SHAREHOLDERS FOR UNCALLED CAPITAL |
|
|
|
|
B) FIXED ASSETS |
36.803,67 |
1.106,67 |
276,67 |
|
I. Incorporation costs |
|
|
|
|
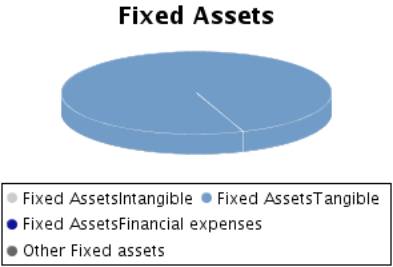
II. Intangible fixed assets |
|
|
|
|
III. Tangible fixed assets |
1.936,67 |
1.106,67 |
276,67 |
|
IV. Financial fixed assets |
34.867,00 |
|
|
|
V.Owners equity |
|
|
|
|
VI.Long term trade liabilities |
|
|
|
|
C) DEFERRED EXPENSES |
|
|
|
|
D) CURRENT ASSETS |
41.748,50 |
61.528,20 |
67.267,49 |
|
I. Shareholders by required outlays |
|
|
|
|
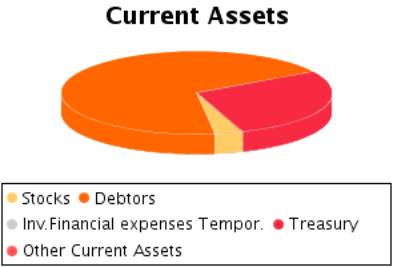
II. Stocks |
3.410,20 |
1.297,32 |
2.301,87 |
|
III. Debtors |
22.073,52 |
39.450,47 |
46.195,40 |
|
IV. Temporary financial investment |
|
|
|
|
V. Short-term own shares |
|
|
|
|
VI. Treasury |
16.264,78 |
20.780,41 |
18.770,22 |
|
VII. Periodification adjustments |
|
|
|
|
ASSETS (A + B + C + D) |
78.552,17 |
62.634,87 |
67.544,16 |
Assets composition
Liabilities
Figures given in €
|
|
31/12/2004 (12) |
31/12/2005 (12) |
31/12/2006 (12) |
|
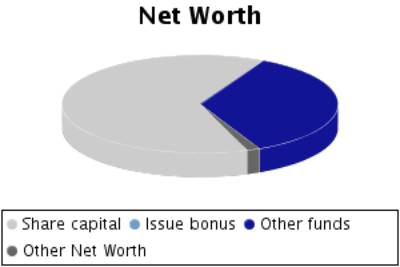
A) SHAREHOLDERS EQUITY |
55.334,39 |
56.181,87 |
57.096,00 |
|
I. Share capital |
36.060,73 |
36.061,00 |
36.061,00 |
|
II. Issue bonus |
|
|
|
|
III.Revaluation reserve |
|
|
|
|
IV.Reserves |
17.293,75 |
19.273,66 |
20.120,87 |
|
Capital adjustments in Euros |
|
|
|
|
Sundry reserves |
17.293,75 |
19.273,66 |
20.120,87 |
|
V.Results from previous years |
-3.659,56 |
|
|
|
VI.Profit and Losses |
5.639,47 |
847,21 |
914,13 |
|
VII.Dividend paid during the year |
|
|
|
|
VIII.Own shares for capital reduction |
|
|
|
|
B) DEFERRED INCOME |
|
|
|
|
C) PROVISIONS FOR LIABILITIES AND EXPENSES |
|
|
|
|
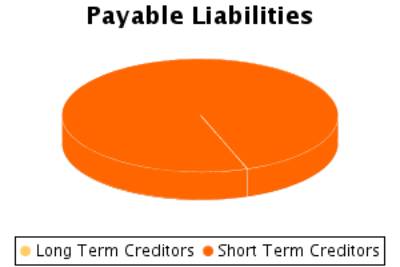
D) LONG TERM LIABILITIES |
|
|
|
|
E) SHORT TERM LIABILITIES |
23.217,78 |
6.453,00 |
10.448,16 |
|
F) SHORT TERM PROVISIONS FOR LIABILITIES AND
EXPENSES |
|
|
|
|
LIABILITIES (A + B + C + D + E + F) |
78.552,17 |
62.634,87 |
67.544,16 |
Liabilities
Composition
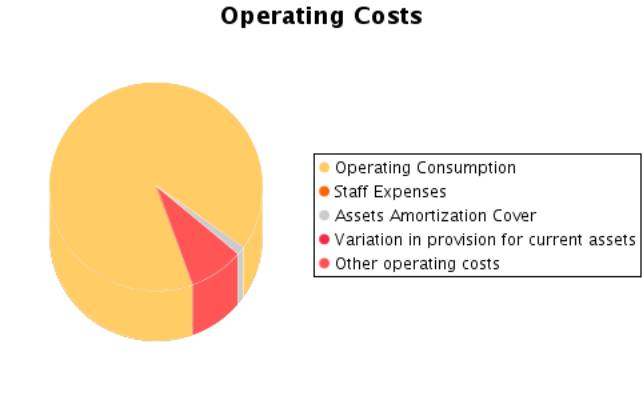
PROFIT AND LOSS ACCOUNT
Itams of the Profit
and Loss Account
Figures given in €
|
|
31/12/2004 (12) |
31/12/2005 (12) |
31/12/2006 (12) |
|
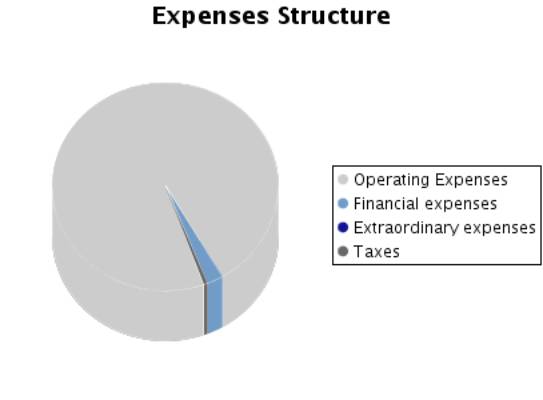
A) EXPENSES (A.1 a A.15) |
24.711,27 |
25.741,48 |
66.789,92 |
|
A.1.Operating costs |
5.964,30 |
19.552,88 |
58.626,75 |
|
A.2. Labour cost |
7.701,32 |
|
|
|
Wages |
5.000,00 |
|
|
|
Social security expenses |
2.701,32 |
|
|
|
A.3. Assets depreciation |
830,00 |
830,00 |
830,00 |
|
A.4. Variation in provision for current assets |
|
|
|
|
A.5. Other operating costs |
7.100,47 |
4.538,31 |
5.397,03 |
|
A.I. OPERATING RESULT (B.1-A.1-A.2-A.3-A.4-A.5) |
8.687,51 |
|
2.850,27 |
|
A.6.Financial expenses and similar |
2.266,65 |
457,20 |
1.544,37 |
|
Debts with related companies |
|
|
|
|
Debts with associated companies |
|
|
|
|
By debts with third parties and similar expenses |
2.266,65 |
457,20 |
1.544,37 |
|
Losses from financial investments |
|
|
|
|
A.7. Variation in financial investment provision |
|
|
|
|
A.8.Negative exchange difference |
|
|
|
|
A.II.POSITIVE FINANCIAL RESULTS
(B.2+B.3-A.6-A.7-A.8) |
|
1.331,49 |
|
|
A.III.PROFIT FROM ORDINARY ACTIVITIES
(A.I+A.II-B.I-B.II) |
6.488,00 |
1.210,30 |
1.305,90 |
|
A.9. Variation in provision in fixed assets |
|
|
|
|
A.10. Losses in fixed assets |
|
|
|
|
A.11. Losses from own shares and bonds |
|
|
|
|
A.12. Extraordinary charges |
|
|
|
|
A.13.Other exercises’ expenses and losses |
|
|
|
|
A.IV.POSITIVE EXTRAORDINARY RESULT (B.4+B.5+B.6+B.7+B.8-A.9-A.10-A.11-A.12-A.13) |
|
|
|
|
A.V.PROFIT BEFORE TAXES (A.III+A.IV-B.III-B.IV) |
6.488,00 |
1.210,30 |
1.305,90 |
|
A.14.Corporate Taxes |
848,53 |
363,09 |
391,77 |
|
A.15. Other taxes |
|
|
|
|
A.VI.EXERCISE RESULT (PROFIT) (A.V-A.14-A.15) |
5.639,47 |
847,21 |
914,13 |
|
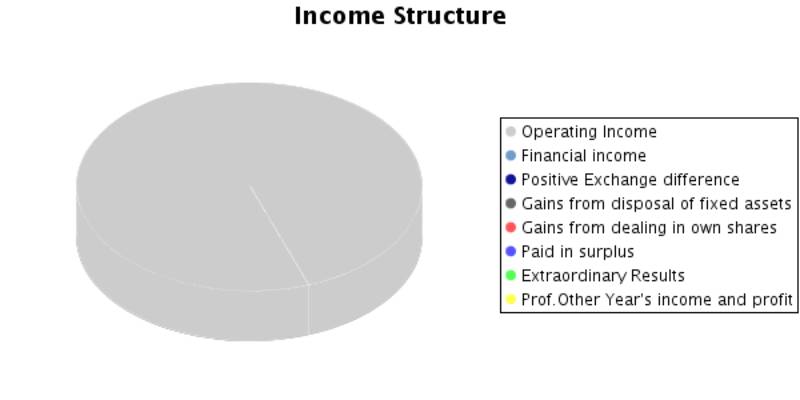
B) INCOMES (B.1 a B.8) |
30.350,74 |
26.588,69 |
67.704,05 |
|
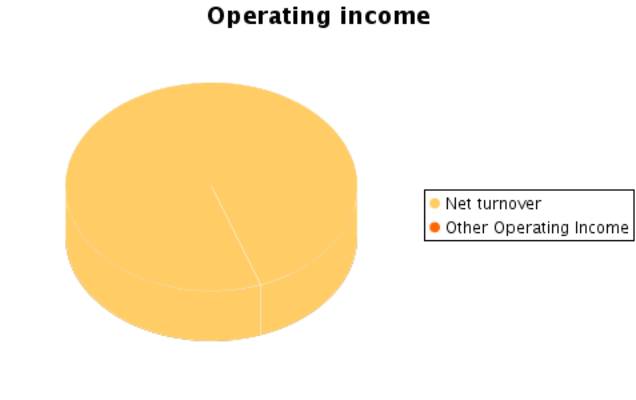
B.1.Operating income |
30.283,60 |
24.800,00 |
67.704,05 |
|
Turnover |
30.283,60 |
24.800,00 |
67.704,05 |
|
Other operating income |
|
|
|
|
B.I.OPERATING LOSSES (A.1+A.2+A.3+A.4+A.5-B.1) |
|
121,19 |
|
|
B.2.Financial Income |
67,14 |
1.788,69 |
|
|
From affiliated companies |
|
|
|
|
From associated companies |
|
|
|
|
Other |
67,14 |
1.788,69 |
|
|
Gains from investments |
|
|
|
|
B.3. Positive change difference |
|
|
|
|
B.II. NEGATIVE FINANCIAL RESULTS
(A.6+A.7+A.8-B.2-B.3) |
2.199,51 |
|
1.544,37 |
|
B.III.LOSSES FROM ORDINARY ACTIVITIES
(B.I+B.II-A.I-A.II) |
|
|
|
|
B.4.B.9. Gains from disposal of fixed assets |
|
|
|
|
B.5.Gains from dealing in own shares |
|
|
|
|
B.6. Paid in surplus |
|
|
|
|
B.7. Extraordinary income |
|
|
|
|
B.8.Other year’s income and profits |
|
|
|
|
B.IV.NEGATIVE EXTRAORDINARY LOSSES
(A.9+A.10+A.11+A.12+A.13-B.4-B.5-B.6-B.7-B.8) |
|
|
|
|
B.V.LOSS BEFORE TAXES (B.III+B.IV-A.III-A.IV) |
|
|
|
|
B.VI.EXERCISE RESULTS (LOSS) (B.V+A.14+A.15) |
|
|
|
Composition of the
Profit and Loss Account
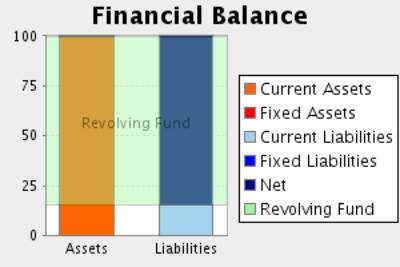
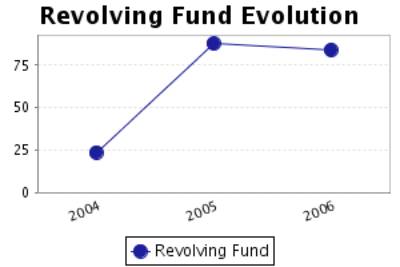
FINANCIAL BALANCE
Here the Main Capital Amounts of the company and the Revolving Fund
Evolution are analysed.
Financial Balance
Table
Figures given in €
|
|
31/12/2004 (12) |
% |
31/12/2005 (12) |
% |
31/12/2006 (12) |
% |
|
A) DUE FROM SHAREHOLDERS FOR UNCALLED CAPITAL |
|
|
|
|
|
|
|
B) FIXED ASSETS |
36.803,67 |
46,85 |
1.106,67 |
1,77 |
276,67 |
0,41 |
|
C) DEFERRED EXPENSES |
|
|
|
|
|
|
|
D) CURRENT ASSETS |
41.748,50 |
53,15 |
61.528,20 |
98,23 |
67.267,49 |
99,59 |
|
ASSETS (A + B + C + D) |
78.552,17 |
|
62.634,87 |
|
67.544,16 |
|
|
|
||||||
|
A) SHAREHOLDERS EQUITY |
55.334,39 |
70,44 |
56.181,87 |
89,70 |
57.096,00 |
84,53 |
|
B) DEFERRED INCOME |
|
|
|
|
|
|
|
C) PROVISIONS FOR LIABILITIES AND EXPENSES |
|
|
|
|
|
|
|
D) LONG TERM LIABILITIES |
|
|
|
|
|
|
|
E) SHORT TERM LIABILITIES |
23.217,78 |
29,56 |
6.453,00 |
10,30 |
10.448,16 |
15,47 |
|
F) SHORT TERM PROVISIONS FOR LIABILITIES AND EXPENSES |
|
|
|
|
|
|
|
LIABILITIES (A + B + C + D + E + F) |
78.552,17 |
|
62.634,87 |
|
67.544,16 |
|
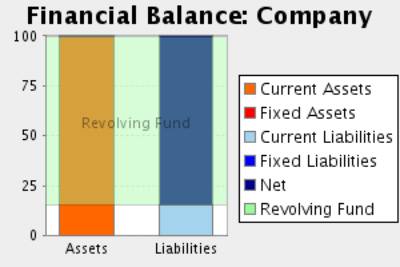
Financial Balance
Composition
Comments on Financial
Balance
In the 2004, the assets of the company were formed in 46,85% of Fixed
Assets and in 53,15% of Current Assets.This assets were financed in 70,44% with
own capitals and in 29,56% with current liabilities.
The result of this financial structure is a positive turnover fund of
18.530,72 Euros, which is equivalent to 23,59% proportion of the
company’s total assets.
In the 2005, the assets of the company were formed in 1,77% of Fixed
Assets and in 98,23% of Current Assets.This assets were financed in 89,70% with
own capitals and in 10,30% with current liabilities.
The result of this financial structure is a positive turnover fund of
55.075,20 Euros, which is equivalent to 87,93% proportion of the
company’s total assets.
This measure has increased with respect to the previous exercise in
197,21% having also increased its proportion with respect to the total assets
of the company.
In the 2006, the assets of the company were formed in 0,41% of Fixed
Assets and in 99,59% of Current Assets.This assets were financed in 84,53% with
own capitals and in 15,47% with current liabilities.
The result of this financial structure is a positive turnover fund of
56.819,33 Euros, which is equivalent to 84,12% proportion of the company’s
total assets.
This measure has increased with respect to the previous exercise in
3,17% having, however, diminished its proportion with respect to the total
assets of the company.
RATIOS
Main Ratios
|
|
31/12/2004 (12) |
31/12/2005 (12) |
31/12/2006 (12) |
|
STRUCTURAL RATIOS |
|
|
|
|
Management fund |
18.530,72 |
55.075,20 |
56.819,33 |
|
Indebtedness (%) |
29,56 |
10,30 |
15,47 |
|
External Funds on Net Worth |
0,42 |
0,12 |
0,18 |
|
GENERAL ACTIVITY RATIO |
|
|
|
|
Turnover Increase (%) |
-73,76 |
-18,11 |
173,00 |
|
Added value growth (%) |
143,17 |
-95,88 |
419,22 |
|
Cash Flow |
6.469,47 |
1.677,21 |
1.744,13 |
|
Labour Productivity |
2,24 |
|
|
|
Assets turnover |
0,39 |
0,40 |
1,00 |
|
Breakdown Point |
19.465,48 |
25.372,79 |
46.445,00 |
|
Security Margin of the Breakdown Point (%) |
35,72 |
-2,31 |
31,40 |
|
ACTIVITY RATIOS |
|
|
|
|
Average Collection Period |
262 |
573 |
246 |
|
Inventory Turnover Period |
41 |
19 |
12 |
|
SOLVENCY RATIOS |
|
|
|
|
Payback Capacity |
0,28 |
0,26 |
0,17 |
|
Assets Guarantee |
3,38 |
9,71 |
6,46 |
|
Short Term Debts Proportion (%) |
100,00 |
100,00 |
100,00 |
|
Interest Coverage |
2,82 |
-0,24 |
1,13 |
|
LIQUIDITY RATIOS |
|
|
|
|
Current Ratio |
1,80 |
9,54 |
6,44 |
|
Immediate liquidity |
0,70 |
3,22 |
1,80 |
|
Sales on Current Assets |
261 |
145 |
362 |
Results Analysis
Ratios
|
|
31/12/2004 (12) |
31/12/2005 (12) |
31/12/2006 (12) |
|
Economic profitability (%) |
11,06 |
-0,19 |
4,22 |
|
Operating Profitability (%) |
28,69 |
-0,49 |
4,21 |
|
Equity gearing |
1,06 |
-11,13 |
0,54 |
|
Financial profitability (%) |
10,19 |
1,51 |
1,60 |
|
General Profitability (%) |
18,62 |
3,42 |
1,35 |
Comments on the
Results Analysis Ratios
The economic profitability in the year2005The economic profitability in
the year -0,19%, derived from a negative operating profitability of -0,49%.The
assets turnover was 0,40%.
The economic profitability in the year from a positive level of 11,06% to
its current negative level. This evolution is due to the obtaining of a
negative operating profitability of -0,49% in comparison with the current
positive value of 28,69%. Assets turnover has maintained stable in this period,
with an index of 0,40%.
Financial profitability on 2005 achieved a 1,51%.
The company’s financial structure has favoured its profitability with an
indebtedness level of -11,13.
The general profitability on 2005 achieved a 3,42%.
The economic profitability in the year2006 achieved a 4,22% positive
level, due to a 4,21% economic margin and to an assets turnover of1,00%.
The economic profitability in the year has passed from a negative level
of -0,19% to its positive current value. This evolution is due to the obtaining
of positive operating profitability of 4,21% in comparison with the previous
negative level of -0,49%. Assets turnover has maintained stable in this period,
with an index of 1,00%.
Financial profitability on 2006 achieved a 1,60%.
The company’s financial structure has limited its profitability with an
indebtedness level of 0,54.
The general profitability on 2006 achieved a 1,35%.
SECTORIAL ANÁLYSIS
Large Capital Amounts
and Financial Balance
Figures given in %
|
|
COMPANY (2006) |
SECTOR |
DIFFERENCE |
DIFFERENCE RELATIVE |
|
|
|
|
|
|
ASSETS |
|
|
|
|
|
|
|
|
|
|
A) DUE FROM
SHAREHOLDERS FOR UNCALLED CAPITAL |
|
0,09 |
|
|
|
|
|
|
|
|
B) FIXED ASSETS |
0,41 |
34,52 |
-34,12 |
-98,81 |
|
|
|
|
|
|
C) DEFERRED
EXPENSES |
|
0,44 |
|
|
|
|
|
|
|
|
D) CURRENT
ASSETS |
99,59 |
64,94 |
34,65 |
53,35 |
|
|
|
|
|
|
ASSETS (A + B +
C + D) |
100 |
100 |
|
|
|
|
|
|
|
|
|
|
|
|
|
|
|
|
|
|
|
|
COMPANY (2006) |
SECTOR |
DIFFERENCE |
DIFFERENCE RELATIVE |
|
|
|
|
|
|
LIABILITIES |
|
|
|
|
|
|
|
|
|
|
A) SHAREHOLDERS
EQUITY |
84,53 |
36,15 |
48,38 |
133,85 |
|
|
|
|
|
|
B) DEFERRED INCOME |
|
0,28 |
|
|
|
|
|
|
|
|
C) PROVISIONS
FOR LIABILITIES AND EXPENSES |
|
0,08 |
|
|
|
|
|
|
|
|
D) LONG TERM
LIABILITIES |
|
16,22 |
|
|
|
|
|
|
|
|
E) SHORT TERM
LIABILITIES |
15,47 |
47,24 |
-31,77 |
-67,25 |
|
|
|
|
|
|
F) SHORT TERM
PROVISIONS FOR LIABILITIES AND EXPENSES |
|
0,03 |
|
|
|
|
|
|
|
|
LIABILITIES (A + B + C + D + E + F) |
100 |
100 |
|
|
|
|
|
|
|
Financial Balance Composition
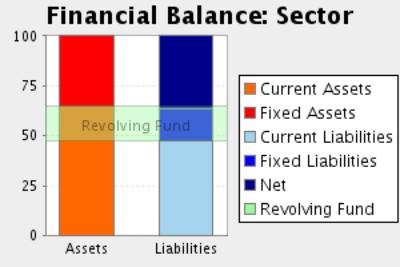
Comments to the
Sectorial Analysis
In the 2006, the assets of the company were formed in 0,41% of fixed
assets and in 99,59Current Assets % In the sector, the proportion of fixed
assets was of 35,06%, 98,83% superior, and the proportion of current assets was
of 64,94%, 53,35% inferior.
The assets were financed in the company in 84,53% with own capitals and
in 15,47% with current liabilities In the sector, the self financing
represented 36,42%, 132,08% inferior. On the other hand the long term debts
represented in the sector an average of 47,27% financing, with a relative
difference of 67,28% favourable to the sector
The result of this company’s financial structure is a turnover fund that
represents 84,12% of the total assets; in the sector, this same proportion is
17,67%, therefore, we can say that the company’s turnover fund is 376,06%
higher than the one in of the sector.
Analytical Account of Results
Figures given in %
|
|
COMPANY (2006) |
SECTOR |
DIFFERENCE |
DIFFERENCE RELATIVE |
|
Turnover |
100,00 |
98,56 |
1,44 |
1,47 |
|
Other operating income |
|
1,44 |
|
|
|
Production Value |
100,00 |
100,00 |
0,00 |
0,00 |
|
Operating expenses |
86,59 |
65,98 |
20,61 |
31,23 |
|
Other operation expenses |
7,97 |
11,71 |
-3,74 |
-31,92 |
|
Added value |
5,44 |
22,31 |
-16,87 |
-75,62 |
|
Labour cost |
|
16,94 |
|
|
|
Gross Economic Result |
5,44 |
5,38 |
0,06 |
1,19 |
|
Assets depreciation |
1,23 |
1,95 |
-0,72 |
-36,79 |
|
Variation in provision for current assets and bad debt losses |
|
0,08 |
|
|
|
Net Economic Result |
4,21 |
3,35 |
0,86 |
25,67 |
|
Financial income |
|
0,27 |
|
|
|
Financial Charges |
2,28 |
1,02 |
1,26 |
122,66 |
|
Variation in financial investment provision |
|
-0,01 |
|
|
|
Ordinary
Activities Result |
1,93 |
2,60 |
-0,68 |
-25,91 |
|
Extraordinary income |
|
0,65 |
|
|
|
Extraordinary charges |
|
0,18 |
|
|
|
Variation in provision in fixed assets |
|
0,00 |
|
|
|
Results before Taxes |
1,93 |
3,07 |
-1,14 |
-37,11 |
|
Corporate taxes |
0,58 |
0,87 |
-0,29 |
-33,18 |
|
Net Result |
1,35 |
2,20 |
-0,85 |
-38,66 |
|
Assets depreciation |
1,23 |
1,95 |
-0,72 |
-36,79 |
|
Change of Provisions |
|
0,08 |
|
|
|
Net Self-Financing |
2,58 |
4,22 |
-1,64 |
-38,89 |
Main Ratios
|
|
COMPANY (2006) |
PTILE25 |
PTILE50 |
PTILE75 |
|
STRUCTURAL RATIOS |
|
|
|
|
|
Management fund |
56.819,33 |
2,39 |
38,76 |
122,00 |
|
Indebtedness (%) |
15,47 |
51,81 |
72,24 |
85,56 |
|
External Funds on Net Worth |
0,18 |
1,08 |
2,60 |
5,92 |
|
GENERAL ACTIVITY RATIO |
|
|
|
|
|
Turnover Increase (%) |
173,00 |
-7,40 |
2,02 |
12,48 |
|
Added value growth (%) |
419,22 |
-6,86 |
3,92 |
16,01 |
|
Cash Flow |
1.744,13 |
5,65 |
14,32 |
33,59 |
|
Assets turnover |
1,00 |
0,99 |
1,54 |
2,25 |
|
Breakdown Point |
46.445,00 |
212.942,14 |
423.543,09 |
825.409,54 |
|
Security Margin of the Breakdown Point (%) |
31,40 |
3,20 |
7,60 |
14,15 |
|
ACTIVITY RATIOS |
|
|
|
|
|
Average Collection Period |
246 |
4 |
25 |
69 |
|
Inventory Turnover Period |
12 |
31 |
75 |
147 |
|
SOLVENCY RATIOS |
|
|
|
|
|
Payback Capacity |
0,17 |
0,04 |
0,07 |
0,15 |
|
Assets Guarantee |
6,46 |
1,16 |
1,37 |
1,92 |
|
Short Term Debts Proportion (%) |
100,00 |
67,13 |
92,30 |
100,00 |
|
Interest Coverage |
1,13 |
1,28 |
3,91 |
12,88 |
|
LIQUIDITY RATIOS |
|
|
|
|
|
Current Ratio |
6,44 |
1,02 |
1,30 |
1,92 |
|
Immediate liquidity |
1,80 |
0,04 |
0,17 |
0,50 |
|
Sales on Current Assets |
362 |
525 |
811 |
1.192 |
Results Analysis
Ratios
|
|
COMPANY (2006) |
PTILE25 |
PTILE50 |
PTILE75 |
|
Economic profitability (%) |
4,22 |
1,59 |
3,77 |
7,18 |
|
Operating Profitability (%) |
4,21 |
1,04 |
2,50 |
4,84 |
|
Equity gearing |
0,54 |
1,42 |
2,40 |
4,58 |
|
Financial profitability (%) |
1,60 |
2,81 |
7,77 |
16,55 |
|
General Profitability (%) |
1,35 |
0,47 |
1,24 |
2,82 |
NOTES
BLOQUE DE INVESTIGACION:
- Tfno. movil de contacto: 609102020.
ABOUT YOUR REQUEST:
Contacted by telephone on the 982231002,
property of consultant’s office of the subject, which only confirms the registered address (
in Porriño, Pontevedra), and refuses to provide us with further information. In
spite of investigations using every source available (public and private), no
additional details than those contained in this report are available. .
ADDITIONA
RATING
EXPLANATIONS
|
RATING |
STATUS |
PROPOSED CREDIT LINE |
|
|
>86 |
Aaa |
Possesses an extremely sound financial base with the strongest
capability for timely payment of interest and principal sums |
Unlimited |
|
71-85 |
Aa |
Possesses adequate working capital. No caution needed for credit
transaction. It has above average (strong) capability for payment of interest
and principal sums |
Large |
|
56-70 |
A |
Financial & operational base are regarded healthy. General unfavourable
factors will not cause fatal effect. Satisfactory capability for payment of
interest and principal sums |
Fairly Large |
|
41-55 |
Ba |
Overall operation is considered normal. Capable to meet normal
commitments. |
Satisfactory |
|
26-40 |
B |
Unfavourable & favourable factors carry similar weight in credit
consideration. Capability to overcome financial difficulties seems
comparatively below average. |
Small |
|
11-25 |
Ca |
Adverse factors are apparent. Repayment of interest and principal sums
in default or expected to be in default upon maturity |
Limited with
full security |
|
<10 |
C |
Absolute credit risk exists. Caution needed to be exercised |
Credit not
recommended |
|
NR |
In view of the lack of information, we have no basis upon which to
recommend credit dealings |
No Rating |
|
This score serves as a reference to assess SC’s credit risk
and to set the amount of credit to be extended. It is calculated from a composite
of weighted scores obtained from each of the major sections of this report. The
assessed factors and their relative weights (as indicated through %) are as
follows:
Financial
condition (40%) Ownership
background (20%) Payment
record (10%)
Credit history
(10%) Market trend
(10%) Operational
size (10%)