![]()
MIRA
INFORM REPORT
|
Report Date : |
20.05.2008 |
IDENTIFICATION
DETAILS
|
Name : |
DANA AUTOMOCION SA |
|
|
|
|
Registered Office : |
Street Calle
E (Pol Industrial Landaben), Cp 31012, Pamplona / Iruna Navarra |
|
|
|
|
Country : |
Spain |
|
|
|
|
Financials (as on) : |
31.12.2005 |
|
|
|
|
Date of Incorporation : |
|
|
|
|
|
Legal Form : |
Joint Stock Company |
|
|
|
|
Line of Business : |
Manufacturer
of Parts and Acces. for Automobiles and their Engines |
RATING &
COMMENTS
|
MIRA’s Rating : |
Ba |
|
RATING |
STATUS |
PROPOSED CREDIT LINE |
|
|
41-55 |
Ba |
Overall operation is considered normal. Capable to meet normal
commitments. |
Satisfactory |
|
Maximum Credit Limit : |
2.300.001,20 € |
|
|
|
|
Status : |
Satisfactory |
|
|
|
|
Payment Behaviour : |
No Complaints |
|
|
|
|
Litigation : |
Clear |
FINANCIAL
REPORT
DANA AUTOMOCION SA
TAX NUMBER: A08930711
EXECUTIVE SUMMARY
Identification
Current Business Name: DANA AUTOMOCION SA
Commercial Name: DANA SPICER HEAVY
AXLE
Other names: YES
Current Address: STREET CALLE
E (POL INDUSTRIAL LANDABEN), CP 31012, PAMPLONA /
IRUNA NAVARRA
Branches: 4
Telephone number: 948289100
Fax: 948188164
URL: www.dana.com
Commercial Risk
Credit Appraisal: 2.300.001,20 €
Legal
Actions: NO
Financial Information
Latest Balance sheet sales (2005): 198.552.000,00 € (MERCANTILE REGISTER)
Result: 2.476.000 €
Total Assets: 145.379.000 €
Social Capital: 19.633.000,00 €
Employees: 1.138
Commercial Information
Constitution Date: 03/08/1984
Business activity: Mfg. of parts
& acces. for automobiles & their engines
NACE Code: 3430
International Operations: Imports and
Exports
Corporate Structure
President:
Parent Company:
Participations: 2
Other Complementary Information
Latest proceeding published in BORME: 06/11/2006 Resignations
Latest press article: 04/03/2006 CINCO
DIAS (INFORMATION ON INSOLVENCY PROCEEDINGS)
Bank Entities: Yes
Credit Appraisal
Maximum Credit (from 0 a 6,000,000 €):
2.300.001,20 €
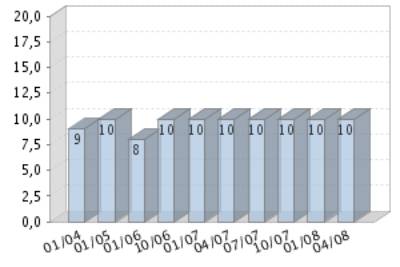
Rating Evolution
Financial Situation
Fiscal year2005
|
Treasury |
Limited |
|
Indebtedness |
Average |
|
Profitability |
Average |
|
Balance |
Degraded |
Performance
|
Legal Actions |
None or Negligible |
|
Business Trajectory |
Excellent |
INCIDENTS

Summary
LEGAL ACTIONS: No legal incidences registered
CLAIM FILED AGAINST THE ADMINISTRATION: No administrative
claims registered
AFFECTED BY:
1 Company / Companies in Insolvency Proceedings.
FINANCIAL ELEMENTS AND SECTORIAL
COMPARATIVE
FINANCIAL ELEMENTS
Figures given in thousands €
|
|
2003 (12) |
2004 (12) |
2005 (12) |
% ASSETS |
|
|
|
|
|
|
BALANCE SHEET ANALYSIS |
|
|
|
|
|
|
|
|
|
|
OWN FUNDS |
35.350,00 |
30.858,00 |
33.247,00 |
22,87 |
|
|
|
|
|
|
DEBT |
117.323,00 |
115.224,00 |
112.132,00 |
77,13 |
|
|
|
|
|
|
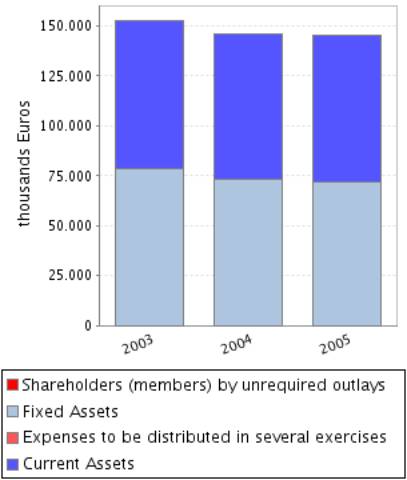
FIXED ASSETS |
78.307,00 |
73.367,00 |
71.698,00 |
49,32 |
|
|
|
|
|
|
TOTAL ASSETS |
152.673,00 |
146.082,00 |
145.379,00 |
|
|
|
|
|
|
|
|
|
|
|
|
|
|
|
|
|
|
|
2003 (12) |
2004 (12) |
2005 (12) |
% SALES |
|
|
|
|
|
|
PROFIT AND LOSS ACCOUNT ANALYSIS |
|
|
|
|
|
|
|
|
|
|
SALES |
163.387,00 |
180.119,00 |
198.552,00 |
|
|
|
|
|
|
|
ADDED VALUE |
52.162,00 |
55.549,00 |
59.947,00 |
30,19 |
|
|
|
|
|
|
EBITDA |
13.209,00 |
12.843,00 |
15.318,00 |
7,71 |
|
|
|
|
|
|
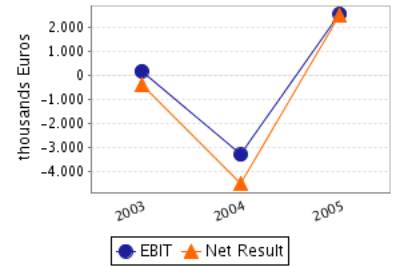
EBIT |
170,00 |
-3.312,00 |
2.553,00 |
1,29 |
|
|
|
|
|
|
NET RESULT |
-395,00 |
-4.521,00 |
2.476,00 |
1,25 |
|
|
|
|
|
Balance Sheets Items
Analysis
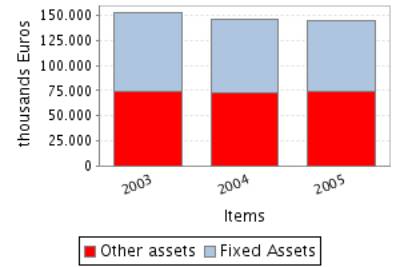
Balance Sheet
Comments
Total assets of the company decreased in 4,32% between 2003 and 2004.
This decrease has been greater in the fixed assets that reduced in
-6,31%.
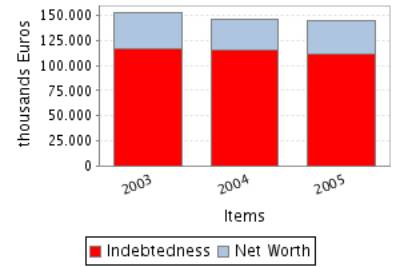
Assets reduction is explained by net worth decrease of12,71and to
indebtedness reduction of 1,79.
Total assets of the company decreased in 0,48% between 2004 and 2005.
This decrease has been greater in the fixed assets that reduced in
-2,27%.
Assets reduction contrasts with net worth growth of 7,74%. Therefore,
the company’s indebtedness has reduced in 2,68%.
Profit and Loss Account Analysis
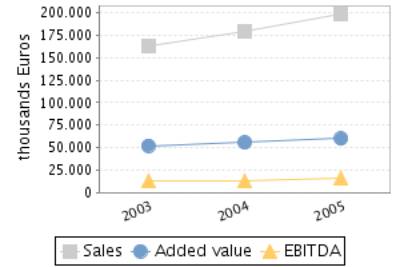
Profit and Loss
Account Comments
The company’s sales figure grew 10,24% between 2003 and 2004.
The company’s EBIT decreased in 2.048,24% between 2003 and 2004.
This evolution implies a reduction in the company’s operating
profitability.
The result of these variations is a decrease of the company’s Economic
Profitability of 2.137,02% in the analysed period, being this profitability of
-2,27% in the year 2004.
The company’s Net Result decreased in 1.044,56% between 2003 and 2004.
This evolution, compared to the EBIT’s performance, implies that the
financial and extraordinary activities have had a positive effect in the
company’s Financial Profitability.
The result of these variations is a reduction of the company’s
profitability of 1.211,17% in the analysed period, being equal to -14,65% in
the year 2004.
The company’s sales figure grew 10,23% between 2004 and 2005.
The company’s EBIT grew 177,08% between 2004 and 2005.
This evolution implies an increase in the company’s operating
profitability.
The result of these variations is an increase of the company’s Economic
Profitability of 177,46% in the analysed period, being this profitability of
1,76% in the year 2005.
The company’s Net Result grew 154,77% between 2004 and 2005.
This evolution, compared to the EBIT’s performance, implies that the
financial and extraordinary activities have had a negative effect in the
company’s Financial Profitability.
The result of these variations is an increase of the company’s Economic
Profitability of 150,83% in the analysed period, being equal to 7,45% in the
year 2005.
ANNUAL FINANCIAL REPORT
ADDITIONAL DATA
Source: annual financial report 2005
Results Distribution
Figures given in €
|
DISTRIBUTION
BASE |
DISTRIBUTION TO |
||
|
Profit and Loss |
2.475.000,00 |
Retained earnings |
248.000,00 |
|
Carry Over |
0,00 |
Voluntary Reserve |
2.227.000,00 |
|
Voluntary reserves |
0,00 |
Prior years losses |
0,00 |
|
Reserves |
0,00 |
Carry Over |
0,00 |
|
Other concepts |
0,00 |
Other funds |
0,00 |
|
Total of Amounts to be distributed |
2.475.000,00 |
Dividends |
0,00 |
|
|
|
Other Applications |
0,00 |
Auditing
Auditors’ opinion: FAVOURABLE WITH RESERVATIONS
Auditor: PRICEWATERHOUSECOOPERS AUDITORES SL
Auditing exceptions:
EN LA REALIZACION DEL INVENTARIO FISICO ANUAL DE 30 DE SEPTIEMBRE DE
2005, EN UNO DE LOS CENTROS PRODUCTIVOS DE LA SOCIEDAD SE DETECTO UNA
DIFERENCIA ENTRE EL INVENTARIO PERMANENTE Y EL INVENTARIO FISICO, QUE ASCENDIO
A 2,2 MILLONES DE EUROS, Y SE PROCEDIO A REFLEJAR EL IMPORTE VALORADO
RESULTANTE DEL INVENTARIO FISICO COMO SU INVENTARIO CONTABLE A AQUELLA FECHA.
SIN EMBARGO Y DEBIDO A QUE NO SE HA EXPLICADO ADECUADAMENTE EL ORIGEN DE ESTA
DIFERENCIA, NO DISPONEMOS DE INFORMACION QUE PERMITA COMPROBAR QUE LAS PARTIDAS
QUE COMPONEN EL SALDO DEL EPIGRAFE DE EXISTENCIAS DEL BALANCE DE SITUACION
ADJUNTO A 31 DE DICIEMBRE DE 2005, ESTAN REGISTRADAS DE PRINCIPIOS Y NORMAS
CONTABLES GENERALMENTE ACEPTADOS.
COMPARATIVE SECTOR ANALYSIS
Values table
Figures expressed in %
|
|
COMPANY (2005) |
SECTOR |
DIFFERENCE |
DIFFERENCE RELATIVE |
|
|
|
|
|
|
BALANCE SHEET ANALYSIS: % on the total
assets |
|
|
|
|
|
|
|
|
|
|
OWN FUNDS |
22,87 |
38,24 |
-15,37 |
-40,19 |
|
|
|
|
|
|
DEBT |
77,13 |
61,76 |
15,37 |
24,88 |
|
|
|
|
|
|
FIXED ASSETS |
49,32 |
48,36 |
0,96 |
1,99 |
|
|
|
|
|
|
|
|
|
|
|
|
|
|
|
|
|
|
COMPANY (2005) |
SECTOR |
DIFFERENCE |
DIFFERENCE RELATIVE |
|
|
|
|
|
|
PROFIT AND LOSS ACCOUNT ANALYSIS: % on the total
operating income |
|
|
|
|
|
|
|
|
|
|
SALES |
98,74 |
98,85 |
-0,10 |
-0,10 |
|
|
|
|
|
|
ADDED VALUE |
29,81 |
22,85 |
6,96 |
30,45 |
|
|
|
|
|
|
EBIT |
1,27 |
3,77 |
-2,50 |
-66,34 |
|
|
|
|
|
|
NET RESULT |
1,23 |
3,88 |
-2,65 |
-68,30 |
|
|
|
|
|
Sector Composition
Compared sector (NACE): 343
Number of companies: 67
Size (Sales Figure) : > 40.000.000,00
Euros
Comments on the
sectorial comparative
Compared to its sector the assets of the companies show a greater
proportion of fixed assets. Specifically the difference with the sector average
is 0,96% , which means a relative difference of 1,99% .
In liabilities composition the company appeals on a wider scale to self
financing, being the proportion of net worth of 15,37% inferior, which means a
relative difference of 40,19% 15,37% more than the sector, which means a
difference of 24,88% .
The proportion that the sales mean to the company’s total ordinary
income is 98,74%, 0,10% lower than in the sector, which means a relative
difference of 0,10% .
The company’s EBIT was positive and was 1,27% with regard to the total
ordinary income, 2,50% less than the sector, which means a relative difference
of 66,34% .
The company’s capacity to generate operating income is equal to that of
the sector as its ratio EBIT/Sales is also equal.
The company’s net result was positive and equal to 1,23% with regard to
the total ordinary income, 2,65% less than the sector, which means a relative
difference of 68,30% .
The financial and extraordinary results and the tax impact have had a
negative impact on the Net result in the company with a worse behaviour than in
the sector; as a consequence, the company shows a worse Net Result/EBIT ratio
(REBEmpresa vs. REBSector).
ADDRESSES
Current Legal Seat Address:
STREET CALLE E (POL INDUSTRIAL LANDABEN)
31012 PAMPLONA / IRUNA NAVARRA
Previous Seat Address:
STREET SANTANDER, 42
08020
BARCELONA
Characteristics
of the current address
Type of premises: office, factory,
warehouse
Property: owned; with no official confirmation
Local Situation: secondary
Branches 
|
STREET |
POSTAL CODE |
TOWN |
PROVINCE |
|
STREET F 59 PG IND MALPICA |
50016 |
ZARAGOZA |
Zaragoza |
|
POLIGONO INDUSTRIAL CHARLUCA POLIGONO POLIGONO
INDUSTRIAL LA CH |
50300 |
CALATAYUD |
Zaragoza |
|
POLIGONO INDUSTRIAL MALPICA POLIGONO POLIGONO
INDUSTRIAL MALPI |
50016 |
ZARAGOZA |
Zaragoza |
|
AVENIDA DEL NOTARI S/N PG IND MASIA DEN FREDERIC |
08800 |
VILANOVA I LA GELTRU |
Barcelona |
4 branches registered
CORPORATE STRUCTURE
ADMINISTRATIVE LINKS
Main Board members,
Directors and Auditor ![]()
|
POSITION |
SURNAMES AND
NAME |
APPOINTMENT DATE |
|
|
PRESIDENT |
JEAN PHILIPPE |
13/06/2006 |
|
|
ADMINISTRATOR |
VON KUNSBERG CORNELIA |
11/02/2004 |
|
|
ADMINISTRATOR |
NOBEL PLASTIQUES IBERICA SA |
11/02/2004 |
|
|
SECRETARY |
GIMENEZ BINDER SERGIO |
16/07/2001 |
|
|
AUDITOR |
APPOINTMENT DATE |
||
|
PRICEWATERHOUSECOOPERS AUDITORES SL |
06/11/2006 |
||
Functional Managers
|
POSITION |
SURNAMES AND
NAME |
|
General Manager |
ZUBIALDE J. |
|
Human Resources Manager |
MURRUZABAL JOAQUIN |
|
Commercial Manager |
EZPELETA JOSE JAVIER |
FINANCIAL LINKS
|
|
BUSINESS NAME |
CIF / COUNTRY |
% |
SOURCE |
DATA INF. |
|
|
DANA CORPORATION |
ESTADOS UNIDOS |
100,00 |
OWN SOURCES |
31/01/2008 |
You can obtain business information of a foreign company at the
pageD&B International
|
|
BUSINESS NAME |
CIF / COUNTRY |
% |
SOURCE |
DATA INF. |
|
|
SPICER AYRA CARDAN S.A. |
A20190658 |
100,00 |
OWN SOURCES |
14/04/2008 |
|
|
SERVICIO MANCOMUNADO DE PREVENCION DE RIESGOS LABORALES VILANOVA AIE. |
G62085832 |
Indet. |
B.O.R.M.E. |
29/05/2007 |
CREDIT INFORMATION
Constitution Date: 03/08/1984
Activity: Mfg. of parts & acces. for automobiles &
their engines
NACE Code: 3430
NACE Activity: Manufacture of parts and accessories for motor
vehicles and their engines
Business: FABRICACION, CONSTRUCCION TRANSFORMACION Y COMERCIO
DE TODO TIPO DE MATERIALES, PRODUCTOS, MAQUINARIA Y UTILLAJE PARA VEHICULOS DE
MOTOR, ASI COMO VENTA, COMERCIO, PRODUCCION, IMPORTACION Y EXPORTACION DE
INSTRUMENTOS DE
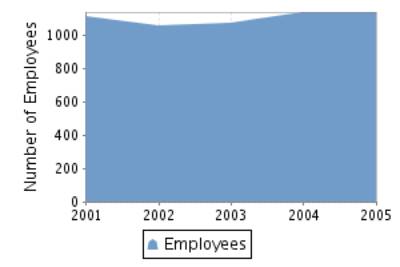
Number of total employees: 1.138 (2008)
Number of fixed employees: 87,70%
Number of temporary employees: 12,30%
Employees evolution
COMMERCIAL OPERATIONS 
SUPPLIERS
|
BUSINESS NAME |
INTERNATIONAL |
|
REINX DICHTUNGS
GMBH |
YES |
|
SEALED POWER
DIVISION |
YES |
|
DANA ITALIA |
YES |
|
DANA KIRSKSTALL |
YES |
|
ECHLIN EUROPE
LTD |
YES |
|
DANA SPICER
EUROPE |
YES |
|
DANA GLASGOW |
YES |
|
DANA HOLDING |
NO |
|
NOBEL PLASTICS
IBERICA SA |
NO |
|
SEALED POWER
EUROPE GMBH |
YES |
28 proveedores
CLIENTS
|
BUSINESS NAME |
INTERNATIONAL |
|
SEALED POWER
EUROPE GMBH |
YES |
|
DANA MEJICO |
YES |
|
THERMOPLAST
ALEMANIA |
YES |
|
DANA HOLDING |
NO |
|
DANA MULHEIM |
YES |
|
DANA HONG KONG |
YES |
|
DANA KIRSTALL |
YES |
|
DANA ARGENTINA |
NO |
|
PERFECT CIRCLE
EUROPE |
YES |
|
DANA KALAMAZOO |
YES |
20 clientes
Banks 
|
ENTITY |
BRANCH |
ADDRESS |
TOWN OR CITY |
PROVINCE |
|
BANCO BILBAO VIZCAYA ARGENTARIA, S.A. |
2357 |
AV. CARLOS III, 33 |
PAMPLONA/IRUÑA |
Navarra |
1 bank entities registered
Brands, Signs and Commercial
Names 
FORMER NAMES:
•
DANA EQUIPAMIENTOS SA
•
SPICER ESPANA SA
Brand name: GLASER (Valid)
Type: JOINT Date: 19/11/1998
Brand name: GLASER CIERREMOTOR (Valid)
Type: DENOMINATIVE Date: 25/03/1998
Brand name: GLASER ...EL ESPECIALISTA DEL MOTOR (Valid)
Type: JOINT Date: 31/01/1997
LEGAL STRUCTURE
Constitution Data
Register Date: 03/08/1984
Current Legal Form: JOINT STOCK
COMPANY
Current Capital:
19.633.000,00 €
Legal Aspects
Obligation to fill in Financial Statements: YES
Chamber census: YES (2006)
Listed on a Stock Exchange: NO
B.O.R.M.E.(Official Companies
Registry Gazette) 
Registered Proceedings
|
PROCEEDINGS |
DATE |
NOTICE NUM. |
TRADE REG. |
|
Resignations |
06/11/2006 |
529203 |
Navarra |
|
Appointments |
06/11/2006 |
529203 |
Navarra |
|
Appointments |
06/11/2006 |
529202 |
Navarra |
|
Re-elections |
06/11/2006 |
529201 |
Navarra |
Other Proceedings published
|
PROCEEDINGS |
DATE |
NOTICE NUM. |
TRADE REG. |
|
Registration of accounts (2005) Individual |
13/09/2006 |
429559 |
Navarra |
Press articles

04/03/2006 CINCO DIAS (INFORMATION ON INSOLVENCY PROCEEDINGS)
EL FABRICANTE ESTADOUNIDENSE DE COMPONENTES DANA CORPORATION SE HA
DECLARADO EN SUSPENSION DE PAGOS. DANA, QUE PRODUCE FRENOS Y EJES, ANUNCIO EL
PASADO OTOÑO UNA REDUCCION DE SUS INGRESOS Y REVISO A LA BAJA SU PREVISION DE
BENEFICIOS PARA EL EJERCICIO 2005 POR UNA SERIE DE ERRORES CONTABLES. LA
EMPRESA CUENTA CON UNA PLANTILLA MUNDIAL DE 46.000 EMPLEADOS Y REGISTRO
PERDIDAS DE 1.300 MM. DE DOLARES EN EL TERCER TRIMESTRE DEL AÑO. EN PRINCIPIO,
ESTA SITUACION NO AFECTARA A EUROPA. EN ESPAÑA LA CIA. CUENTA CON OCHO
INSTALACIONES QUE EMPLEAN A 1.900 TRABAJADORES EN CATALUÑA, NAVARRA, ARAGON Y
PAIS VASCO.
20/11/2005 HERALDO AR (GENERAL INFORMATION)
LA EMPRESA ZARAGOZANA INDUSTRIAS SERVA, INTEGRADA EN LA MULTINACIONAL
NORTEAMERICANA DANA, UBICADA EN EL POLIGONO DE MALPICA, HA VISTO RESPALDADA SU
ACTIVIDAD CON IMPORTANTES INVERSIONES PARA 2005 Y 2006 QUE LLEVARA A UN
INCREMENTO DE LA PRODUCCION. LA INVERSION ES DE 1,5 MM. DE EUROS Y SE TRADUCE
EN LA EXPANSION DE LAS AREAS DE FABRICACION Y ALMACEN EN MAS DE 2.000 METROS
CUADRADOS. EN LA ACTUALIDAD, TRABAJAN EN INDUSTRIAS SERVA 250 PERSONAS Y SERAN
285 COMO CONSECUENCIA DE LA INYECCION ECONOMICA REALIZADA POR DANA. LA FABRICA
CUENTA CON LA CAPACIDAD DE PRODUCIR HASTA 20.000 REFERENCIAS DISTINTAS PARA EL
SELLADO DEL MOTOR, SUMADO 1.500 MAS CON LAS NUEVAS INSTALACIONES
FINANCIAL INFORMATION
The information on the last account contained in this report is
extracted from the Mercantile Register file of the legal address of the Company
and dated 19/09/2006.
BALANCE SHEET
Assets
Figures given in thousands €
|
|
31/12/2003 (12) |
31/12/2004 (12) |
31/12/2005 (12) |
|
A) DUE FROM SHAREHOLDERS FOR UNCALLED CAPITAL |
|
|
|
|
B) FIXED ASSETS |
78.307,00 |
73.367,00 |
71.698,00 |
|
I. Incorporation costs |
|
|
|
|
II. Intangible fixed assets |
7.495,00 |
15.646,00 |
13.196,00 |
|
R & D expenses |
|
|
|
|
Concessions, patents, licences , trademarks |
|
|
|
|
Goodwill |
6.381,00 |
24.010,00 |
24.010,00 |
|
Acquired rights from finance leases |
|
|
|
|
Software |
395,00 |
417,00 |
314,00 |
|
Leasing |
1.803,00 |
1.803,00 |
1.803,00 |
|
Cash advance |
5,00 |
|
|
|
Provisions |
|
|
|
|
Depreciation |
-1.089,00 |
-10.584,00 |
-12.931,00 |
|
III. Tangible fixed assets |
30.097,00 |
25.190,00 |
25.959,00 |
|
Property, plant and equipment |
12.300,00 |
12.305,00 |
12.303,00 |
|
Machinery, equipment and other |
47.878,00 |
47.772,00 |
52.958,00 |
|
Other property plant and equipment |
8.166,00 |
8.750,00 |
7.742,00 |
|
Prepaid expenses on fixed assets |
239,00 |
702,00 |
1.220,00 |
|
Other assets |
1.297,00 |
1.328,00 |
1.260,00 |
|
Provisions |
|
|
|
|
Depreciation |
-39.783,00 |
-45.667,00 |
-49.524,00 |
|
IV. Financial fixed assets |
40.715,00 |
32.531,00 |
32.543,00 |
|
Shares in affiliated companies |
31.414,00 |
31.414,00 |
31.414,00 |
|
Receivables in affiliated companies |
8.208,00 |
|
|
|
Shares in associated companies |
|
|
|
|
Loans to associated companies |
|
|
|
|
Securities |
|
|
|
|
Other loans |
571,00 |
571,00 |
571,00 |
|
Long term deposits and guarantees |
522,00 |
546,00 |
558,00 |
|
Provisions |
|
|
|
|
Taxes receivable |
|
|
|
|
V.Owners equity |
|
|
|
|
VI.Long term trade liabilities |
|
|
|
|
C) DEFERRED EXPENSES |
190,00 |
135,00 |
88,00 |
|
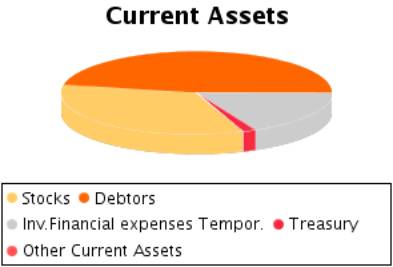
D) CURRENT ASSETS |
74.176,00 |
72.580,00 |
73.593,00 |
|
I. Shareholders by required outlays |
|
|
|
|
II. Stocks |
20.793,00 |
28.247,00 |
24.691,00 |
|
Goods available for sale |
1.122,00 |
1.042,00 |
1.182,00 |
|
Raw material inventory |
8.862,00 |
16.769,00 |
14.982,00 |
|
Work in Progress |
6.208,00 |
4.576,00 |
3.591,00 |
|
Finished goods |
6.568,00 |
8.091,00 |
8.206,00 |
|
Subproducts and recycled materials |
|
|
|
|
Cash advance |
|
|
|
|
Provisions |
-1.967,00 |
-2.231,00 |
-3.270,00 |
|
III. Debtors |
35.486,00 |
33.257,00 |
34.616,00 |
|
Clients |
26.741,00 |
21.299,00 |
23.408,00 |
|
Amounts owned by affiliated companies |
6.732,00 |
10.318,00 |
9.733,00 |
|
Amounts owned by associated companies |
|
|
|
|
Other debts |
1.562,00 |
595,00 |
106,00 |
|
Staff Expenses |
8,00 |
6,00 |
12,00 |
|
Government |
1.011,00 |
1.864,00 |
2.298,00 |
|
Provisions |
-568,00 |
-825,00 |
-941,00 |
|
IV. Temporary financial investment |
16.469,00 |
10.805,00 |
13.064,00 |
|
Shares in affiliated companies |
|
|
|
|
Receivables in affiliated companies |
16.469,00 |
10.788,00 |
3.564,00 |
|
Shares in associated companies |
|
|
|
|
Loans to associated companies |
|
|
|
|
Short term investment |
|
|
|
|
Other loans |
|
17,00 |
|
|
Short Term Deposit and guarantees |
|
|
9.500,00 |
|
Provisions |
|
|
|
|
V. Short-term own shares |
|
|
|
|
VI. Treasury |
1.428,00 |
271,00 |
1.202,00 |
|
VII. Periodification adjustments |
|
|
20,00 |
|
ASSETS (A + B + C + D) |
152.673,00 |
146.082,00 |
145.379,00 |
Assets composition

Liabilities
Figures given in thousands €
|
|
31/12/2003 (12) |
31/12/2004 (12) |
31/12/2005 (12) |
|
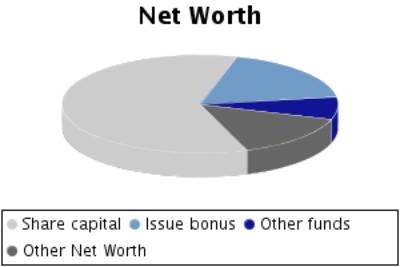
A) SHAREHOLDERS EQUITY |
34.823,00 |
30.302,00 |
32.777,00 |
|
I. Share capital |
19.633,00 |
19.633,00 |
19.633,00 |
|
II. Issue bonus |
6.048,00 |
6.048,00 |
6.048,00 |
|
III.Revaluation reserve |
399,00 |
399,00 |
399,00 |
|
IV.Reserves |
2.362,00 |
2.362,00 |
2.362,00 |
|
Retained earnings |
2.362,00 |
2.362,00 |
2.362,00 |
|
Sinking fund from owner equity |
|
|
|
|
Reserve for the parent company capital |
|
|
|
|
Statutory reserve |
|
|
|
|
Other funds |
|
|
|
|
Capital adjustments in Euros |
|
|
|
|
V.Results from previous years |
6.776,00 |
6.381,00 |
1.859,00 |
|
Carry Over |
6.776,00 |
6.381,00 |
1.859,00 |
|
Prior years losses |
|
|
|
|
Loans from partners for losses compensation |
|
|
|
|
VI.Profit and Losses |
-395,00 |
-4.521,00 |
2.476,00 |
|
VII.Dividend paid during the year |
|
|
|
|
VIII.Own shares for capital reduction |
|
|
|
|
B) DEFERRED INCOME |
527,00 |
556,00 |
470,00 |
|
Capital grants |
527,00 |
556,00 |
470,00 |
|
Positive change difference |
|
|
|
|
Other deferred income |
|
|
|
|
Fiscal deferred income |
|
|
|
|
C) PROVISIONS FOR LIABILITIES AND EXPENSES |
|
|
|
|
Provision for pensions plans |
|
|
|
|
Provision for taxes |
|
|
|
|
Other provisions |
|
|
|
|
Reversion fund |
|
|
|
|
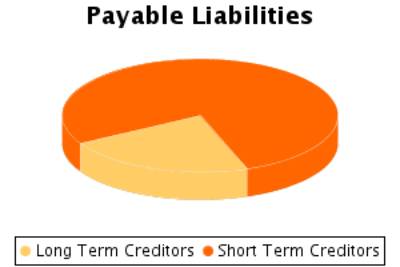
D) LONG TERM LIABILITIES |
24.672,00 |
22.067,00 |
24.034,00 |
|
I.Negotiable bonds and other negotiable values |
|
|
|
|
Non convertible securities |
|
|
|
|
Convertible securities |
|
|
|
|
Other convertible debentures |
|
|
|
|
II.Debt with bank entities |
2.698,00 |
2.140,00 |
2.119,00 |
|
Long term bank loans |
1.571,00 |
1.238,00 |
1.443,00 |
|
Leasing |
1.127,00 |
902,00 |
676,00 |
|
III.Debts with associated and affiliated
companies |
21.851,00 |
19.851,00 |
21.851,00 |
|
With affiliated companies |
21.851,00 |
19.851,00 |
21.851,00 |
|
Associated companies |
|
|
|
|
IV. Other creditors |
123,00 |
76,00 |
64,00 |
|
Bills payable |
|
|
|
|
Other debts |
123,00 |
76,00 |
64,00 |
|
Long term deposit and guaranties |
|
|
|
|
Taxes receivable |
|
|
|
|
V. Deferred debts on shares |
|
|
|
|
From affiliated companies |
|
|
|
|
From associated companies |
|
|
|
|
Other companies |
|
|
|
|
VI. Long term debt with creditor |
|
|
|
|
E) SHORT TERM LIABILITIES |
90.617,00 |
93.157,00 |
83.580,00 |
|
I.Negotiable bonds and other negotiable values |
|
3.514,00 |
|
|
Non convertible securities |
|
|
|
|
Convertible securities |
|
|
|
|
Other convertible debentures |
|
3.514,00 |
|
|
Interests from bonds |
|
|
|
|
II.Debt with bank entities |
4.257,00 |
4.626,00 |
1.162,00 |
|
Loans and other debts |
4.032,00 |
4.401,00 |
937,00 |
|
Debt interest |
|
|
|
|
Leasing |
225,00 |
225,00 |
225,00 |
|
III. Short term debts with associated and
affiliated companies |
51.395,00 |
39.663,00 |
43.269,00 |
|
With affiliated companies |
51.395,00 |
39.663,00 |
43.269,00 |
|
Associated companies |
|
|
|
|
IV. Commercial creditors |
30.440,00 |
40.065,00 |
33.180,00 |
|
Accounts payable |
|
|
|
|
Expenses |
28.692,00 |
38.119,00 |
31.228,00 |
|
Bills payable |
1.748,00 |
1.946,00 |
1.952,00 |
|
V. Other non-commercial debt |
4.525,00 |
5.289,00 |
5.969,00 |
|
Government |
1.637,00 |
2.010,00 |
2.112,00 |
|
Bills payable |
|
|
|
|
Other debts |
12,00 |
8,00 |
|
|
Accounts receivable |
2.876,00 |
3.271,00 |
3.857,00 |
|
Short term deposits and guarantees |
|
|
|
|
VI. Provisions for current assets |
|
|
|
|
VII. Periodification adjustments |
|
|
|
|
F) SHORT TERM PROVISIONS FOR LIABILITIES AND
EXPENSES |
2.034,00 |
|
4.518,00 |
|
LIABILITIES (A + B + C + D + E + F) |
152.673,00 |
146.082,00 |
145.379,00 |
Liabilities
Composition
PROFIT
AND LOSS ACCOUNT
Items of the Profit
and Loss Account
Figures given in thousands €
|
|
31/12/2003 (12) |
31/12/2004 (12) |
31/12/2005 (12) |
|
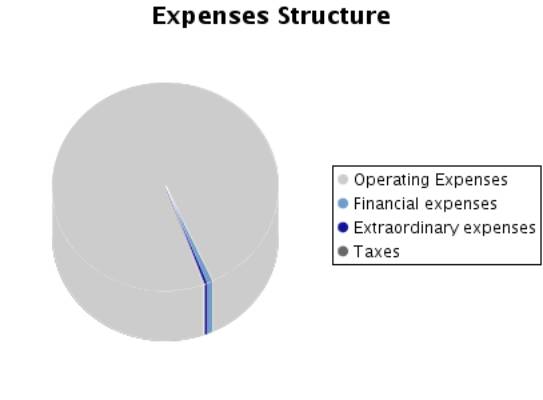
A) EXPENSES (A.1 a A.16) |
168.441,00 |
187.042,00 |
200.157,00 |
|
A.1.Reduction in stocks of finished goods and
work in progress |
|
109,00 |
870,00 |
|
A.2.Supplies |
89.178,00 |
96.272,00 |
108.776,00 |
|
Material consumed |
|
|
|
|
Raw materials consumed |
89.178,00 |
96.272,00 |
108.776,00 |
|
Other expenses |
|
|
|
|
A.3. Labour cost |
38.953,00 |
42.706,00 |
44.629,00 |
|
Wages |
29.417,00 |
32.640,00 |
34.406,00 |
|
Social security expenses |
9.536,00 |
10.066,00 |
10.223,00 |
|
A.4. Assets depreciation |
9.870,00 |
12.473,00 |
8.816,00 |
|
A.5.Variance in the traffic provisions |
3.169,00 |
3.682,00 |
3.949,00 |
|
Variance in provision for inventory |
821,00 |
264,00 |
1.039,00 |
|
Variance in provision for bad debts |
297,00 |
544,00 |
168,00 |
|
Variance in provision for other current assets |
2.051,00 |
2.874,00 |
2.742,00 |
|
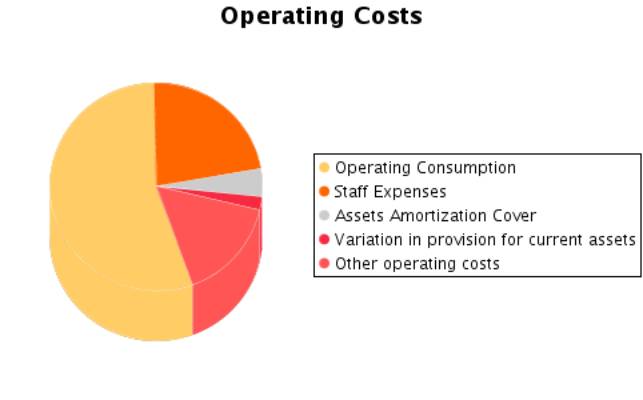
A.6. Other operating costs |
24.992,00 |
29.508,00 |
31.484,00 |
|
External costs |
24.821,00 |
29.324,00 |
31.291,00 |
|
Taxes |
171,00 |
184,00 |
193,00 |
|
Other day to day expenses |
|
|
|
|
Allowance to reversion fund |
|
|
|
|
A.I.OPERATING RESULT
(B.1+B.2+B.3+B.4-A.1-A.2-A.3-A.4-A.5-A.6) |
170,00 |
|
2.553,00 |
|
A.7.Financial expenses and similar |
1.833,00 |
1.944,00 |
1.396,00 |
|
Debts with related companies |
1.561,00 |
|
1.110,00 |
|
Debts with associated companies |
|
1.944,00 |
|
|
By debts with third parties and similar expenses |
272,00 |
|
286,00 |
|
Losses from financial investments |
|
|
|
|
A.8. Variation in financial investment provision |
|
|
|
|
A.9.Negative exchange difference |
258,00 |
|
97,00 |
|
A.II.POSITIVE FINANCIAL RESULTS
(B.5+B.6+B.7+B.8-A.7-A.8-A.9) |
|
|
|
|
A.III.PROFIT FROM ORDINARY ACTIVITIES
(A.I+A.II-B.I-B.II) |
|
|
2.258,00 |
|
A.10. Variation in provision in fixed assets |
|
|
|
|
A.11. Losses in fixed assets |
29,00 |
696,00 |
15,00 |
|
A.12. Losses from own shares and bonds |
|
|
|
|
A.13. Extraordinary charges |
175,00 |
80,00 |
5,00 |
|
A.14.Other exercises’ expenses and losses |
|
|
|
|
A.IV.POSITIVE EXTRAORDINARY RESULT
(B.9+B.10+B.11+B.12+B.13-A.10-A.11-A.12-A.13-A.14) |
298,00 |
|
338,00 |
|
A.V.PROFIT BEFORE TAXES (A.III+A.IV-B.III-B.IV) |
|
|
2.596,00 |
|
A.15.Corporate Taxes |
-16,00 |
-428,00 |
120,00 |
|
A.16. Other taxes |
|
|
|
|
A.VI.EXERCISE RESULT (PROFIT) (A.V-A.14-A.15) |
|
|
2.476,00 |
|
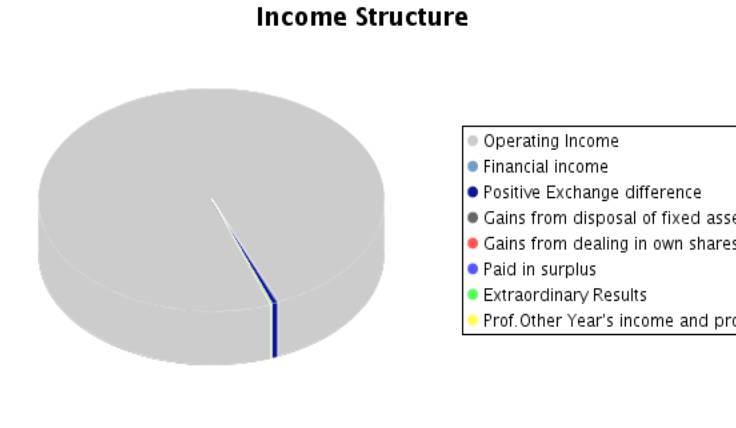
B) INCOMES (B.1 a B13) |
168.046,00 |
182.521,00 |
202.633,00 |
|
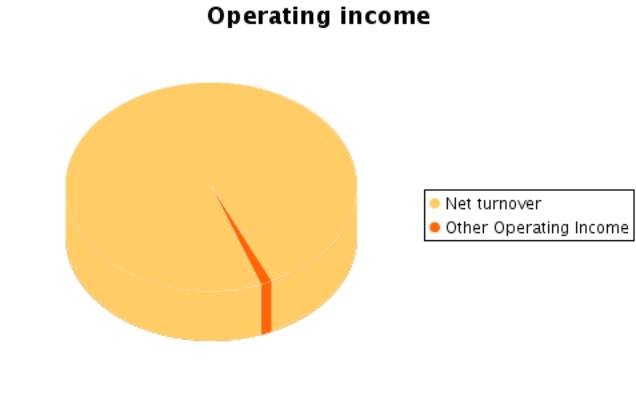
B.1. Turnover |
163.387,00 |
180.119,00 |
198.552,00 |
|
Sales |
164.825,00 |
182.040,00 |
201.725,00 |
|
Services provided |
|
|
|
|
Refunds and sale reminders |
-1.438,00 |
-1.921,00 |
-3.173,00 |
|
B.2.Increase in inventory of finished goods and
works in progress |
1.393,00 |
|
|
|
B.3.Expenses capitalized |
|
|
|
|
B.4. Other operating income |
1.552,00 |
1.319,00 |
2.525,00 |
|
Other incomes |
1.177,00 |
1.207,00 |
2.288,00 |
|
Grants |
375,00 |
112,00 |
237,00 |
|
Excess in provision for liabilities and charges |
|
|
|
|
B.I.OPERATING LOSSES
(A.1+A.2+A.3+A.4+A.5+A.6-B.1-B.2-B.3-B.4) |
|
3.312,00 |
|
|
B.5.Incomes from share participations |
|
|
|
|
From affiliated companies |
|
|
|
|
From associated companies |
|
|
|
|
From other companies |
|
|
|
|
B.6.Income from other securities and credits to
fixed assets |
|
|
|
|
From affiliated companies |
|
|
|
|
From associated companies |
|
|
|
|
Other companies |
|
|
|
|
B.7.Other interests and similar |
338,00 |
443,00 |
221,00 |
|
From affiliated companies |
147,00 |
104,00 |
65,00 |
|
From associated companies |
|
218,00 |
|
|
Other Interests |
191,00 |
121,00 |
156,00 |
|
Profits from investments |
|
|
|
|
B.8. Positive change difference |
874,00 |
|
977,00 |
|
B.II. NEGATIVE FINANCIAL RESULTS
(A.7+A.8+A.9-B.5-B.6-B.7-B.8) |
879,00 |
1.501,00 |
295,00 |
|
B.III.LOSSES FROM ORDINARY ACTIVITIES
(B.I+B.II-A.I-A.II) |
709,00 |
4.813,00 |
|
|
B.9.B.9. Gains from disposal of fixed assets |
85,00 |
13,00 |
41,00 |
|
B.10.Gains from dealing in own shares |
|
|
|
|
B.11. Paid in surplus |
172,00 |
100,00 |
76,00 |
|
B.12. Extraordinary income |
242,00 |
527,00 |
149,00 |
|
B.13.Other year’s income and profits |
3,00 |
|
92,00 |
|
B.IV.NEGATIVE EXTRAORDINARY LOSSES
(A.10+A.11+A.12+A.13+A.14-B.9-B.10-B.11-B.12-B.13) |
|
136,00 |
|
|
B.V.LOSS BEFORE TAXES (B.III+B.IV-A.III-A.IV) |
411,00 |
4.949,00 |
|
|
B.VI.EXERCISE RESULTS (LOSS) (B.V+A.14+A.15) |
395,00 |
4.521,00 |
|
Composition of the
Profit and Loss Account
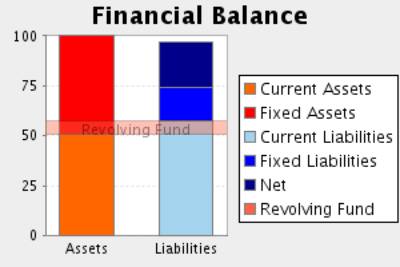
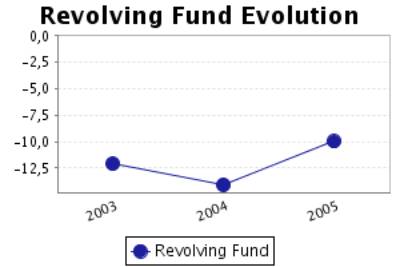
FINANCIAL BALANCE
Here the Main Capital Amounts of the company
and the Revolving Fund Evolution are analysed.
Financial Balance
Table
Figures given in thousands €
|
|
31/12/2003 (12) |
% |
31/12/2004 (12) |
% |
31/12/2005 (12) |
% |
|
A) DUE FROM SHAREHOLDERS FOR UNCALLED CAPITAL |
|
|
|
|
|
|
|
B) FIXED ASSETS |
78.307,00 |
51,29 |
73.367,00 |
50,22 |
71.698,00 |
49,32 |
|
C) DEFERRED EXPENSES |
190,00 |
0,12 |
135,00 |
0,09 |
88,00 |
0,06 |
|
D) CURRENT ASSETS |
74.176,00 |
48,58 |
72.580,00 |
49,68 |
73.593,00 |
50,62 |
|
ASSETS (A + B + C + D) |
152.673,00 |
|
146.082,00 |
|
145.379,00 |
|
|
|
||||||
|
A) SHAREHOLDERS EQUITY |
34.823,00 |
22,81 |
30.302,00 |
20,74 |
32.777,00 |
22,55 |
|
B) DEFERRED INCOME |
527,00 |
0,35 |
556,00 |
0,38 |
470,00 |
0,32 |
|
C) PROVISIONS FOR LIABILITIES AND EXPENSES |
|
|
|
|
|
|
|
D) LONG TERM LIABILITIES |
24.672,00 |
16,16 |
22.067,00 |
15,11 |
24.034,00 |
16,53 |
|
E) SHORT TERM LIABILITIES |
90.617,00 |
59,35 |
93.157,00 |
63,77 |
83.580,00 |
57,49 |
|
F) SHORT TERM PROVISIONS FOR LIABILITIES AND EXPENSES |
2.034,00 |
|
|
|
4.518,00 |
|
|
LIABILITIES (A + B + C + D + E + F) |
152.673,00 |
|
146.082,00 |
|
145.379,00 |
|
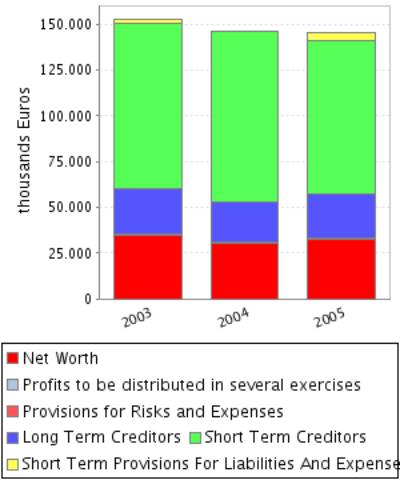
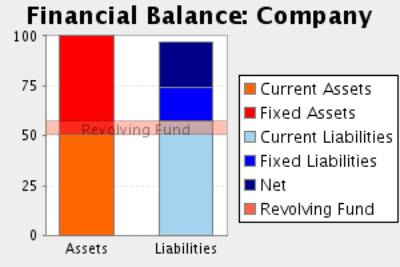
Financial Balance
Composition
Comments on Financial
Balance
In the 2003, the assets of the company were formed in 51,42% of Fixed
Assets and in 48,58% of Current Assets.This assets were financed in 23,15% with
own capitals, and in 16,16% with long term debt and in 60,69% with current
liabilities.
The result of this financial structure is a negative turnover fund of
-18.475,00 thousands Euros, which is equivalent to -12,10% proportion of
the company’s total assets.
In the 2004, the assets of the company were formed in 50,32% of Fixed
Assets and in 49,68% of Current Assets.This assets were financed in 21,12% with
own capitals, and in 15,11% with long term debt and in 63,77% with current
liabilities.
The result of this financial structure is a negative turnover fund of
-20.577,00 thousands Euros, which is equivalent to -14,09% proportion of
the company’s total assets.
This measure has diminished with respect to the previous exercise in
11,38% having also diminished its proportion with respect to the total assets
of the company.
In the 2005, the assets of the company were formed in 49,38% of Fixed
Assets and in 50,62% of Current Assets.This assets were financed in 22,87% with
own capitals, and in 16,53% with long term debt and in 60,60% with current
liabilities.
The result of this financial structure is a negative turnover fund of
-14.505,00 thousands Euros, which is equivalent to -9,98% proportion of
the company’s total assets.
This measure has increased with respect to the previous exercise in
29,51% having also increased its proportion with respect to the total assets of
the company.
RATIOS
Main Ratios
|
|
31/12/2003 (12) |
31/12/2004 (12) |
31/12/2005 (12) |
|
STRUCTURAL RATIOS |
|
|
|
|
Management fund |
-18.475,00 |
-20.577,00 |
-14.505,00 |
|
Management Fund Requirement |
-32.115,00 |
-30.541,00 |
-27.609,00 |
|
Indebtedness (%) |
76,85 |
78,88 |
77,13 |
|
External Funds on Net Worth |
3,32 |
3,73 |
3,37 |
|
GENERAL ACTIVITY RATIO |
|
|
|
|
Turnover Increase (%) |
22,29 |
10,24 |
10,23 |
|
Added value growth (%) |
9,89 |
6,49 |
7,92 |
|
Cash Flow |
12.644,00 |
11.634,00 |
15.241,00 |
|
Labour Productivity |
1,34 |
1,30 |
1,34 |
|
Assets turnover |
1,07 |
1,23 |
1,37 |
|
Breakdown Point |
164.575,58 |
188.502,94 |
195.462,39 |
|
Security Margin of the Breakdown Point (%) |
0,22 |
-3,89 |
2,79 |
|
ACTIVITY RATIOS |
|
|
|
|
Average Payment Period |
125 |
150 |
109 |
|
Average Collection Period |
78 |
66 |
63 |
|
Inventory Turnover Period |
46 |
56 |
45 |
|
SOLVENCY RATIOS |
|
|
|
|
Payback Capacity |
0,11 |
0,10 |
0,14 |
|
Assets Guarantee |
1,30 |
1,27 |
1,30 |
|
Short Term Debts Proportion (%) |
78,97 |
80,85 |
78,57 |
|
Interest Coverage |
5,20 |
5,43 |
9,80 |
|
LIQUIDITY RATIOS |
|
|
|
|
Current Ratio |
0,80 |
0,78 |
0,84 |
|
Immediate liquidity |
0,19 |
0,12 |
0,16 |
|
Treasury |
13.640,00 |
2.936,00 |
13.104,00 |
|
Sales on Current Assets |
793 |
893 |
971 |
Results Analysis
Ratios
|
|
31/12/2003 (12) |
31/12/2004 (12) |
31/12/2005 (12) |
|
Economic profitability (%) |
0,11 |
-2,27 |
1,76 |
|
Operating Profitability (%) |
0,10 |
-1,84 |
1,29 |
|
Equity gearing |
-18,01 |
6,88 |
3,87 |
|
Financial profitability (%) |
-1,12 |
-14,65 |
7,45 |
|
General Profitability (%) |
-0,24 |
-2,51 |
1,25 |
Comments on the Results Analysis
Ratios
The economic profitability in the year2004The economic profitability in
the year -2,27%, derived from a negative operating profitability of -1,84%.The
assets turnover was 1,23%.
The economic profitability in the year from a positive level of 0,11% to
its current negative level. This evolution is due to the obtaining of a
negative operating profitability of -1,84% in comparison with the current
positive value of 0,10%. Assets turnover has maintained stable in this period,
with an index of 1,23%.
Financial profitability on 2004The economic profitability in the year
-14,65
The company’s financial structure has restrained its financial
profitability with an indebtedness level of 6,88.
The general profitability on 2004The economic profitability in the year
-2,51
The economic profitability in the year2005 achieved a 1,76% positive
level, due to a 1,29% economic margin and to an assets turnover of1,37%.
The economic profitability in the year has passed from a negative level
of -2,27% to its positive current value. This evolution is due to the obtaining
of positive operating profitability of 1,29% in comparison with the previous
negative level of -1,84%. Assets turnover has maintained stable in this period,
with an index of 1,37%.
Financial profitability on 2005 achieved a 7,45%.
The company’s financial structure has instigated its economic
profitability with an indebtedness level of 3,87.
The general profitability on 2005 achieved a 1,25%.
SECTORIAL
ANÁLYSIS
Large Capital Amounts
and Financial Balance
Figures given in %
|
|
COMPANY (2005) |
SECTOR |
DIFFERENCE |
DIFFERENCE RELATIVE |
|
|
|
|
|
|
ASSETS |
|
|
|
|
|
|
|
|
|
|
A) DUE FROM SHAREHOLDERS FOR UNCALLED CAPITAL |
|
0,00 |
|
|
|
|
|
|
|
|
B) FIXED ASSETS |
49,32 |
48,36 |
0,96 |
1,99 |
|
|
|
|
|
|
C) DEFERRED EXPENSES |
0,06 |
0,22 |
-0,16 |
-72,48 |
|
|
|
|
|
|
D) CURRENT ASSETS |
50,62 |
51,42 |
-0,80 |
-1,56 |
|
|
|
|
|
|
ASSETS (A + B + C + D) |
100 |
100 |
|
|
|
|
|
|
|
|
|
|
|
|
|
|
|
|
|
|
|
|
COMPANY (2005) |
SECTOR |
DIFFERENCE |
DIFFERENCE RELATIVE |
|
|
|
|
|
|
LIABILITIES |
|
|
|
|
|
|
|
|
|
|
A) SHAREHOLDERS EQUITY |
22,55 |
36,80 |
-14,25 |
-38,72 |
|
|
|
|
|
|
B) DEFERRED INCOME |
0,32 |
1,44 |
-1,12 |
-77,76 |
|
|
|
|
|
|
C) PROVISIONS FOR LIABILITIES AND EXPENSES |
|
0,71 |
|
|
|
|
|
|
|
|
D) LONG TERM LIABILITIES |
16,53 |
13,81 |
2,72 |
19,72 |
|
|
|
|
|
|
E) SHORT TERM LIABILITIES |
57,49 |
47,04 |
10,45 |
22,21 |
|
|
|
|
|
|
F) SHORT TERM PROVISIONS FOR LIABILITIES AND EXPENSES |
|
0,20 |
|
|
|
|
|
|
|
|
LIABILITIES (A + B + C + D + E + F) |
100 |
100 |
|
|
|
|
|
|
|
Financial Balance
Composition
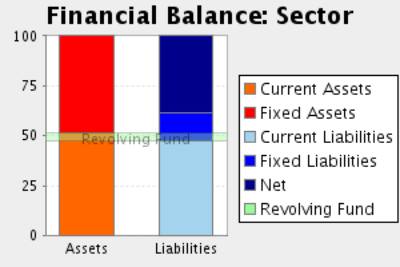
Comments to the
Sectorial Analysis
In the 2005, the assets of the company were formed in 49,38% of fixed
assets and in 50,62Current Assets % In the sector, the proportion of fixed
assets was of 48,58%, 1,66% inferior, and the proportion of current assets was
of 51,42%, 1,56% superior.
The assets were financed in the company in 22,87% with own capitals , in
16,53% with fixed liabilities and in 60,60% with current liabilities In the
sector, the self financing represented 38,24%, 40,19% superior. On the other
hand the long term debts represented in the sector an average of 14,52%
financing, with a relative difference of 13,84% in favour of the companyAnd,
short term liabilities represented in the sector an average of 47,24%
financing, with a relative difference of 28,28% in favour of the company
The result of this company’s financial structure is a turnover fund that
represents -9,98% of the total assets; in the sector, this same proportion is
4,18%, therefore, we can say that the company’s turnover fund is 338,64%
smaller than the sector one.
Analytical Account of
Results
Figures given in %
|
|
COMPANY (2005) |
SECTOR |
DIFFERENCE |
DIFFERENCE RELATIVE |
|
Turnover |
98,74 |
98,85 |
-0,11 |
-0,11 |
|
Other operating income |
1,26 |
1,15 |
0,11 |
9,38 |
|
Production Value |
100,00 |
100,00 |
0,00 |
0,00 |
|
Operating expenses |
54,53 |
66,18 |
-11,65 |
-17,61 |
|
Other operation expenses |
15,66 |
10,96 |
4,70 |
42,86 |
|
Added value |
29,81 |
22,85 |
6,96 |
30,44 |
|
Labour cost |
22,19 |
14,76 |
7,43 |
50,30 |
|
Gross Economic Result |
7,62 |
8,09 |
-0,47 |
-5,80 |
|
Assets depreciation |
4,38 |
3,98 |
0,40 |
10,02 |
|
Variation in provision for current assets and bad debt losses |
1,96 |
0,34 |
1,62 |
483,33 |
|
Net Economic Result |
1,27 |
3,77 |
-2,50 |
-66,33 |
|
Financial income |
0,60 |
2,10 |
-1,50 |
-71,44 |
|
Financial Charges |
0,74 |
1,09 |
-0,35 |
-32,11 |
|
Variation in financial investment provision |
|
-0,12 |
|
|
|
Ordinary Activities Result |
1,12 |
4,90 |
-3,78 |
-77,17 |
|
Extraordinary income |
0,18 |
0,76 |
-0,58 |
-76,16 |
|
Extraordinary charges |
0,01 |
0,72 |
-0,71 |
-98,61 |
|
Variation in provision in fixed assets |
|
0,05 |
|
|
|
Results before Taxes |
1,29 |
4,90 |
-3,61 |
-73,66 |
|
Corporate taxes |
0,06 |
1,01 |
-0,95 |
-94,08 |
|
Net Result |
1,23 |
3,88 |
-2,65 |
-68,33 |
|
Assets depreciation |
4,38 |
3,98 |
0,40 |
10,02 |
|
Change of Provisions |
1,96 |
0,26 |
1,70 |
653,85 |
|
Net Self-Financing |
7,58 |
8,12 |
-0,54 |
-6,71 |
Principales Ratios
|
|
COMPANY (2005) |
PTILE25 |
PTILE50 |
PTILE75 |
|
STRUCTURAL RATIOS |
|
|
|
|
|
Management fund |
-14.505,00 |
-5.168,00 |
2.190,23 |
14.055,44 |
|
Management Fund Requirement |
-27.609,00 |
-14.052,38 |
-3.461,53 |
5.258,77 |
|
Indebtedness (%) |
77,13 |
41,23 |
66,50 |
76,15 |
|
External Funds on Net Worth |
3,37 |
0,70 |
1,98 |
3,19 |
|
GENERAL ACTIVITY RATIO |
|
|
|
|
|
Turnover Increase (%) |
10,23 |
-5,87 |
-0,11 |
9,59 |
|
Added value growth (%) |
7,92 |
-11,60 |
-0,86 |
9,67 |
|
Cash Flow |
15.241,00 |
3.630,46 |
6.733,43 |
11.260,88 |
|
Labour Productivity |
1,34 |
1,30 |
1,57 |
1,96 |
|
Assets turnover |
1,37 |
1,14 |
1,42 |
1,98 |
|
Breakdown Point |
195.462,39 |
49.008.308,00 |
76.406.756,00 |
116.378.976,76 |
|
Security Margin of the Breakdown Point (%) |
2,79 |
3,28 |
8,98 |
18,66 |
|
ACTIVITY RATIOS |
|
|
|
|
|
Average Payment Period |
109 |
54 |
83 |
121 |
|
Average Collection Period |
63 |
53 |
81 |
106 |
|
Inventory Turnover Period |
45 |
12 |
24 |
37 |
|
SOLVENCY RATIOS |
|
|
|
|
|
Payback Capacity |
0,14 |
0,11 |
0,20 |
0,34 |
|
Assets Guarantee |
1,30 |
1,31 |
1,50 |
2,42 |
|
Short Term Debts Proportion (%) |
78,57 |
78,57 |
93,69 |
98,51 |
|
Interest Coverage |
9,80 |
2,97 |
13,00 |
50,98 |
|
LIQUIDITY RATIOS |
|
|
|
|
|
Current Ratio |
0,84 |
0,89 |
1,10 |
1,80 |
|
Immediate liquidity |
0,16 |
0,02 |
0,10 |
0,58 |
|
Treasury |
13.104,00 |
1,43 |
1.259,00 |
10.126,36 |
|
Sales on Current Assets |
971 |
649 |
990 |
1.247 |
Results Analysis
Ratios
|
|
COMPANY (2005) |
PTILE25 |
PTILE50 |
PTILE75 |
|
Economic profitability (%) |
1,76 |
1,76 |
4,02 |
8,98 |
|
Operating Profitability (%) |
1,29 |
1,03 |
2,62 |
6,31 |
|
Equity gearing |
3,87 |
1,56 |
2,40 |
4,05 |
|
Financial profitability (%) |
7,45 |
3,23 |
10,28 |
20,17 |
|
General Profitability (%) |
1,25 |
0,64 |
2,39 |
5,06 |
NOTES
In answer to your request of a Financial
Report on the above-mentioned company,
we inform you that the requested product cannot be processed as the necessary
accounts haven’t been published yet.
Last Accounts published in Borme are those from the exercise: 2005.
Last available report 2005.
RATING
EXPLANATIONS
|
RATING |
STATUS |
PROPOSED CREDIT LINE |
|
|
>86 |
Aaa |
Possesses an extremely sound financial base with the strongest
capability for timely payment of interest and principal sums |
Unlimited |
|
71-85 |
Aa |
Possesses adequate working capital. No caution needed for credit transaction.
It has above average (strong) capability for payment of interest and
principal sums |
Large |
|
56-70 |
A |
Financial & operational base are regarded healthy. General
unfavourable factors will not cause fatal effect. Satisfactory capability for
payment of interest and principal sums |
Fairly Large |
|
41-55 |
Ba |
Overall operation is considered normal. Capable to meet normal
commitments. |
Satisfactory |
|
26-40 |
B |
Unfavourable & favourable factors carry similar weight in credit consideration.
Capability to overcome financial difficulties seems comparatively below
average. |
Small |
|
11-25 |
Ca |
Adverse factors are apparent. Repayment of interest and principal sums
in default or expected to be in default upon maturity |
Limited with
full security |
|
<10 |
C |
Absolute credit risk exists. Caution needed to be exercised |
Credit not
recommended |
|
NR |
In view of the lack of information, we have no basis upon which to
recommend credit dealings |
No Rating |
|
This score serves as a reference to assess SC’s credit risk
and to set the amount of credit to be extended. It is calculated from a
composite of weighted scores obtained from each of the major sections of this
report. The assessed factors and their relative weights (as indicated through
%) are as follows:
Financial
condition (40%) Ownership
background (20%) Payment
record (10%)
Credit history
(10%) Market trend
(10%) Operational
size (10%)