![]()
MIRA INFORM REPORT
|
Report Date : |
31.10.2008 |
IDENTIFICATION
DETAILS
|
Name : |
GRUTALMERIA S.L. |
|
|
|
|
Registered Office : |
|
|
|
|
|
Country : |
Spain |
|
|
|
|
Financials (as on) : |
31.12.2007 |
|
|
|
|
Date of Incorporation : |
|
|
|
|
|
Legal Form : |
Limited Liability Company |
|
|
|
|
Line of Business : |
RATING &
COMMENTS
|
MIRA’s Rating : |
B |
|
RATING |
STATUS |
PROPOSED CREDIT LINE |
|
|
26-40 |
B |
Unfavourable & favourable factors carry similar weight in credit consideration.
Capability to overcome financial difficulties seems comparatively below
average. |
Small |
|
Maximum Credit Limit : |
€ 6,000,000 |
|
|
|
|
Status : |
Moderate |
|
|
|
|
Payment Behaviour : |
No Complaints |
|
|
|
|
Litigation : |
Clear |
name
GRUTALMERIA S.L.
TAX NUMBER: B04403978
EXECUTIVE SUMMARY
Identification
Current Business Name: GRUTALMERIA S.L.
Other names: NO
Current Address: CARRETERA VIATOR-PECHINA KM
2,7, CP 04250, PECHINA ALMERÍA
Telephone number: 902141012
Fax: 950317648
URL: www.grutalmeria.com
Corporate e-mail: grutalmeria@grutalmeria.net
Commercial Risk
Credit Appraisal: 49.884,00 €
RAI: NO
Legal
Actions: NO
Financial Information
Latest Balance sheet sales (2007): 2.760.412,62 € (MERCANTILE REGISTER)
Result: 85.308,18 €
Total Assets: 2.826.360,91 €
Social Capital: 19.000,00 €
Employees: 25
Commercial Information
Constitution Date: 14/01/2002
Business activity: Road goods transit
NACE Code: 6024
International Operations: No business relationships registered
Corporate Structure
Administrator:
Other Complementary Information
Latest proceeding published in BORME: 17/09/2008 Registration
of accounts
Bank Entities: Yes
Credit Appraisal
Maximum Credit
(from 0 a 6,000,000 €)
Favourable to 49.884,00 €
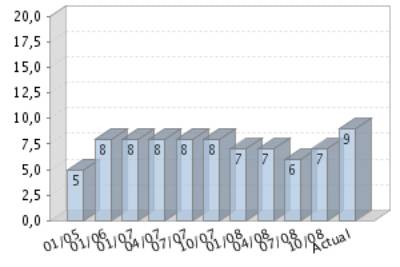
Rating Evolution
Financial Situation
Fiscal year2007
|
Treasury |
Degraded |
|
Indebtedness |
Important |
|
Profitability |
Average |
|
Balance |
Degraded |
Performance
|
Legal Actions |
None or Negligible |
|
Business Trajectory |
Excellent |
RAI 
COMPANY NOT REGISTERED IN THE R.A.I.
This company is not registered in the Disputed Bills register (R.A.I.)
INCIDENTS

Summary
LEGAL ACTIONS: No legal incidences registered
CLAIM FILED AGAINST THE ADMINISTRATION: No administrative
claims registered at D&B, S.A.
AFFECTED BY: No significant element.
FINANCIAL ELEMENTS AND SECTORIAL
COMPARATIVE
FINANCIAL ELEMENTS
Figures given in €
|
|
2005 (12) |
2006 (12) |
2007 (12) |
% ASSETS |
|
BALANCE SHEET ANALYSIS |
|
|
|
|
|
OWN FUNDS |
194.907,11 |
263.295,84 |
348.604,02 |
12,33 |
|
DEBT |
2.057.725,03 |
2.522.227,85 |
2.477.756,89 |
87,67 |
|
FIXED ASSETS |
1.253.339,26 |
1.754.100,05 |
1.526.030,59 |
53,99 |
|
TOTAL ASSETS |
2.252.632,14 |
2.785.523,69 |
2.826.360,91 |
|
|
|
|
|
|
|
|
|
2005 (12) |
2006 (12) |
2007 (12) |
% SALES |
|
PROFIT AND LOSS ACCOUNT ANALYSIS |
|
|
|
|
|
SALES |
2.338.916,51 |
2.408.421,78 |
2.760.412,62 |
|
|
ADDED VALUE |
1.077.838,65 |
1.082.498,66 |
1.339.475,08 |
48,52 |
|
EBITDA |
619.462,36 |
453.115,37 |
639.491,23 |
23,17 |
|
EBIT |
201.408,12 |
-23.310,24 |
114.652,86 |
4,15 |
|
NET RESULT |
104.645,49 |
68.388,73 |
85.308,18 |
3,09 |
Balance Sheets Items Analysis
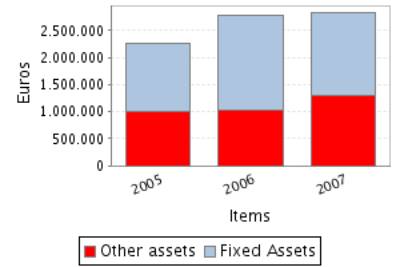
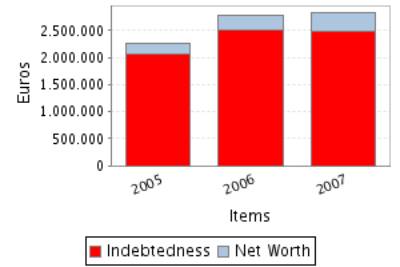
Balance Sheet Comments
Total assets of the company grew 23,66% between 2005 and 2006.
This growth is a consequence of the fixed assets increase of 39,95%.
This growth has been financed, on a wider scale, with a Shareholders’ equity
increase of 35,09% and in a smaller proportion with an debt increase of 22,57%.
Total assets of the company grew 1,47% between 2006 and 2007.
In spite of the assets’ growth, the fixed assets decreased 13,00%.
This growth has been financed with a Shareholders’ equity increase of
32,40% this company’s net increase has also covered the reduction of the
company’s indebtedness of 1,76% of company’s indebtedness.
Profit and Loss Account Analysis
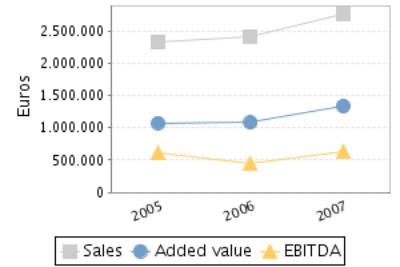
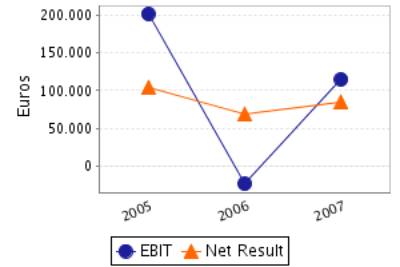
Profit and Loss Account Comments
The company’s sales figure grew 2,97% between 2005 and 2006.
The company’s EBIT decreased in 111,57% between 2005 and 2006.
This evolution implies a reduction in the company’s operating
profitability.
The result of these variations is a decrease of the company’s Economic
Profitability of 109,36% in the analysed period, being this profitability of
-0,84% in the year 2006.
The company’s Net Result decreased in 34,65% between 2005 and 2006.
This evolution, compared to the EBIT’s performance, implies that the
financial and extraordinary activities have had a positive effect in the
company’s Financial Profitability.
The result of these variations is a reduction of the company’s
profitability of 51,62% in the analysed period, being equal to 25,97% in the
year 2006.
The company’s sales figure grew 14,61% between 2006 and 2007.
The company’s EBIT grew 591,86% between 2006 and 2007.
This evolution implies an increase in the company’s operating
profitability.
The result of these variations is an increase of the company’s Economic Profitability
of 584,78% in the analysed period, being this profitability of 4,06% in the
year 2007.
The company’s Net Result grew 24,74% between 2006 and 2007.
This evolution, compared to the EBIT’s performance, implies that the
financial and extraordinary activities have had a negative effect in the
company’s Financial Profitability.
The result of these variations is a reduction of the company’s
profitability of 5,79% in the analysed period, being equal to 24,47% in the
year 2007.
ANNUAL FINANCIAL REPORT
ADDITIONAL DATA
Source: annual financial report 2007
Results Distribution
Figures given in €
|
DISTRIBUTION
BASE |
DISTRIBUTION TO |
||
|
Profit and Loss |
85.308,18 |
Retained earnings |
0,00 |
|
Carry Over |
0,00 |
Voluntary Reserve |
85.308,18 |
|
Voluntary reserves |
0,00 |
Prior years losses |
0,00 |
|
Reserves |
0,00 |
Carry Over |
0,00 |
|
Other concepts |
0,00 |
Other funds |
0,00 |
|
Total of Amounts to be distributed |
85.308,18 |
Dividends |
0,00 |
|
|
|
Other Applications |
0,00 |
COMPARATIVE SECTOR ANALYSIS
Values table
Figures expressed in %
|
|
COMPANY (2007) |
SECTOR |
DIFFERENCE |
DIFFERENCE RELATIVE |
|
BALANCE SHEET ANALYSIS: % on the total
assets |
|
|
|
|
|
OWN FUNDS |
12,33 |
36,26 |
-23,92 |
-65,98 |
|
DEBT |
87,67 |
63,74 |
23,92 |
37,53 |
|
FIXED ASSETS |
53,99 |
53,53 |
0,47 |
0,87 |
|
|
|
|
|
|
|
|
COMPANY (2007) |
SECTOR |
DIFFERENCE |
DIFFERENCE RELATIVE |
|
PROFIT AND LOSS ACCOUNT ANALYSIS: % on the total
operating income |
|
|
|
|
|
SALES |
100,00 |
98,43 |
1,57 |
1,59 |
|
ADDED VALUE |
48,52 |
39,89 |
8,63 |
21,64 |
|
EBIT |
4,15 |
3,19 |
0,96 |
30,08 |
|
NET RESULT |
3,09 |
2,50 |
0,59 |
23,52 |
Sector Composition
Compared sector (NACE): 602
Number of companies: 6504
Size (Sales Figure) : 0 - 2.800.000,00 Euros
Comments on the sectorial
comparative
Compared to its sector the assets of the companies show a greater
proportion of fixed assets. Specifically the difference with the sector average
is 0,47% , which means a relative difference of 0,87% .
In liabilities composition the company appeals on a wider scale to self
financing, being the proportion of net worth of 23,92% inferior, which means a
relative difference of 65,98% 23,92% more than the sector, which means a
difference of 37,53% .
The proportion that the sales mean to the company’s total ordinary
income is 100,00%, 1,57% higher than in the sector, which means a relative
difference of 1,59% .
The company’s EBIT was positive and was 4,15% with regard to the total
ordinary income, 0,96% higher than in the sector, which means a relative
difference of 30,08% .
The company’s capacity to generate operating income is higher than the
one of the sector as its ratio EBIT/Sales is higher (ES Company versus ES
Sector).
The company’s net result was positive and equal to 3,09% with regard to
the total ordinary income, 0,59% higher than in the sector, which means a
relative difference of 23,52% .
The financial and extraordinary results and the tax impact have had a
negative impact on the Net result in the company with a worse behaviour than in
the sector; as a consequence, the company shows a worse Net Result/EBIT ratio
(REBEmpresa vs. REBSector).
ADDRESSES
Current Legal Seat Address:
CARRETERA VIATOR-PECHINA KM 2,7
04250 PECHINA ALMERÍA
Previous Seat Address:
AVENIDA MADRE MARIA AZNAR, 74
04009
ALMERIA ALMERÍA
CORPORATE STRUCTURE
ADMINISTRATIVE LINKS
Main Board members, Directors and Auditor ![]()
|
POSITION |
SURNAMES AND
NAME |
APPOINTMENT DATE |
|
ADMINISTRATOR |
ESPARZA MARTINEZ JUAN |
11/03/2002 |
|
ADMINISTRATOR |
ESPARZA CONESA FRANCISCO MANUEL |
11/03/2002 |
Functional Managers
|
POSITION |
SURNAMES AND
NAME |
|
General Manager |
ESPARZA MARTINEZ JUAN |
|
Financial Manager |
FERNANDEZ RODRIGUEZ FRANCISCO |
|
Commercial Manager |
ESPARTA CONESA FRANCISCO |
FINANCIAL LINKS
|
|
BUSINESS NAME |
CIF / COUNTRY |
% |
SOURCE |
DATA INF. |
|
|
ESPARZA MARTINEZ JUAN |
|
Indet. |
OWN SOURCES |
30/05/2008 |
CREDIT INFORMATION
Constitution Date: 14/01/2002
Business activity 
Code: 1722000
Activity: Road goods transit
NACE Code: 6024
NACE Activity: Freight transport by road
Business: SERVICIOS DE GRUAS MECANICAS. TRANSPORTE DE
MERCANCIAS POR CARRETERA CARPINTERIA METALICA.
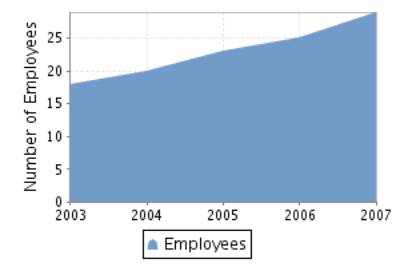
Employees 
Number of total employees: 25 (2008)
Number of fixed employees: 48,28%
Number of temporary employees: 51,72%
Employees evolution
Banks 
|
ENTITY |
BRANCH |
ADDRESS |
TOWN OR CITY |
PROVINCE |
|
BANCO SANTANDER, S.A. |
|
|
ALMERIA |
|
|
CAJAMAR CAJA RURAL, S.C.C. |
|
|
ALMERIA |
|
2 bank entities registered
LEGAL STRUCTURE
Constitution Data
Register Date: 14/01/2002
Register town: Almería
Announcement number: 111644
Legal form: LIMITED LIABILITY COMPANY
Social Capital: 14.000 €
Current Legal Form: LIMITED LIABILITY COMPANY
Current Capital: 19.000,00 €
Legal Aspects
Obligation to fill in Financial Statements: YES
Chamber census: YES (2006)
Listed on a Stock Exchange: NO
B.O.R.M.E.(Official Companies Registry Gazette) ![]()
Registered Proceedings
|
PROCEEDINGS |
DATE |
NOTICE NUM. |
TRADE REG. |
|
Change of statutes |
28/10/2004 |
453020 |
Almería |
Other Proceedings published
|
PROCEEDINGS |
DATE |
NOTICE NUM. |
TRADE REG. |
|
Registration of accounts (2007) Individual |
17/09/2008 |
563817 |
Almería |
|
Registration of accounts (2006) Individual |
21/11/2007 |
1047859 |
Almería |
|
Registration of accounts (2005) Individual |
20/09/2006 |
500651 |
Almería |
|
Registration of accounts (2004) Individual |
03/11/2005 |
826641 |
Almería |
FINANCIAL INFORMATION
The information on the last account contained in this report is extracted
from the Mercantile Register file of the legal address of the Company and
dated 29/09/2008.
BALANCE SHEET
Assets
Figures given in €
|
|
31/12/2005 (12) |
31/12/2006 (12) |
31/12/2007 (12) |
|
A) DUE FROM SHAREHOLDERS FOR UNCALLED CAPITAL |
|
|
|
|
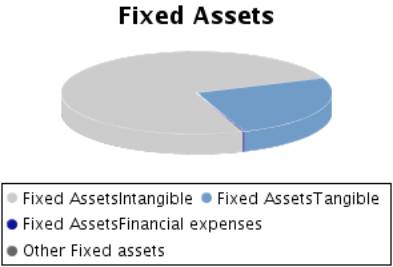
B) FIXED ASSETS |
1.253.339,26 |
1.754.100,05 |
1.526.030,59 |
|
I. Incorporation costs |
|
|
|
|
II. Intangible fixed assets |
645.373,67 |
1.200.614,13 |
1.138.895,29 |
|
III. Tangible fixed assets |
575.096,62 |
520.616,95 |
383.595,84 |
|
IV. Financial fixed assets |
32.868,97 |
32.868,97 |
3.539,46 |
|
V.Owners equity |
|
|
|
|
VI.Long term trade liabilities |
|
|
|
|
C) DEFERRED EXPENSES |
59.454,83 |
102.736,34 |
106.637,50 |
|
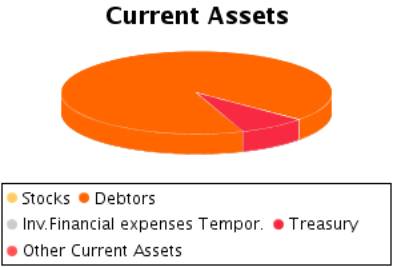
D) CURRENT ASSETS |
939.838,05 |
928.687,30 |
1.193.692,82 |
|
I. Shareholders by required outlays |
|
|
|
|
II. Stocks |
|
|
|
|
III. Debtors |
702.779,01 |
829.693,15 |
1.097.161,26 |
|
IV. Temporary financial investment |
30,88 |
30,88 |
30,88 |
|
V. Short-term own shares |
|
|
|
|
VI. Treasury |
237.028,16 |
98.963,27 |
96.500,68 |
|
VII. Periodification adjustments |
|
|
|
|
ASSETS (A + B + C + D) |
2.252.632,14 |
2.785.523,69 |
2.826.360,91 |
Assets composition

Liabilities
Figures given in €
|
|
31/12/2005 (12) |
31/12/2006 (12) |
31/12/2007 (12) |
|
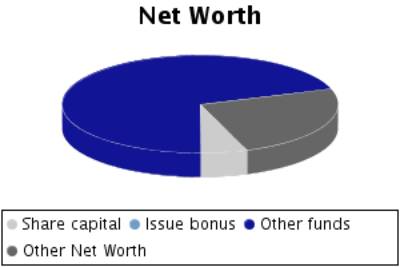
A) SHAREHOLDERS EQUITY |
194.907,11 |
263.295,84 |
348.604,02 |
|
I. Share capital |
19.000,00 |
19.000,00 |
19.000,00 |
|
II. Issue bonus |
|
|
|
|
III.Revaluation reserve |
|
|
|
|
IV.Reserves |
71.261,62 |
175.907,11 |
244.295,84 |
|
Capital adjustments in Euros |
|
|
|
|
Sundry reserves |
71.261,62 |
175.907,11 |
244.295,84 |
|
V.Results from previous years |
|
|
|
|
VI.Profit and Losses |
104.645,49 |
68.388,73 |
85.308,18 |
|
VII.Dividend paid during the year |
|
|
|
|
VIII.Own shares for capital reduction |
|
|
|
|
B) DEFERRED INCOME |
|
|
|
|
C) PROVISIONS FOR LIABILITIES AND EXPENSES |
|
|
|
|
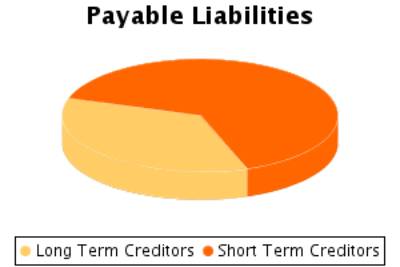
D) LONG TERM LIABILITIES |
960.303,49 |
1.258.209,02 |
879.613,61 |
|
E) SHORT TERM LIABILITIES |
1.097.421,54 |
1.264.018,83 |
1.598.143,28 |
|
F) SHORT TERM PROVISIONS FOR LIABILITIES AND
EXPENSES |
|
|
|
|
LIABILITIES (A + B + C + D + E + F) |
2.252.632,14 |
2.785.523,69 |
2.826.360,91 |
Liabilities Composition

PROFIT AND LOSS ACCOUNT
Itams of the Profit and Loss Account
Figures given in €
|
|
31/12/2005 (12) |
31/12/2006 (12) |
31/12/2007 (12) |
|
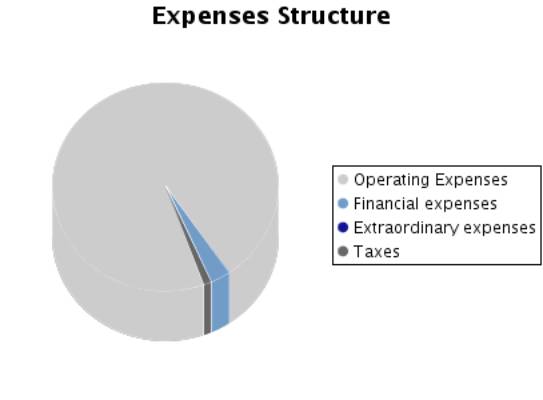
A) EXPENSES (A.1 a A.15) |
2.244.586,58 |
2.529.813,56 |
2.756.448,14 |
|
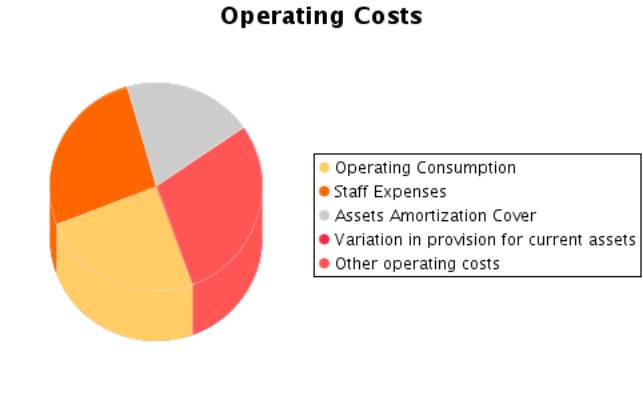
A.1.Operating costs |
616.692,53 |
567.551,54 |
653.190,91 |
|
A.2. Labour cost |
458.376,29 |
629.383,29 |
699.983,85 |
|
Wages |
338.887,68 |
485.664,54 |
556.301,97 |
|
Social security expenses |
119.488,61 |
143.718,75 |
143.681,88 |
|
A.3. Assets depreciation |
418.054,24 |
476.425,61 |
524.838,37 |
|
A.4. Variation in provision for current assets |
|
|
|
|
A.5. Other operating costs |
644.385,33 |
758.371,58 |
767.746,63 |
|
A.I. OPERATING RESULT (B.1-A.1-A.2-A.3-A.4-A.5) |
201.408,12 |
|
114.652,86 |
|
A.6.Financial expenses and similar |
57.234,68 |
63.534,65 |
81.173,85 |
|
Debts with related companies |
57.234,68 |
63.497,15 |
78.046,47 |
|
Debts with associated companies |
|
|
|
|
Other companies debts By debts with third parties and similar expenses |
|
37,50 |
3.127,38 |
|
Losses from financial investments |
|
|
|
|
A.7. Variation in financial investment provision |
|
|
|
|
A.8.Negative exchange difference |
|
|
|
|
A.II.POSITIVE FINANCIAL RESULTS
(B.2+B.3-A.6-A.7-A.8) |
|
|
|
|
A.III.PROFIT FROM ORDINARY ACTIVITIES (A.I+A.II-B.I-B.II) |
150.679,48 |
|
39.713,10 |
|
A.9. Variation in provision in fixed assets |
|
|
|
|
A.10. Losses in fixed assets |
|
2.811,23 |
|
|
A.11. Losses from own shares and bonds |
|
|
|
|
A.12. Extraordinary charges |
|
700,00 |
710,44 |
|
A.13.Other exercises’ expenses and losses |
|
|
|
|
A.IV.POSITIVE EXTRAORDINARY RESULT
(B.4+B.5+B.6+B.7+B.8-A.9-A.10-A.11-A.12-A.13) |
3.809,52 |
184.683,36 |
74.399,17 |
|
A.V.PROFIT BEFORE TAXES (A.III+A.IV-B.III-B.IV) |
154.489,00 |
99.424,39 |
114.112,27 |
|
A.14.Corporate Taxes |
49.843,51 |
31.035,66 |
28.804,09 |
|
A.15. Other taxes |
|
|
|
|
A.VI.EXERCISE RESULT (PROFIT) (A.V-A.14-A.15) |
104.645,49 |
68.388,73 |
85.308,18 |
|
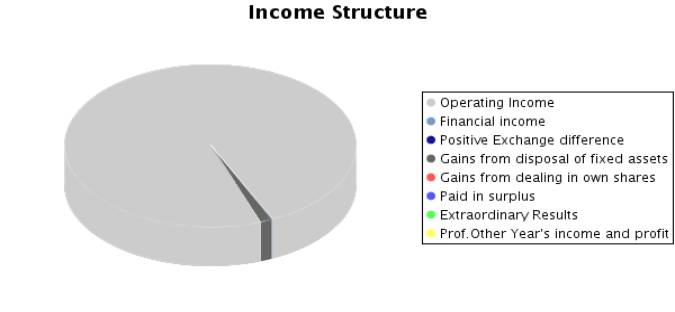
B) INCOMES (B.1 a B.8) |
2.349.232,07 |
2.598.202,29 |
2.841.756,32 |
|
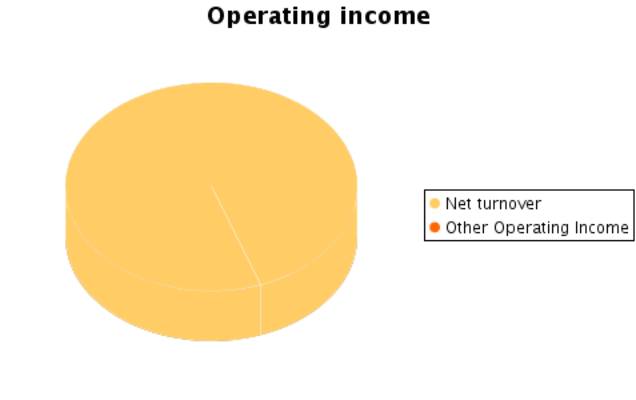
B.1.Operating income |
2.338.916,51 |
2.408.421,78 |
2.760.412,62 |
|
Turnover |
2.338.916,51 |
2.408.421,78 |
2.760.412,62 |
|
Other operating income |
|
|
|
|
B.I.OPERATING LOSSES (A.1+A.2+A.3+A.4+A.5-B.1) |
|
23.310,24 |
|
|
B.2.Financial Income |
6.506,04 |
1.585,92 |
6.234,09 |
|
From affiliated companies |
424,75 |
62,69 |
91,02 |
|
From associated companies |
|
|
|
|
Other |
6.081,29 |
1.523,23 |
6.143,07 |
|
Gains from investments |
|
|
|
|
B.3. Positive change difference |
|
|
|
|
B.II. NEGATIVE FINANCIAL RESULTS
(A.6+A.7+A.8-B.2-B.3) |
50.728,64 |
61.948,73 |
74.939,76 |
|
B.III.LOSSES FROM ORDINARY ACTIVITIES
(B.I+B.II-A.I-A.II) |
|
85.258,97 |
|
|
B.4.B.9. Gains from disposal of fixed assets |
|
184.010,68 |
74.603,33 |
|
B.5.Gains from dealing in own shares |
|
|
|
|
B.6. Paid in surplus |
|
|
|
|
B.7. Extraordinary income |
3.809,52 |
4.183,91 |
506,28 |
|
B.8.Other year’s income and profits |
|
|
|
|
B.IV.NEGATIVE EXTRAORDINARY LOSSES
(A.9+A.10+A.11+A.12+A.13-B.4-B.5-B.6-B.7-B.8) |
|
|
|
|
B.V.LOSS BEFORE TAXES (B.III+B.IV-A.III-A.IV) |
|
|
|
|
B.VI.EXERCISE RESULTS (LOSS) (B.V+A.14+A.15) |
|
|
|
Composition of the Profit and
Loss Account
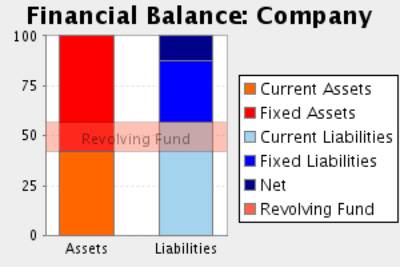
FINANCIAL BALANCE
Here the Main Capital Amounts of the company and the Revolving Fund
Evolution are analysed.
Financial Balance Table
Figures given in €
|
|
31/12/2005 (12) |
% |
31/12/2006 (12) |
% |
31/12/2007 (12) |
% |
|
A) DUE FROM SHAREHOLDERS FOR UNCALLED CAPITAL |
|
|
|
|
|
|
|
B) FIXED ASSETS |
1.253.339,26 |
55,64 |
1.754.100,05 |
62,97 |
1.526.030,59 |
53,99 |
|
C) DEFERRED EXPENSES |
59.454,83 |
2,64 |
102.736,34 |
3,69 |
106.637,50 |
3,77 |
|
D) CURRENT ASSETS |
939.838,05 |
41,72 |
928.687,30 |
33,34 |
1.193.692,82 |
42,23 |
|
ASSETS (A + B + C + D) |
2.252.632,14 |
|
2.785.523,69 |
|
2.826.360,91 |
|
|
|
||||||
|
A) SHAREHOLDERS EQUITY |
194.907,11 |
8,65 |
263.295,84 |
9,45 |
348.604,02 |
12,33 |
|
B) DEFERRED INCOME |
|
|
|
|
|
|
|
C) PROVISIONS FOR LIABILITIES AND EXPENSES |
|
|
|
|
|
|
|
D) LONG TERM LIABILITIES |
960.303,49 |
42,63 |
1.258.209,02 |
45,17 |
879.613,61 |
31,12 |
|
E) SHORT TERM LIABILITIES |
1.097.421,54 |
48,72 |
1.264.018,83 |
45,38 |
1.598.143,28 |
56,54 |
|
F) SHORT TERM PROVISIONS FOR LIABILITIES AND EXPENSES |
|
|
|
|
|
|
|
LIABILITIES (A + B + C + D + E + F) |
2.252.632,14 |
|
2.785.523,69 |
|
2.826.360,91 |
|
Financial Balance Composition
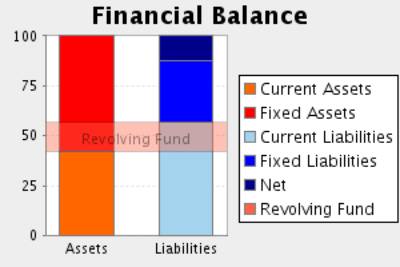
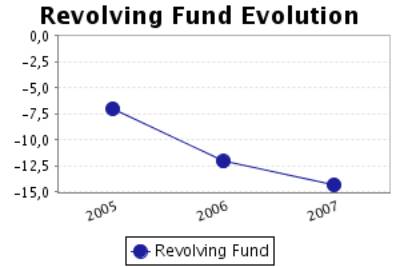
Comments on Financial Balance
In the 2005, the assets of the company were formed in 58,28% of Fixed
Assets and in 41,72% of Current Assets. This assets were financed in 8,65% with
own capitals, and in 42,63% with long term debt and in 48,72% with current
liabilities.
The result of this financial structure is a negative turnover fund of
-157.583,49 Euros, which is equivalent to -7,00% proportion of the company’s
total assets.
In the 2006, the assets of the company were formed in 66,66% of Fixed
Assets and in 33,34% of Current Assets. This assets were financed in 9,45% with
own capitals, and in 45,17% with long term debt and in 45,38% with current
liabilities.
The result of this financial structure is a negative turnover fund of
-335.331,53 Euros, which is equivalent to -12,04% proportion of the company’s
total assets.
This measure has diminished with respect to the previous exercise in
112,80% having also diminished its proportion with respect to the total assets
of the company.
In the 2007, the assets of the company were formed in 57,77% of Fixed
Assets and in 42,23% of Current Assets. This assets were financed in 12,33%
with own capitals, and in 31,12% with long term debt and in 56,54% with current
liabilities.
The result of this financial structure is a negative turnover fund of
-404.450,46 Euros, which is equivalent to -14,31% proportion of the company’s
total assets.
This measure has diminished with respect to the previous exercise in
20,61% having also diminished its proportion with respect to the total assets
of the company.
RATIOS
Main Ratios
|
|
31/12/2005 (12) |
31/12/2006 (12) |
31/12/2007 (12) |
|
STRUCTURAL RATIOS |
|
|
|
|
Management fund |
-157.583,49 |
-335.331,53 |
-404.450,46 |
|
Indebtedness (%) |
91,35 |
90,55 |
87,67 |
|
External Funds on Net Worth |
10,56 |
9,58 |
7,11 |
|
GENERAL ACTIVITY RATIO |
|
|
|
|
Turnover Increase (%) |
17,06 |
2,97 |
14,62 |
|
Added value growth (%) |
23,02 |
0,43 |
23,74 |
|
Cash Flow |
522.699,73 |
544.814,34 |
610.146,55 |
|
Labour Productivity |
2,35 |
1,72 |
1,91 |
|
Assets turnover |
1,04 |
0,86 |
0,98 |
|
Breakdown Point |
2.065.388,34 |
2.438.918,71 |
2.610.219,98 |
|
Security Margin of the Breakdown Point (%) |
11,70 |
-1,27 |
5,44 |
|
ACTIVITY RATIOS |
|
|
|
|
Average Collection Period |
108 |
124 |
143 |
|
SOLVENCY RATIOS |
|
|
|
|
Payback Capacity |
0,25 |
0,22 |
0,25 |
|
Assets Guarantee |
1,07 |
1,06 |
1,10 |
|
Short Term Debts Proportion (%) |
53,33 |
50,12 |
64,50 |
|
Interest Coverage |
8,95 |
5,59 |
6,51 |
|
LIQUIDITY RATIOS |
|
|
|
|
Current Ratio |
0,86 |
0,74 |
0,75 |
|
Immediate liquidity |
0,22 |
0,08 |
0,06 |
|
Sales on Current Assets |
896 |
934 |
832 |
Results Analysis Ratios
|
|
31/12/2005 (12) |
31/12/2006 (12) |
31/12/2007 (12) |
|
Economic profitability (%) |
8,94 |
-0,84 |
4,06 |
|
Operating Profitability (%) |
8,61 |
-0,97 |
4,15 |
|
Equity gearing |
8,65 |
38,70 |
2,81 |
|
Financial profitability (%) |
53,69 |
25,97 |
24,47 |
|
General Profitability (%) |
4,47 |
2,84 |
3,09 |
Comments on the Results Analysis
Ratios
The economic profitability in the year2006The economic profitability in
the year -0,84%, derived from a negative operating profitability of -0,97%.The assets
turnover was 0,86%.
The economic profitability in the year from a positive level of 8,94% to
its current negative level. This evolution is due to the obtaining of a
negative operating profitability of -0,97% in comparison with the current
positive value of 8,61%. Assets turnover has maintained stable in this period,
with an index of 0,86%.
Financial profitability on 2006 achieved a 25,97%.
The company’s financial structure has restrained its financial
profitability with an indebtedness level of 38,70.
The general profitability on 2006 achieved a 2,84%.
The economic profitability in the year2007 achieved a 4,06% positive
level, due to a 4,15% economic margin and to an assets turnover of0,98%.
The economic profitability in the year has passed from a negative level
of -0,84% to its positive current value. This evolution is due to the obtaining
of positive operating profitability of 4,15% in comparison with the previous
negative level of -0,97%. Assets turnover has maintained stable in this period,
with an index of 0,98%.
Financial profitability on 2007 achieved a 24,47%.
The company’s financial structure has instigated its economic
profitability with an indebtedness level of 2,81.
The general profitability on 2007 achieved a 3,09%.
SECTORIAL ANÁLYSIS
Large Capital Amounts and Financial Balance
Figures given in %
|
|
COMPANY (2007) |
SECTOR |
DIFFERENCE |
DIFFERENCE RELATIVE |
|
ASSETS |
|
|
|
|
|
A) DUE FROM SHAREHOLDERS FOR UNCALLED CAPITAL |
|
0,05 |
|
|
|
B) FIXED ASSETS |
53,99 |
53,53 |
0,46 |
0,86 |
|
C) DEFERRED EXPENSES |
3,77 |
1,28 |
2,49 |
194,07 |
|
D) CURRENT ASSETS |
42,23 |
45,14 |
-2,91 |
-6,44 |
|
ASSETS (A + B + C + D) |
100 |
100 |
|
|
|
|
|
|
|
|
|
|
COMPANY (2007) |
SECTOR |
DIFFERENCE |
DIFFERENCE RELATIVE |
|
LIABILITIES |
|
|
|
|
|
A) SHAREHOLDERS EQUITY |
12,33 |
35,97 |
-23,64 |
-65,72 |
|
B) DEFERRED INCOME |
|
0,29 |
|
|
|
C) PROVISIONS FOR LIABILITIES AND EXPENSES |
|
0,20 |
|
|
|
D) LONG TERM LIABILITIES |
31,12 |
25,49 |
5,63 |
22,09 |
|
E) SHORT TERM LIABILITIES |
56,54 |
38,04 |
18,51 |
48,65 |
|
F) SHORT TERM PROVISIONS FOR LIABILITIES AND EXPENSES |
|
0,02 |
|
|
|
LIABILITIES (A + B + C + D + E + F) |
100 |
100 |
|
|
Sectorial Financial Balance
Comparison

Comments to the Sectorial
Analysis
In the 2007, the assets of the company were formed in 57,77% of fixed
assets and in 42,23Current Assets % In the sector, the proportion of fixed assets
was of 54,86%, 5,30% inferior, and the proportion of current assets was of
45,14%, 6,44% superior.
The assets were financed in the company in 12,33% with own capitals , in
31,12% with fixed liabilities and in 56,54% with current liabilities In the sector,
the self financing represented 36,26%, 65,99% superior. On the other hand the
long term debts represented in the sector an average of 25,69% financing, with
a relative difference of 21,16% in favour of the companyAnd, short term
liabilities represented in the sector an average of 38,06% financing, with a
relative difference of 48,57% in favour of the company
The result of this company’s financial structure is a turnover fund that
represents -14,31% of the total assets; in the sector, this same proportion is
7,08%, therefore, we can say that the company’s turnover fund is 302,09%
smaller than the sector one.
Analytical Account of Results
Figures given in %
|
|
COMPANY (2007) |
SECTOR |
DIFFERENCE |
DIFFERENCE RELATIVE |
|
Turnover |
100,00 |
98,43 |
1,57 |
1,59 |
|
Other operating income |
|
1,57 |
|
|
|
Production Value |
100,00 |
100,00 |
0,00 |
0,00 |
|
Operating expenses |
23,66 |
28,85 |
-5,19 |
-17,99 |
|
Other operation expenses |
27,81 |
31,26 |
-3,45 |
-11,03 |
|
Added value |
48,52 |
39,89 |
8,63 |
21,63 |
|
Labour cost |
25,36 |
28,48 |
-3,12 |
-10,96 |
|
Gross Economic Result |
23,17 |
11,41 |
11,76 |
103,01 |
|
Assets depreciation |
19,01 |
8,08 |
10,93 |
135,16 |
|
Variation in provision for current assets and bad debt losses |
|
0,14 |
|
|
|
Net Economic Result |
4,15 |
3,19 |
0,96 |
29,97 |
|
Financial income |
0,23 |
0,26 |
-0,03 |
-12,88 |
|
Financial Charges |
2,94 |
1,42 |
1,52 |
106,75 |
|
Variation in financial investment provision |
|
0,00 |
|
|
|
Ordinary Activities Result |
1,44 |
2,04 |
-0,60 |
-29,41 |
|
Extraordinary income |
2,72 |
1,94 |
0,78 |
40,35 |
|
Extraordinary charges |
0,03 |
0,65 |
-0,62 |
-95,38 |
|
Variation in provision in fixed assets |
|
0,01 |
|
|
|
Results before Taxes |
4,13 |
3,32 |
0,81 |
24,47 |
|
Corporate taxes |
1,04 |
0,82 |
0,22 |
27,45 |
|
Net Result |
3,09 |
2,50 |
0,59 |
23,50 |
|
Assets depreciation |
19,01 |
8,08 |
10,93 |
135,16 |
|
Change of Provisions |
|
0,14 |
|
|
|
Net Self-Financing |
22,10 |
10,73 |
11,37 |
106,00 |
Main Ratios
|
|
COMPANY (2007) |
PTILE25 |
PTILE50 |
PTILE75 |
|
STRUCTURAL RATIOS |
|
|
|
|
|
Management fund |
-404.450,46 |
-35,81 |
22,58 |
104,56 |
|
Indebtedness (%) |
87,67 |
49,48 |
69,42 |
82,79 |
|
External Funds on Net Worth |
7,11 |
0,98 |
2,27 |
4,81 |
|
GENERAL ACTIVITY RATIO |
|
|
|
|
|
Turnover Increase (%) |
14,62 |
-3,43 |
5,84 |
16,62 |
|
Added value growth (%) |
23,74 |
-9,86 |
2,80 |
15,67 |
|
Cash Flow |
610.146,55 |
19,52 |
49,21 |
108,46 |
|
Labour Productivity |
1,91 |
1,20 |
1,40 |
1,68 |
|
Assets turnover |
0,98 |
0,82 |
1,18 |
1,68 |
|
Breakdown Point |
2.610.219,98 |
238.560,92 |
517.783,19 |
1.028.800,70 |
|
Security Margin of the Breakdown Point (%) |
5,44 |
0,06 |
4,04 |
9,04 |
|
ACTIVITY RATIOS |
|
|
|
|
|
Average Collection Period |
143 |
53 |
87 |
128 |
|
SOLVENCY RATIOS |
|
|
|
|
|
Payback Capacity |
0,25 |
0,10 |
0,19 |
0,33 |
|
Assets Guarantee |
1,10 |
1,19 |
1,42 |
1,99 |
|
Short Term Debts Proportion (%) |
64,50 |
43,16 |
64,91 |
89,28 |
|
Interest Coverage |
6,51 |
2,84 |
7,22 |
16,65 |
|
LIQUIDITY RATIOS |
|
|
|
|
|
Current Ratio |
0,75 |
0,78 |
1,18 |
2,01 |
|
Immediate liquidity |
0,06 |
0,05 |
0,21 |
0,60 |
|
Sales on Current Assets |
832 |
673 |
985 |
1.448 |
Results Analysis Ratios
|
|
COMPANY (2007) |
PTILE25 |
PTILE50 |
PTILE75 |
|
Economic profitability (%) |
4,06 |
0,06 |
3,46 |
7,65 |
|
Operating Profitability (%) |
4,15 |
0,04 |
2,89 |
6,72 |
|
Equity gearing |
2,81 |
1,28 |
2,14 |
4,17 |
|
Financial profitability (%) |
24,47 |
0,67 |
6,37 |
14,95 |
|
General Profitability (%) |
3,09 |
0,14 |
1,42 |
4,36 |
NOTES
BLOQUE DE INVESTIGACION:
- Tfno. móvil de contacto: 629570166.
ABOUT YOUR REQUEST:
The subject’s correct address is Cr. Viator-Pechina km 2,7, 04250
Pechina (Almeria).
The telephone number provided in your request (902 141 012 629),
does not correspond to the subject. The correct one is provided in
this report. The fax number provided in your request is correct.
In spite of investigations using every source available (public and
private), no additional details than those contained in this report
are available. .
FOREIGN EXCHANGE
RATES
|
Currency |
Unit
|
Indian Rupees |
|
US Dollar |
1 |
Rs.49.25 |
|
UK Pound |
1 |
Rs.80.36 |
|
Euro |
1 |
Rs.62.84 |
RATING
EXPLANATIONS
|
RATING |
STATUS |
PROPOSED CREDIT LINE |
|
|
>86 |
Aaa |
Possesses an extremely sound financial base with the strongest capability
for timely payment of interest and principal sums |
Unlimited |
|
71-85 |
Aa |
Possesses adequate working capital. No caution needed for credit
transaction. It has above average (strong) capability for payment of interest
and principal sums |
Large |
|
56-70 |
A |
Financial & operational base are regarded healthy. General
unfavourable factors will not cause fatal effect. Satisfactory capability for
payment of interest and principal sums |
Fairly Large |
|
41-55 |
Ba |
Overall operation is considered normal. Capable to meet normal
commitments. |
Satisfactory |
|
26-40 |
B |
Unfavourable & favourable factors carry similar weight in credit
consideration. Capability to overcome financial difficulties seems comparatively
below average. |
Small |
|
11-25 |
Ca |
Adverse factors are apparent. Repayment of interest and principal sums
in default or expected to be in default upon maturity |
Limited with
full security |
|
<10 |
C |
Absolute credit risk exists. Caution needed to be exercised |
Credit not
recommended |
|
NR |
In view of the lack of information, we have no basis upon which to
recommend credit dealings |
No Rating |
|
This score serves as a reference to assess SC’s credit risk
and to set the amount of credit to be extended. It is calculated from a
composite of weighted scores obtained from each of the major sections of this
report. The assessed factors and their relative weights (as indicated through
%) are as follows:
Financial
condition (40%) Ownership
background (20%) Payment
record (10%)
Credit history
(10%) Market trend
(10%) Operational
size (10%)