![]()
MIRA
INFORM REPORT
|
Report Date : |
31.10.2008 |
IDENTIFICATION
DETAILS
|
Name : |
PULL & BEAR ESPANA SA |
|
|
|
|
Registered Office : |
Avenida Deputacion
- Pol Ind Sabon, S/N, Cp 15142, Arteixo La Coruña |
|
|
|
|
Country : |
Spain |
|
|
|
|
Financials (as on) : |
31.01.2007 |
|
|
|
|
Date of Incorporation : |
|
|
|
|
|
Legal Form : |
Joint Stock Company |
|
|
|
|
Line of Business : |
RATING &
COMMENTS
|
MIRA’s Rating : |
Ba |
|
RATING |
STATUS |
PROPOSED CREDIT LINE |
|
|
41-55 |
Ba |
Overall operation is considered normal. Capable to meet normal
commitments. |
Satisfactory |
|
Maximum Credit Limit : |
6.000.000,00 € |
|
|
|
|
Status : |
Satisfactory |
|
|
|
|
Payment Behaviour : |
No Complaints |
|
|
|
|
Litigation : |
Clear |
FINANCIAL REPORT
PULL & BEAR ESPANA SA
TAX NUMBER: A15108673
EXECUTIVE SUMMARY
Identification
Current Business Name: PULL & BEAR
ESPANA SA
Commercial Name: PULL & BEAR
Other names: YES
Current Address: AVENIDA DEPUTACION
- POL IND SABON, S/N, CP 15142, ARTEIXO LA CORUÑA
Branches: 169
Telephone number: 981334900 Fax: 981334926
URL: www.pullbear.com Corporate e-mail: pablopb@inditex.com
Commercial Risk
Credit Appraisal:
6.000.000,00 €
RAI: NO
Legal Actions: YES
Financial Information
Latest Balance sheet sales (2007): 415.109.659,00 € (MERCANTILE REGISTER)
Result: 43.518.983 €
Total Assets:
253.985.700 €
Social Capital: 7.332.348,00 €
Employees: 2.500
Commercial Information
Constitution Date: 14/11/1986
Business activity: Retail sale
of clothes
NACE Code: 5242
International Operations: Imports and
Exports
Corporate Structure
President:
Parent Company:
Participations: 13
Other Complementary Information
Latest proceeding published in BORME: 01/07/2008 Resignations
Latest press article: 24/10/2008 GACETA
NEG (BRANCHES INFORMATION)
Bank Entities: Yes
Credit Appraisal
Maximum Credit
(from 0 a 6,000,000 €)
Favourable to 6.000.000,00 €
Rating Evolution
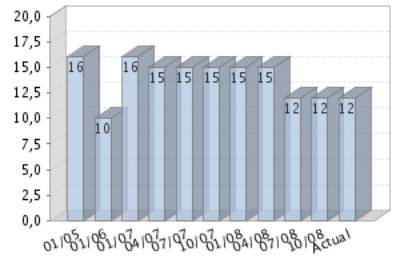
Financial Situation
Fiscal year2007
|
Treasury |
Tense |
|
Indebtedness |
Weak |
|
Profitability |
Good |
|
Balance |
Degraded |
Performance
|
Legal Actions |
None or Negligible |
|
Business
Trajectory |
Excellent |
RAI 
COMPANY NOT REGISTERED IN THE R.A.I.
This company is not registered in the Disputed Bills register (R.A.I.)
DATE AND TIME OF THE CONSULTATION: 27/10/2008
09:10:56
INCIDENTS

Summary
LEGAL ACTIONS: No legal incidences registered
|
CLAIM FILED
AGAINST THE ADMINISTRATION: 1 ( last: 23/08/2005 )With the
Social Security: |
0 |
|
With the Tax
Authorities: |
0 |
|
With Other
Official bodies: |
1 |
AFFECTED BY: No significant element.
Last claim filed against the
administration
Figures expressed in €
WITH OTHER OFFICIAL BODIES
1 claim(s)
Seizures
|
DATE |
ORGANIZATION |
AMOUNT |
|
23/08/2005 |
TOWN/ CITY HALL DE A CORUNA |
|
FINANCIAL ELEMENTS AND SECTORIAL
COMPARATIVE
FINANCIAL ELEMENTS
Figures given in €
|
|
2005 (12) |
2006 (12) |
2007 (12) |
% ASSETS |
|
|
|
|
|
|
BALANCE SHEET
ANALYSIS |
|
|
|
|
|
|
|
|
|
|
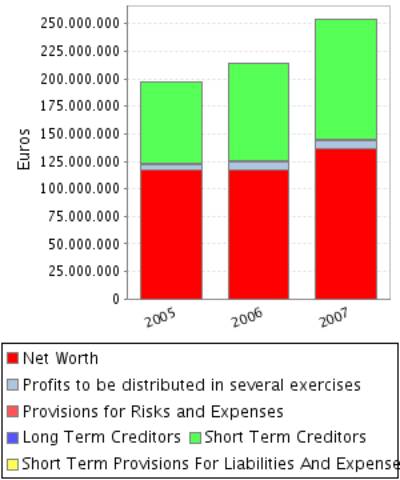
OWN FUNDS |
121.530.082,00 |
123.995.205,00 |
143.863.478,00 |
56,64 |
|
|
|
|
|
|
DEBT |
75.080.629,00 |
90.442.341,00 |
110.122.222,00 |
43,36 |
|
|
|
|
|
|
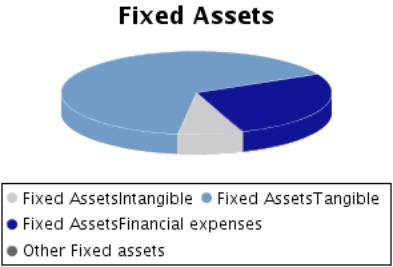
FIXED ASSETS |
110.474.621,00 |
123.596.053,00 |
154.865.823,00 |
60,97 |
|
|
|
|
|
|
TOTAL ASSETS |
196.610.711,00 |
214.437.546,00 |
253.985.700,00 |
|
|
|
|
|
|
|
|
|
|
|
|
|
|
|
|
|
|
|
2005 (12) |
2006 (12) |
2007 (12) |
% SALES |
|
|
|
|
|
|
PROFIT AND LOSS
ACCOUNT ANALYSIS |
|
|
|
|
|
|
|
|
|
|
SALES |
335.471.151,00 |
374.787.634,00 |
415.109.659,00 |
|
|
|
|
|
|
|
ADDED VALUE |
100.432.074,00 |
125.189.636,00 |
124.726.578,00 |
30,05 |
|
|
|
|
|
|
EBITDA |
58.726.427,00 |
80.024.967,00 |
74.043.426,00 |
17,84 |
|
|
|
|
|
|
EBIT |
43.462.249,00 |
65.803.153,00 |
59.282.980,00 |
14,28 |
|
|
|
|
|
|
NET RESULT |
29.820.124,00 |
49.911.487,00 |
43.518.983,00 |
10,48 |
|
|
|
|
|
Balance Sheets Items
Analysis


Balance Sheet Comments
Total assets of the company grew 9,07% between 2005 and 2006.
This growth is a consequence of the fixed assets increase of 11,88%.
This growth has been mainly financed with a debt increase of 20,46%.
Nevertheless the net worth increased 2,03%.
Total assets of the company grew 18,44% between 2006 and 2007.
This growth is a consequence of the fixed assets increase of 25,30%.
This growth has been mainly financed with a debt increase of 21,76%.
Nevertheless the net worth increased 16,02%.
Profit and Loss
Account Analysis


Profit and Loss Account Comments
The company’s sales figure grew 11,72% between 2005 and 2006.
The company’s EBIT grew 51,40% between 2005 and 2006.
This evolution implies an increase in the company’s operating
profitability.
The result of these variations is an increase of the company’s Economic
Profitability of 38,82% in the analysed period, being this profitability of
30,69% in the year 2006.
The company’s Net Result grew 67,38% between 2005 and 2006.
This evolution, compared to the EBIT’s performance, implies that the
financial and extraordinary activities have had a positive effect in the
company’s Financial Profitability.
The result of these variations is an increase of the company’s Economic
Profitability of 64,05% in the analysed period, being equal to 40,25% in the
year 2006.
The company’s sales figure grew 10,76% between 2006 and 2007.
The company’s EBIT decreased in 9,91% between 2006 and 2007.
This evolution implies a reduction in the company’s operating
profitability.
The result of these variations is a decrease of the company’s Economic
Profitability of 23,94% in the analysed period, being this profitability of
23,34% in the year 2007.
The company’s Net Result decreased in 12,81% between 2006 and 2007.
This evolution, compared to the EBIT’s performance, implies that the
financial and extraordinary activities have had a negative effect in the
company’s Financial Profitability.
The result of these variations is a reduction of the company’s
profitability of 24,85% in the analysed period, being equal to 30,25% in the
year 2007.
ANNUAL FINANCIAL REPORT ADDITIONAL DATA
Source: annual financial report 2006
Results Distribution
Figures given in €
|
DISTRIBUTION
BASE |
DISTRIBUTION TO |
||
|
Profit and Loss |
43.518.983,00 |
Retained earnings |
0,00 |
|
Carry Over |
0,00 |
Voluntary Reserve |
3.518.983,00 |
|
Voluntary reserves |
0,00 |
Prior years losses |
0,00 |
|
Reserves |
0,00 |
Carry Over |
0,00 |
|
Other concepts |
0,00 |
Other funds |
0,00 |
|
Total of Amounts to be distributed |
43.518.983,00 |
Dividends |
40.000.000,00 |
|
|
|
Other Applications |
0,00 |
Auditing
Auditors’ opinion: FAVOURABLE
Auditor: KPMG AUDITORES S.L.
COMPARATIVE SECTOR ANALYSIS
Values table
Figures expressed in %
|
|
COMPANY (2007) |
SECTOR |
DIFFERENCE |
DIFFERENCE RELATIVE |
|
|
|
|
|
|
BALANCE SHEET
ANALYSIS: % on the total assets |
|
|
|
|
|
|
|
|
|
|
OWN FUNDS |
56,64 |
41,87 |
14,77 |
35,28 |
|
|
|
|
|
|
DEBT |
43,36 |
58,13 |
-14,77 |
-25,41 |
|
|
|
|
|
|
FIXED ASSETS |
60,97 |
59,06 |
1,92 |
3,25 |
|
|
|
|
|
|
|
|
|
|
|
|
|
|
|
|
|
|
COMPANY (2007) |
SECTOR |
DIFFERENCE |
DIFFERENCE RELATIVE |
|
|
|
|
|
|
PROFIT AND LOSS
ACCOUNT ANALYSIS: % on the total operating income |
|
|
|
|
|
|
|
|
|
|
SALES |
99,44 |
98,31 |
1,12 |
1,14 |
|
|
|
|
|
|
ADDED VALUE |
29,88 |
26,37 |
3,51 |
13,32 |
|
|
|
|
|
|
EBIT |
14,20 |
10,56 |
3,64 |
34,46 |
|
|
|
|
|
|
NET RESULT |
10,42 |
7,12 |
3,31 |
46,48 |
|
|
|
|
|
Sector Composition
Compared sector (NACE): 524
Number of companies: 53
Size (Sales Figure) : > 40.000.000,00 Euros
Comments on the sectorial comparative
Compared to its sector the assets of the companies show a greater
proportion of fixed assets. Specifically the difference with the sector average
is 1,92% , which means a relative difference of 3,25% .
In liabilities composition the company appeals on a wider scale to self
financing, being the proportion of net worth of 14,77% superior, which means a
relative difference of 35,28% . As a consequence, external financing sources
are less used by the company in 14,77% less than the sector, which means a
difference of 25,41% .
The proportion that the sales mean to the company’s total ordinary
income is 99,44%, 1,12% higher than in the sector, which means a relative
difference of 1,14% .
The company’s EBIT was positive and was 14,20% with regard to the total
ordinary income, 3,64% higher than in the sector, which means a relative
difference of 34,46% .
The company’s capacity to generate operating income is higher than the
one of the sector as its ratio EBIT/Sales is higher (ES Company versus ES
Sector).
The company’s net result was positive and equal to 10,42% with regard to
the total ordinary income, 3,31% less than the sector, which means a relative
difference of 46,48% .
The financial and extraordinary results and the tax impact have had a
less negative impact on the Net result in the company than in the sector; as a
consequence, the company shows a better Net Result/EBIT ratio (REBEmpresa vs.
REBSector).
ADDRESSES
Current Legal Seat Address:
AVENIDA DEPUTACION - POL IND SABON, S/N
15142 ARTEIXO LA CORUÑA
Previous Seat Address:
STREET GONZALO NAVARRO (PG INDUSTRIAL RIO DO P 0),
15570
NARON LA CORUÑA
Characteristics of the current address
Type of premises: office
Property: shared
Property Description: SEDE DE INDITEX
Local Situation: main
Branches 
|
STREET |
POSTAL CODE |
TOWN |
PROVINCE |
|
STREET GONZALO NAVARRO 37 43 POL. IND. RIO DO POZO |
15570 |
NARON |
La Coruña |
|
RIO DO POZO S 2 P 2 AV G ARTEIXO |
15578 |
NARON |
La Coruña |
|
STREET REAL 82 |
15402 |
FERROL |
La Coruña |
|
STREET CARRETAS 5 |
28012 |
MADRID |
Madrid |
|
STREET CONDE
DE PEÑALVER 5 |
28006 |
MADRID |
Madrid |
|
STREET DOCTOR GRAIÑO 4 |
33400 |
AVILES |
Asturias |
|
STREET MICHELENA 1 |
36002 |
PONTEVEDRA |
Pontevedra |
|
STREET PAVIA 18 |
35010 |
LAS PALMAS DE GRAN CANARIA |
Palmas (Las) |
|
CARRETERA DEL NORTE 112 CARRETERA A. |
35014 |
LAS PALMAS DE GRAN CANARIA |
Palmas (Las) |
169 branches registered
CORPORATE STRUCTURE
ADMINISTRATIVE LINKS
Main Board members, Directors and Auditor ![]()
|
POSITION |
SURNAMES AND
NAME |
APPOINTMENT DATE |
|
|
PRESIDENT |
BADO RIVAS JOSE PABLO DEL |
14/09/2005 |
|
|
CHIEF OFFICER |
ABRIL ABADIN ANTONIO |
27/04/2005 |
|
|
CHIEF OFFICER |
ISLA ALVAREZ DE TEJERA PABLO |
23/11/2005 |
|
|
CHIEF OFFICER |
ARANDA VASSEROT ADOLFO |
05/02/2008 |
|
|
AUDITOR |
APPOINTMENT DATE |
||
|
KPMG AUDITORES SL |
14/11/2007 |
||
Functional Managers
|
POSITION |
SURNAMES AND
NAME |
|
General Manager |
DEL VADO PABLO |
|
General Manager |
ARANDA ADOLFO |
|
Human Resources Manager |
FERNANDEZ BAHAMONDE JAVIER |
|
Commercial Manager |
ROCA ANGEL |
FINANCIAL LINKS
|
|
BUSINESS NAME |
CIF / COUNTRY |
% |
SOURCE |
DATA INF. |
|
|
INDUSTRIA DE DISENO TEXTIL SA |
A15075062 |
100,00 |
OWN SOURCES |
31/10/2008 |
|
|
BUSINESS NAME |
CIF / COUNTRY |
% |
SOURCE |
DATA INF. |
|
|
PULL & BEAR IRELAND LTDA. |
IRELAND |
100,00 |
OWN SOURCES |
18/02/2008 |
|
|
PULL & BEAR CESKA REP |
REPÚBLICA CHECA |
100,00 |
OWN SOURCES |
18/02/2008 |
|
|
PULL & BEAR POLSKA SP |
POLONIA |
100,00 |
OWN SOURCES |
18/02/2008 |
|
|
PULL & BEAR MAGYAPORSZAG |
HUNGRÍA |
100,00 |
OWN SOURCES |
18/02/2008 |
|
|
PULL BEAR LOGISTICA S.A. |
A15458128 |
100,00 |
OWN SOURCES |
18/02/2008 |
|
|
PULL & BEAR VENEZUELA |
VENEZUELA |
100,00 |
OWN SOURCES |
18/02/2008 |
![]() Company with solvency rating below 7
Company with solvency rating below 7
CREDIT INFORMATION
Constitution Date: 14/11/1986
Foundation Date: 01/01/1986
Founder / Origin: LA TITULAR ES LA
FUNDADORA INICIAL DE NEGOCIO
Business activity 
Activity: Retail sale of clothes
NACE Code: 5242
NACE Activity: Retail sale of
clothing
Business: COMERCIALIZACION
DE PRENDAS DE MODA, ZAPATOS Y COMPLEMENTOS DEL VESTIDO, TANTO PARA EL MERCADO
NACIONAL COMO PARA EL EXTRANJERO
Employees 
Number of total employees: 2.500 (2008)
Number of fixed employees: 60,21%
Number of temporary employees: 39,79%
Employees evolution

COMMERCIAL OPERATIONS 
SALES
Collection (estimated):
Cash sales percentage: 100%
Local Distribution: 100%
Banks 
|
ENTITY |
BRANCH |
ADDRESS |
TOWN OR CITY |
PROVINCE |
|
CAJA DE AHORROS DE GALICIA |
|
|
A CORUÑA |
|
|
BANCO BILBAO VIZCAYA ARGENTARIA, S.A. |
|
|
LA CORUNA |
|
2 bank entities registered
Brands, Signs and Commercial
Names 
FORMER NAMES:
•
NEW WEAR SA
LEGAL STRUCTURE
Constitution Data
Register Date: 14/11/1986
Current Legal Form: JOINT STOCK
COMPANY
Current Capital:
7.332.348,00 €
Legal Aspects
Obligation to fill in Financial
Statements: YES
Chamber census: YES (2006)
Listed on a Stock Exchange: NO
B.O.R.M.E.(Official Companies Registry Gazette) ![]()
Registered Proceedings
|
PROCEEDINGS |
DATE |
NOTICE NUM. |
TRADE REG. |
|
Resignations |
01/07/2008 |
325718 |
La Coruña |
|
Appointments |
19/06/2008 |
307085 |
La Coruña |
|
Appointments |
03/06/2008 |
274932 |
La Coruña |
|
Resignations |
12/02/2008 |
74022 |
La Coruña |
|
Appointments |
12/02/2008 |
74022 |
La Coruña |
24/10/2008 GACETA NEG (BRANCHES INFORMATION)
EL GRUPO TEXTIL INDITEX PRESIDIDO POR AMANCIO ORTEGA ECHARA EL CIERRE A
CINCO DE SUS ESTABLECIMIENTOS, TODOS UBICADOS EN ALAVA. SE TRATA DE LAS TIENDAS
ZARA, STRADIVARIUS, MASSIMO DUTTI, PULL & BEAR Y BERSHKA SITUADAS EN UNO DE
LOS CENTROS COMERCIALES DE LA PROVINCIA VASCA. LA INTENCION DEL GRUPO ES CERRAR
A FINALES DEL MES DE MARZO DEL AÑO PROXIMO O PRINCIPIOS DE ABRIL. LA CRISIS DEL
CONSUMO HA HECHO MELLA EN LAS CUENTAS DE INDITEX, CUYAS VENTAS CRECEN EN ESPAÑA
AL RITMO MAS LENTO DE LOS ULTIMOS 5 AÑOS. ASI, CONSTA EN LOS RESULTADOS
ECONOMICOS DE SU PRIMER SEMESTRE FISCAL DEL AÑO (FEBRERO-AGOSTO), PERIODO EN EL
QUE REGISTRO UN BENEFICIO NETO DE 406 MM.
24/09/2008 ELECONOMISTA (BRANCHES INFORMATION)
EL GRUPO INDITEX ANUNCIO EL 23/09/08 QUE TIENE PREVISTO ABRIR EN LO QUE
QUEDA DE AÑO 4 NUEVAS TIENDAS EN DEBRECEN, EN HUNGRIA, Y OTRA EN LA CAPITAL,
BUDAPEST, QUE SE SUMARAN A LAS 11 QUE YA TIENE EN EL PAIS. EN CONCRETO, SE
ABRIRA UNA TIENDA BERSHKA EN BUDAPEST Y CUATRO DE ZARA, PULL & BEAR, STRADIVARIUS
Y BERSHKA EN DEBRECEN. LA REGION DE EUROPA CENTRAL Y DEL ESTE ES UNO DE LOS
PUNTOS DE EXPANSION DE INDITEX, JUNTO A ASIA, DONDE SE HAN REGISTRADO LOS
MAYORES CRECIMIENTOS. EL GRUPO PLANEA DUPLICAR SUS TIENDAS EN EUROPA CENTRAL Y
DEL ESTE HASTA 2009.
Complementary Information
Por causas ajenas a nuestra voluntad el
deposito de cuentas del ejer-
cicio 2007 se ha recibido erroneamente.
FINANCIAL INFORMATION
The information on the last account contained in this report is
extracted from the Mercantile Register file of the legal address of the Company
and dated 08/04/2008.
BALANCE SHEET
Assets
Figures given in €
|
|
31/01/2005 (12) |
31/01/2006 (12) |
31/01/2007 (12) |
|
A) DUE FROM SHAREHOLDERS FOR UNCALLED CAPITAL |
|
|
|
|
B) FIXED ASSETS |
110.474.621,00 |
123.596.053,00 |
154.865.823,00 |
|
I. Incorporation costs |
|
|
|
|
II. Intangible fixed assets |
13.225.120,00 |
12.600.337,00 |
12.062.914,00 |
|
R & D expenses |
|
|
|
|
Concessions, patents, licences , trademarks |
113.226,00 |
647.263,00 |
833.839,00 |
|
Goodwill |
|
|
|
|
Acquired rights from finance leases |
20.147.951,00 |
18.069.707,00 |
18.866.849,00 |
|
Software |
3.309,00 |
3.309,00 |
3.309,00 |
|
Leasing |
985.061,00 |
985.061,00 |
|
|
Cash advance |
|
|
|
|
Provisions |
|
|
|
|
Depreciation |
-8.024.427,00 |
-7.105.003,00 |
-7.641.083,00 |
|
III. Tangible fixed assets |
85.164.223,00 |
83.867.492,00 |
101.294.122,00 |
|
Property, plant and equipment |
19.312.412,00 |
19.506.243,00 |
20.033.614,00 |
|
Machinery, equipment and other |
103.307.593,00 |
105.760.277,00 |
135.177.998,00 |
|
Other property plant and equipment |
|
|
|
|
Prepaid expenses on fixed assets |
714.821,00 |
3.734.313,00 |
2.153.688,00 |
|
Other assets |
|
|
|
|
Provisions |
-2.500.000,00 |
-2.500.000,00 |
-2.500.000,00 |
|
Depreciation |
-35.670.603,00 |
-42.633.341,00 |
-53.571.178,00 |
|
IV. Financial fixed assets |
12.085.278,00 |
27.128.224,00 |
41.508.787,00 |
|
Shares in affiliated companies |
15.123.881,00 |
27.586.659,00 |
40.598.106,00 |
|
Receivables in affiliated companies |
|
|
|
|
Shares in associated companies |
|
|
|
|
Loans to associated companies |
|
|
|
|
Securities |
|
|
|
|
Other loans |
190.488,00 |
|
|
|
Long term deposits and guarantees |
2.783.614,00 |
2.820.980,00 |
3.459.327,00 |
|
Provisions |
-6.012.705,00 |
-3.279.415,00 |
-2.548.646,00 |
|
Taxes receivable |
|
|
|
|
V.Owners equity |
|
|
|
|
VI.Long term trade liabilities |
|
|
|
|
C) DEFERRED EXPENSES |
6.421,00 |
1.837,00 |
97.171,00 |
|
D) CURRENT ASSETS |
86.129.669,00 |
90.839.656,00 |
99.022.706,00 |
|
I. Shareholders by required outlays |
|
|
|
|
II. Stocks |
25.701.286,00 |
34.213.851,00 |
48.132.732,00 |
|
Goods available for sale |
23.865.341,00 |
32.599.050,00 |
47.541.770,00 |
|
Raw material inventory |
1.835.945,00 |
1.614.801,00 |
590.962,00 |
|
Work in Progress |
|
|
|
|
Finished goods |
|
|
|
|
Subproducts and recycled materials |
|
|
|
|
Cash advance |
|
|
|
|
Provisions |
|
|
|
|
III. Debtors |
16.199.103,00 |
18.687.539,00 |
20.084.495,00 |
|
Clients |
8.489.536,00 |
7.086.908,00 |
5.653.555,00 |
|
Amounts owned by affiliated companies |
5.099.160,00 |
6.617.830,00 |
8.461.903,00 |
|
Amounts owned by associated companies |
|
|
|
|
Other debts |
819.241,00 |
1.992.632,00 |
1.882.239,00 |
|
Staff Expenses |
62.372,00 |
5.349,00 |
2.538,00 |
|
Government |
2.260.543,00 |
2.984.820,00 |
4.567.455,00 |
|
Provisions |
-531.749,00 |
|
-483.195,00 |
|
IV. Temporary financial investment |
41.376.946,00 |
36.488.311,00 |
29.955.548,00 |
|
Shares in affiliated companies |
|
|
|
|
Receivables in affiliated companies |
35.388.772,00 |
36.413.923,00 |
29.337.978,00 |
|
Shares in associated companies |
|
|
|
|
Loans to associated companies |
|
|
|
|
Short term investment |
|
|
|
|
Other loans |
5.988.174,00 |
74.388,00 |
617.570,00 |
|
Short Term Deposit and guarantees |
|
|
|
|
Provisions |
|
|
|
|
V. Short-term own shares |
|
|
|
|
VI. Treasury |
2.801.380,00 |
1.449.955,00 |
849.931,00 |
|
VII. Periodification adjustments |
50.954,00 |
|
|
|
ASSETS (A + B + C + D) |
196.610.711,00 |
214.437.546,00 |
253.985.700,00 |
Assets composition


Liabilities
Figures given in €
|
|
31/01/2005 (12) |
31/01/2006 (12) |
31/01/2007 (12) |
|
A) SHAREHOLDERS EQUITY |
117.594.611,00 |
117.506.100,00 |
136.025.081,00 |
|
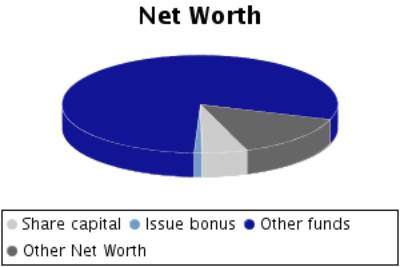
I. Share capital |
7.332.348,00 |
7.332.348,00 |
7.332.348,00 |
|
II. Issue bonus |
1.202.024,00 |
1.202.024,00 |
1.202.024,00 |
|
III.Revaluation reserve |
786.332,00 |
786.332,00 |
786.332,00 |
|
IV.Reserves |
78.453.783,00 |
108.273.909,00 |
108.185.394,00 |
|
Retained earnings |
1.466.470,00 |
1.466.470,00 |
1.466.470,00 |
|
Sinking fund from owner equity |
|
|
|
|
Reserve for the parent company capital |
|
|
|
|
Statutory reserve |
|
|
|
|
Other funds |
76.987.313,00 |
106.807.439,00 |
106.718.924,00 |
|
Capital adjustments in Euros |
|
|
|
|
V.Results from previous years |
|
|
|
|
Carry Over |
|
|
|
|
Prior years losses |
|
|
|
|
Loans from
partners for losses compensation |
|
|
|
|
VI.Profit and Losses |
29.820.124,00 |
49.911.487,00 |
43.518.983,00 |
|
VII.Dividend paid during the year |
|
-50.000.000,00 |
-25.000.000,00 |
|
VIII.Own shares for capital reduction |
|
|
|
|
B) DEFERRED INCOME |
3.935.471,00 |
6.489.105,00 |
7.838.397,00 |
|
Capital grants |
3.926.343,00 |
5.781.562,00 |
7.838.397,00 |
|
Positive change difference |
9.128,00 |
707.543,00 |
|
|
Other deferred income |
|
|
|
|
Fiscal deferred income |
|
|
|
|
C) PROVISIONS FOR LIABILITIES AND EXPENSES |
9.383,00 |
9.383,00 |
602.984,00 |
|
Provision for pensions plans |
9.383,00 |
9.383,00 |
9.383,00 |
|
Provision for taxes |
|
|
|
|
Other provisions |
|
|
593.601,00 |
|
Reversion fund |
|
|
|
|
D) LONG TERM LIABILITIES |
1.149.418,00 |
1.015.684,00 |
342.239,00 |
|
I.Negotiable bonds and other negotiable values |
|
|
|
|
Non convertible securities |
|
|
|
|
Convertible securities |
|
|
|
|
Other convertible debentures |
|
|
|
|
II.Debt with bank entities |
121.880,00 |
|
|
|
Long term bank loans |
121.880,00 |
|
|
|
Leasing |
|
|
|
|
III.Debts with associated and affiliated
companies |
|
|
|
|
With affiliated companies |
|
|
|
|
Associated companies |
|
|
|
|
IV. Other creditors |
1.027.538,00 |
1.015.684,00 |
342.239,00 |
|
Bills payable |
|
|
|
|
Other debts |
577.538,00 |
565.684,00 |
342.239,00 |
|
Long term deposit and guaranties |
450.000,00 |
450.000,00 |
|
|
Taxes receivable |
|
|
|
|
V. Deferred debts on shares |
|
|
|
|
From affiliated companies |
|
|
|
|
From associated companies |
|
|
|
|
Other companies |
|
|
|
|
VI. Long term debt with creditor |
|
|
|
|
E) SHORT TERM LIABILITIES |
73.921.828,00 |
89.417.274,00 |
109.176.999,00 |
|
I.Negotiable bonds and other negotiable values |
|
|
|
|
Non convertible securities |
|
|
|
|
Convertible securities |
|
|
|
|
Other convertible debentures |
|
|
|
|
Interests from bonds |
|
|
|
|
II.Debt with bank entities |
275.372,00 |
305.863,00 |
649.711,00 |
|
Loans and other debts |
275.372,00 |
305.863,00 |
649.711,00 |
|
Debt interest |
|
|
|
|
Leasing |
|
|
|
|
III. Short term debts with associated and
affiliated companies |
25.863.002,00 |
30.969.593,00 |
32.497.862,00 |
|
With affiliated companies |
25.863.002,00 |
30.969.593,00 |
32.497.862,00 |
|
Associated companies |
|
|
|
|
IV. Commercial creditors |
39.891.151,00 |
49.275.485,00 |
65.920.706,00 |
|
Accounts payable |
|
|
|
|
Expenses |
39.891.151,00 |
49.275.485,00 |
65.920.706,00 |
|
Bills payable |
|
|
|
|
V. Other non-commercial debt |
7.892.303,00 |
8.848.492,00 |
10.073.158,00 |
|
Government |
3.513.662,00 |
5.137.522,00 |
6.440.705,00 |
|
Bills payable |
|
|
|
|
Other debts |
185.188,00 |
107.701,00 |
199.331,00 |
|
Accounts receivable |
4.193.453,00 |
3.603.269,00 |
3.433.122,00 |
|
Short term deposits and guarantees |
|
|
|
|
VI. Provisions for current assets |
|
|
|
|
VII. Periodification adjustments |
|
17.841,00 |
35.562,00 |
|
F) SHORT TERM PROVISIONS FOR LIABILITIES AND
EXPENSES |
|
|
|
|
LIABILITIES (A + B + C + D + E + F) |
196.610.711,00 |
214.437.546,00 |
253.985.700,00 |
Liabilities
Composition

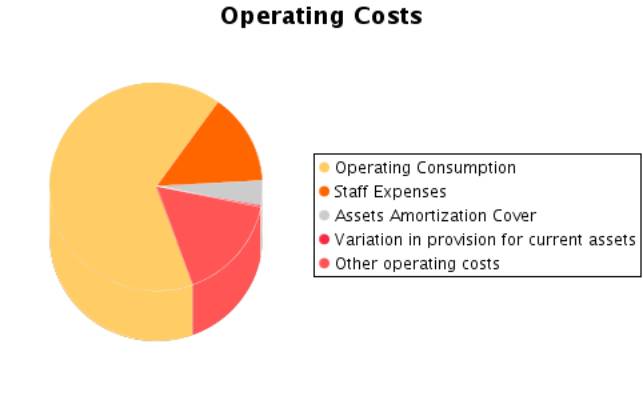
PROFIT AND LOSS ACCOUNT
Itams of the Profit and Loss Account
Figures given in €
|
|
31/01/2005 (12) |
31/01/2006 (12) |
31/01/2007 (12) |
|
A) EXPENSES (A.1 a A.16) |
308.915.881,00 |
331.464.968,00 |
376.679.055,00 |
|
A.1.Reduction in stocks of finished goods and
work in progress |
|
|
|
|
A.2.Supplies |
190.300.337,00 |
203.830.841,00 |
234.386.640,00 |
|
Material consumed |
165.540.750,00 |
177.874.655,00 |
211.666.015,00 |
|
Raw materials consumed |
19.485.111,00 |
19.586.513,00 |
16.652.948,00 |
|
Other expenses |
5.274.476,00 |
6.369.673,00 |
6.067.677,00 |
|
A.3. Labour cost |
41.705.647,00 |
45.164.669,00 |
50.683.152,00 |
|
Wages |
32.693.781,00 |
34.853.601,00 |
39.259.630,00 |
|
Social security expenses |
9.011.866,00 |
10.311.068,00 |
11.423.522,00 |
|
A.4. Assets depreciation |
12.805.191,00 |
12.267.407,00 |
13.879.786,00 |
|
A.5.Variance in the traffic provisions |
2.458.987,00 |
1.954.407,00 |
880.660,00 |
|
Variance in provision for inventory |
|
|
|
|
Variance in provision for bad debts |
|
|
|
|
Variance in provision for other current assets |
2.458.987,00 |
1.954.407,00 |
880.660,00 |
|
A.6. Other operating costs |
46.764.759,00 |
48.189.553,00 |
58.348.621,00 |
|
External costs |
45.664.793,00 |
46.669.387,00 |
56.795.026,00 |
|
Taxes |
929.535,00 |
928.204,00 |
983.631,00 |
|
Other day to day expenses |
170.431,00 |
591.962,00 |
569.964,00 |
|
Allowance to reversion fund |
|
|
|
|
A.I.OPERATING
RESULT (B.1+B.2+B.3+B.4-A.1-A.2-A.3-A.4-A.5-A.6) |
43.462.249,00 |
65.803.153,00 |
59.282.980,00 |
|
A.7.Financial expenses and similar |
128.517,00 |
27.413,00 |
16.192,00 |
|
Debts with related companies |
107.106,00 |
|
|
|
Debts with associated companies |
2,00 |
|
|
|
Other companies debts By debts with third parties and similar expenses |
21.409,00 |
27.413,00 |
16.192,00 |
|
Losses from financial investments |
|
|
|
|
A.8. Variation
in financial investment provision |
|
|
|
|
A.9.Negative
exchange difference |
2.392.861,00 |
1.081.531,00 |
769.690,00 |
|
A.II.POSITIVE
FINANCIAL RESULTS (B.5+B.6+B.7+B.8-A.7-A.8-A.9) |
|
3.056.982,00 |
1.151.881,00 |
|
A.III.PROFIT
FROM ORDINARY ACTIVITIES (A.I+A.II-B.I-B.II) |
42.089.554,00 |
68.860.135,00 |
60.434.861,00 |
|
A.10. Variation
in provision in fixed assets |
-3.008.076,00 |
-2.733.290,00 |
-187.965,00 |
|
A.11. Losses in
fixed assets |
|
264.505,00 |
729,00 |
|
A.12. Losses
from own shares and bonds |
|
|
|
|
A.13.
Extraordinary charges |
|
|
51.098,00 |
|
A.14.Other
exercises’ expenses and losses |
|
|
|
|
A.IV.POSITIVE
EXTRAORDINARY RESULT (B.9+B.10+B.11+B.12+B.13-A.10-A.11-A.12-A.13-A.14) |
3.098.228,00 |
2.469.284,00 |
934.574,00 |
|
A.V.PROFIT
BEFORE TAXES (A.III+A.IV-B.III-B.IV) |
45.187.782,00 |
71.329.419,00 |
61.369.435,00 |
|
A.15.Corporate
Taxes |
15.364.356,00 |
21.415.168,00 |
17.846.002,00 |
|
A.16. Other
taxes |
3.302,00 |
2.764,00 |
4.450,00 |
|
A.VI.EXERCISE
RESULT (PROFIT) (A.V-A.14-A.15) |
29.820.124,00 |
49.911.487,00 |
43.518.983,00 |
|
B) INCOMES (B.1
a B13) |
338.736.005,00 |
381.376.455,00 |
420.198.038,00 |
|
B.1. Turnover |
335.471.151,00 |
374.787.634,00 |
415.109.659,00 |
|
Sales |
335.471.151,00 |
374.787.634,00 |
415.109.659,00 |
|
Services
provided |
|
|
|
|
Refunds and sale
reminders |
|
|
|
|
B.2.Increase in
inventory of finished goods and works in progress |
|
|
|
|
B.3.Expenses
capitalized |
|
|
|
|
B.4. Other
operating income |
2.026.019,00 |
2.422.396,00 |
2.352.180,00 |
|
Other incomes |
2.016.539,00 |
2.392.652,00 |
2.320.727,00 |
|
Grants |
9.480,00 |
29.744,00 |
31.453,00 |
|
Excess in
provision for liabilities and charges |
|
|
|
|
B.I.OPERATING
LOSSES (A.1+A.2+A.3+A.4+A.5+A.6-B.1-B.2-B.3-B.4) |
|
|
|
|
B.5.Incomes from
share participations |
99.732,00 |
1.002.693,00 |
|
|
From affiliated
companies |
99.732,00 |
1.002.693,00 |
|
|
From associated
companies |
|
|
|
|
From other companies |
|
|
|
|
B.6.Income from other securities and credits to
fixed assets |
|
|
|
|
From affiliated companies |
|
|
|
|
From associated companies |
|
|
|
|
Other companies |
|
|
|
|
B.7.Other interests and similar |
165.509,00 |
1.026.790,00 |
1.177.909,00 |
|
From affiliated companies |
|
947.902,00 |
1.081.440,00 |
|
From associated companies |
|
|
|
|
Other Interests |
165.509,00 |
78.888,00 |
96.469,00 |
|
Profits from investments |
|
|
|
|
B.8. Positive change difference |
883.442,00 |
2.136.443,00 |
759.854,00 |
|
B.II. NEGATIVE FINANCIAL RESULTS
(A.7+A.8+A.9-B.5-B.6-B.7-B.8) |
1.372.695,00 |
|
|
|
B.III.LOSSES FROM ORDINARY ACTIVITIES
(B.I+B.II-A.I-A.II) |
|
|
|
|
B.9.B.9. Gains from disposal of fixed assets |
90.152,00 |
499,00 |
798.436,00 |
|
B.10.Gains from dealing in own shares |
|
|
|
|
B.11. Paid in surplus |
|
|
|
|
B.12. Extraordinary income |
|
|
|
|
B.13.Other year’s income and profits |
|
|
|
|
B.IV.NEGATIVE EXTRAORDINARY LOSSES
(A.10+A.11+A.12+A.13+A.14-B.9-B.10-B.11-B.12-B.13) |
|
|
|
|
B.V.LOSS BEFORE TAXES (B.III+B.IV-A.III-A.IV) |
|
|
|
|
B.VI.EXERCISE RESULTS (LOSS) (B.V+A.14+A.15) |
|
|
|
Composition of the
Profit and Loss Account


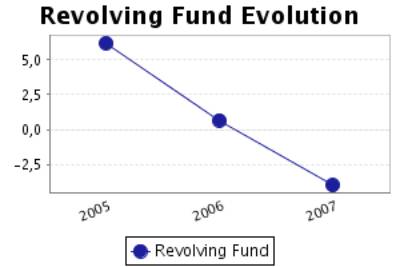
FINANCIAL BALANCE
Here the Main Capital Amounts of the company and the Revolving Fund
Evolution are analysed.
Financial Balance Table
Figures given in €
|
|
31/01/2005 (12) |
% |
31/01/2006 (12) |
% |
31/01/2007 (12) |
% |
|
A) DUE FROM
SHAREHOLDERS FOR UNCALLED CAPITAL |
|
|
|
|
|
|
|
B) FIXED ASSETS |
110.474.621,00 |
56,19 |
123.596.053,00 |
57,64 |
154.865.823,00 |
60,97 |
|
C) DEFERRED
EXPENSES |
6.421,00 |
0,00 |
1.837,00 |
0,00 |
97.171,00 |
0,04 |
|
D) CURRENT
ASSETS |
86.129.669,00 |
43,81 |
90.839.656,00 |
42,36 |
99.022.706,00 |
38,99 |
|
ASSETS (A + B +
C + D) |
196.610.711,00 |
|
214.437.546,00 |
|
253.985.700,00 |
|
|
|
||||||
|
A) SHAREHOLDERS
EQUITY |
117.594.611,00 |
59,81 |
117.506.100,00 |
54,80 |
136.025.081,00 |
53,56 |
|
B) DEFERRED
INCOME |
3.935.471,00 |
2,00 |
6.489.105,00 |
3,03 |
7.838.397,00 |
3,09 |
|
C) PROVISIONS
FOR LIABILITIES AND EXPENSES |
9.383,00 |
0,00 |
9.383,00 |
0,00 |
602.984,00 |
0,24 |
|
D) LONG TERM
LIABILITIES |
1.149.418,00 |
0,58 |
1.015.684,00 |
0,47 |
342.239,00 |
0,13 |
|
E) SHORT TERM
LIABILITIES |
73.921.828,00 |
37,60 |
89.417.274,00 |
41,70 |
109.176.999,00 |
42,99 |
|
F) SHORT TERM
PROVISIONS FOR LIABILITIES AND EXPENSES |
|
|
|
|
|
|
|
LIABILITIES (A +
B + C + D + E + F) |
196.610.711,00 |
|
214.437.546,00 |
|
253.985.700,00 |
|
Financial Balance
Composition

Comments on Financial Balance
In the 2005, the assets of the company were formed in 56,19% of Fixed
Assets and in 43,81% of Current Assets.This assets were financed in 61,81% with
own capitals, and in 0,59% with long term debt and in 37,60% with current
liabilities.
The result of this financial structure is a positive turnover fund of
12.207.841,00 Euros, which is equivalent to 6,21% proportion of the
company’s total assets.
In the 2006, the assets of the company were formed in 57,64% of Fixed
Assets and in 42,36% of Current Assets.This assets were financed in 57,82% with
own capitals, and in 0,48% with long term debt and in 41,70% with current
liabilities.
The result of this financial structure is a positive turnover fund of
1.422.382,00 Euros, which is equivalent to 0,66% proportion of the
company’s total assets.
This measure has diminished with respect to the previous exercise in
88,35% having also diminished its proportion with respect to the total assets
of the company.
In the 2007, the assets of the company were formed in 61,01% of Fixed
Assets and in 38,99% of Current Assets.This assets were financed in 56,64% with
own capitals, and in 0,37% with long term debt and in 42,99% with current
liabilities.
The result of this financial structure is a negative turnover fund of
-10.154.293,00 Euros, which is equivalent to -4,00% proportion of the company’s
total assets.
This measure has diminished with respect to the previous exercise in
813,89% having also diminished its proportion with respect to the total assets
of the company.
RATIOS
Main Ratios
|
|
31/01/2005 (12) |
31/01/2006 (12) |
31/01/2007 (12) |
|
STRUCTURAL RATIOS |
|
|
|
|
Management fund |
12.207.841,00 |
1.422.382,00 |
-10.154.293,00 |
|
Management Fund Requirement |
-31.695.113,00 |
-36.210.021,00 |
-40.310.061,00 |
|
Indebtedness (%) |
38,19 |
42,18 |
43,36 |
|
External Funds on Net Worth |
0,62 |
0,73 |
0,76 |
|
GENERAL ACTIVITY RATIO |
|
|
|
|
Turnover Increase (%) |
28,46 |
11,72 |
10,76 |
|
Added value growth (%) |
57,14 |
24,65 |
-0,37 |
|
Cash Flow |
42.076.226,00 |
61.400.011,00 |
58.091.464,00 |
|
Labour Productivity |
2,41 |
2,77 |
2,46 |
|
Assets turnover |
1,71 |
1,75 |
1,63 |
|
Breakdown Point |
237.845.664,32 |
234.046.312,02 |
282.280.328,96 |
|
Security Margin of the Breakdown Point (%) |
29,53 |
37,95 |
32,38 |
|
ACTIVITY RATIOS |
|
|
|
|
Average Payment Period |
75 |
87 |
101 |
|
Average Collection Period |
17 |
18 |
17 |
|
Inventory Turnover Period |
28 |
33 |
42 |
|
SOLVENCY RATIOS |
|
|
|
|
Payback Capacity |
0,56 |
0,68 |
0,53 |
|
Assets Guarantee |
2,62 |
2,37 |
2,31 |
|
Short Term Debts Proportion (%) |
98,46 |
98,87 |
99,14 |
|
Interest Coverage |
341,16 |
2.187,53 |
3.430,29 |
|
LIQUIDITY RATIOS |
|
|
|
|
Current Ratio |
1,16 |
1,02 |
0,91 |
|
Immediate liquidity |
0,60 |
0,42 |
0,28 |
|
Treasury |
43.902.954,00 |
37.632.403,00 |
30.155.768,00 |
|
Sales on Current Assets |
1.402 |
1.485 |
1.509 |
Results Analysis
Ratios
|
|
31/01/2005 (12) |
31/01/2006 (12) |
31/01/2007 (12) |
|
Economic profitability (%) |
22,11 |
30,69 |
23,34 |
|
Operating Profitability (%) |
12,96 |
17,56 |
14,28 |
|
Equity gearing |
1,57 |
1,81 |
1,80 |
|
Financial profitability (%) |
24,54 |
40,25 |
30,25 |
|
General Profitability (%) |
8,89 |
13,32 |
10,48 |
Comments on the
Results Analysis Ratios
The economic profitability in the year2006 achieved a 30,69% positive
level, due to a 17,56% economic margin and to an assets turnover of1,75%.
The economic profitability in the year has increased from 22,11% up to
30,69%. This growth is due to the economic margin increase, from 12,96% to the
current 17,56Y%, and to the assets turnover index, which in the last period has
achieved 1,75, compared to 1,71 del 2005.
Financial profitability on 2006 achieved a 40,25%.
The company’s financial structure has instigated its economic profitability
with an indebtedness level of 1,81.
The general profitability on 2006 achieved a 13,32%.
The economic profitability in the year2007 achieved a 23,34% positive
level, due to a 14,28% economic margin and to an assets turnover of1,63%.
The economic profitability in the year has reduced from 30,69% up to
23,34% of2007, even if it remains positive. This fall is due to the decrease in
operating profitability, that has passe from 17,56% to 14,28%, as assets
turnover whose index has passed from 1,75 to 1,63%.
Financial profitability on 2007 achieved a 30,25%.
The company’s financial structure has instigated its economic
profitability with an indebtedness level of 1,80.
The general profitability on 2007 achieved a 10,48%.
SECTORIAL ANÁLYSIS
Large Capital Amounts and Financial Balance
Figures given in %
|
|
COMPANY (2007) |
SECTOR |
DIFFERENCE |
DIFFERENCE RELATIVE |
|
|
|
|
|
|
ASSETS |
|
|
|
|
|
|
|
|
|
|
A) DUE FROM
SHAREHOLDERS FOR UNCALLED CAPITAL |
|
0,00 |
|
|
|
|
|
|
|
|
B) FIXED ASSETS |
60,97 |
59,06 |
1,91 |
3,24 |
|
|
|
|
|
|
C) DEFERRED
EXPENSES |
0,04 |
0,18 |
-0,14 |
-77,27 |
|
|
|
|
|
|
D) CURRENT
ASSETS |
38,99 |
40,77 |
-1,78 |
-4,37 |
|
|
|
|
|
|
ASSETS (A + B + C + D) |
100 |
100 |
|
|
|
|
|
|
|
|
|
|
|
|
|
|
|
|
|
|
|
|
COMPANY (2007) |
SECTOR |
DIFFERENCE |
DIFFERENCE RELATIVE |
|
|
|
|
|
|
LIABILITIES |
|
|
|
|
|
|
|
|
|
|
A) SHAREHOLDERS
EQUITY |
53,56 |
40,58 |
12,98 |
31,99 |
|
|
|
|
|
|
B) DEFERRED
INCOME |
3,09 |
1,29 |
1,80 |
139,35 |
|
|
|
|
|
|
C) PROVISIONS
FOR LIABILITIES AND EXPENSES |
0,24 |
0,92 |
-0,68 |
-74,03 |
|
|
|
|
|
|
D) LONG TERM
LIABILITIES |
0,13 |
12,60 |
-12,47 |
-98,97 |
|
|
|
|
|
|
E) SHORT TERM
LIABILITIES |
42,99 |
44,59 |
-1,60 |
-3,59 |
|
|
|
|
|
|
F) SHORT TERM PROVISIONS
FOR LIABILITIES AND EXPENSES |
|
0,01 |
|
|
|
|
|
|
|
|
LIABILITIES (A + B + C + D + E + F) |
100 |
100 |
|
|
|
|
|
|
|
Sectorial Financial
Balance Comparison


Comments to the Sectorial Analysis
In the 2007, the assets of the company were formed in 61,01% of fixed assets
and in 38,99Current Assets % In the sector, the proportion of fixed assets was
of 59,23%, 3,01% inferior, and the proportion of current assets was of 40,77%,
4,37% superior.
The assets were financed in the company in 56,64% with own capitals , in
0,37% with fixed liabilities and in 42,99% with current liabilities In the
sector, the self financing represented 41,87%, 35,27% inferior. On the other
hand the long term debts represented in the sector an average of 13,53%
financing, with a relative difference of 97,26% favourable to the sectorAnd,
short term liabilities represented in the sector an average of 44,60%
financing, with a relative difference of 3,61% favourable to the sector
The result of this company’s financial structure is a turnover fund that
represents -4,00% of the total assets; in the sector, this same proportion is
-3,83%, therefore, we can say that the company’s turnover fund is 4,41% smaller
than the sector one.
Analytical Account of Results
Figures given in %
|
|
COMPANY (2007) |
SECTOR |
DIFFERENCE |
DIFFERENCE RELATIVE |
|
Turnover |
99,44 |
98,31 |
1,13 |
1,15 |
|
Other operating income |
0,56 |
1,69 |
-1,13 |
-66,82 |
|
Production Value |
100,00 |
100,00 |
0,00 |
0,00 |
|
Operating expenses |
56,15 |
58,51 |
-2,36 |
-4,03 |
|
Other operation expenses |
13,98 |
15,13 |
-1,15 |
-7,59 |
|
Added value |
29,88 |
26,37 |
3,51 |
13,33 |
|
Labour cost |
12,14 |
12,00 |
0,14 |
1,19 |
|
Gross Economic Result |
17,74 |
14,37 |
3,37 |
23,46 |
|
Assets depreciation |
3,32 |
3,47 |
-0,15 |
-4,32 |
|
Variation in provision for current assets and bad debt losses |
0,21 |
0,34 |
-0,13 |
-37,87 |
|
Net Economic Result |
14,20 |
10,56 |
3,64 |
34,46 |
|
Financial income |
0,46 |
0,78 |
-0,32 |
-40,72 |
|
Financial Charges |
0,19 |
0,81 |
-0,62 |
-76,63 |
|
Variation in financial investment provision |
|
0,04 |
|
|
|
Ordinary Activities Result |
14,48 |
10,48 |
4,00 |
38,13 |
|
Extraordinary income |
0,19 |
0,40 |
-0,21 |
-52,62 |
|
Extraordinary charges |
0,01 |
0,37 |
-0,36 |
-97,30 |
|
Variation in provision in fixed assets |
-0,05 |
0,43 |
-0,48 |
-111,55 |
|
Results before Taxes |
14,70 |
10,08 |
4,62 |
45,83 |
|
Corporate taxes |
4,28 |
2,96 |
1,32 |
44,45 |
|
Net Result |
10,42 |
7,12 |
3,30 |
46,41 |
|
Assets depreciation |
3,32 |
3,47 |
-0,15 |
-4,32 |
|
Change of Provisions |
0,17 |
0,81 |
-0,64 |
-79,06 |
|
Net Self-Financing |
13,92 |
11,40 |
2,52 |
22,12 |
Main Ratios
|
|
COMPANY (2007) |
PTILE25 |
PTILE50 |
PTILE75 |
|
STRUCTURAL RATIOS |
|
|
|
|
|
Management fund |
-10.154.293,00 |
-4.755,94 |
3.725,52 |
14.207,06 |
|
Management Fund
Requirement |
-40.310.061,00 |
-23.223,87 |
-4.001,36 |
2.800,00 |
|
Indebtedness (%) |
43,36 |
40,13 |
63,80 |
73,96 |
|
External Funds on Net Worth |
0,76 |
0,67 |
1,76 |
2,84 |
|
GENERAL ACTIVITY
RATIO |
|
|
|
|
|
Turnover Increase (%) |
10,76 |
3,25 |
12,57 |
23,87 |
|
Added value growth (%) |
-0,37 |
2,70 |
18,86 |
27,32 |
|
Cash Flow |
58.091.464,00 |
4.082,45 |
8.477,00 |
14.773,88 |
|
Labour Productivity |
2,46 |
1,66 |
2,12 |
2,55 |
|
Assets turnover |
1,63 |
1,23 |
1,56 |
2,30 |
|
Breakdown Point |
282.280.328,96 |
47.437.066,19 |
69.334.505,75 |
136.462.714,99 |
|
Security Margin of
the Breakdown Point (%) |
32,38 |
11,54 |
19,17 |
32,84 |
|
ACTIVITY RATIOS |
|
|
|
|
|
Average Payment Period |
101 |
45 |
100 |
126 |
|
Average Collection Period |
17 |
8 |
30 |
57 |
|
Inventory Turnover Period |
42 |
29 |
44 |
78 |
|
SOLVENCY RATIOS |
|
|
|
|
|
Payback Capacity |
0,53 |
0,14 |
0,26 |
0,42 |
|
Assets Guarantee |
2,31 |
1,34 |
1,54 |
2,44 |
|
Short Term Debts Proportion (%) |
99,14 |
83,44 |
97,14 |
99,90 |
|
Interest Coverage |
3.430,29 |
5,76 |
18,33 |
63,57 |
|
LIQUIDITY RATIOS |
|
|
|
|
|
Current Ratio |
0,91 |
0,89 |
1,16 |
1,61 |
|
Immediate liquidity |
0,28 |
0,03 |
0,17 |
0,46 |
|
Treasury |
30.155.768,00 |
314,08 |
3.132,13 |
10.684,00 |
|
Sales on Current Assets |
1.509 |
805 |
1.187 |
1.718 |
Results Analysis
Ratios
|
|
COMPANY (2007) |
PTILE25 |
PTILE50 |
PTILE75 |
|
Economic profitability (%) |
23,34 |
6,40 |
10,79 |
24,28 |
|
Operating Profitability (%) |
14,28 |
3,51 |
7,77 |
12,12 |
|
Equity gearing |
1,80 |
1,59 |
2,52 |
3,70 |
|
Financial profitability (%) |
30,25 |
10,13 |
21,20 |
36,85 |
|
General Profitability (%) |
10,48 |
2,23 |
5,02 |
9,13 |
NOTES
ABOUT YOUR REQUEST:
The subject’s correct address is Av. Gonzalo Navaro, 37-43 pol. Ind.
Rio Do Pozo, 15570 Narón, A Coruña. The address included in your
enquiry belongs to(a branch.
In spite of investigations using every source available (public and
private), no additional details than those contained in this report
are available. .
FOREIGN EXCHANGE
RATES
|
Currency |
Unit
|
Indian Rupees |
|
US Dollar |
1 |
Rs.49.25 |
|
UK Pound |
1 |
Rs.80.36 |
|
Euro |
1 |
Rs.62.84 |
RATING
EXPLANATIONS
|
RATING |
STATUS |
PROPOSED CREDIT LINE |
|
|
>86 |
Aaa |
Possesses an extremely sound financial base with the strongest
capability for timely payment of interest and principal sums |
Unlimited |
|
71-85 |
Aa |
Possesses adequate working capital. No caution needed for credit
transaction. It has above average (strong) capability for payment of interest
and principal sums |
Large |
|
56-70 |
A |
Financial & operational base are regarded healthy. General
unfavourable factors will not cause fatal effect. Satisfactory capability for
payment of interest and principal sums |
Fairly Large |
|
41-55 |
Ba |
Overall operation is considered normal. Capable to meet normal
commitments. |
Satisfactory |
|
26-40 |
B |
Unfavourable & favourable factors carry similar weight in credit consideration.
Capability to overcome financial difficulties seems comparatively below
average. |
Small |
|
11-25 |
Ca |
Adverse factors are apparent. Repayment of interest and principal sums
in default or expected to be in default upon maturity |
Limited with
full security |
|
<10 |
C |
Absolute credit risk exists. Caution needed to be exercised |
Credit not
recommended |
|
NR |
In view of the lack of information, we have no basis upon which to
recommend credit dealings |
No Rating |
|
This score serves as a reference to assess SC’s credit risk
and to set the amount of credit to be extended. It is calculated from a
composite of weighted scores obtained from each of the major sections of this
report. The assessed factors and their relative weights (as indicated through
%) are as follows:
Financial
condition (40%) Ownership
background (20%) Payment
record (10%)
Credit history
(10%) Market trend
(10%) Operational
size (10%)