![]()
MIRA
INFORM REPORT
|
Report Date : |
06.11.2008 |
IDENTIFICATION
DETAILS
|
Name : |
SIEMSGLUSS IBERICA SA |
|
|
|
|
Registered Office : |
Poligono Industrial
Sant Antoni, 6 (Nav 2 Apdo 168), Cp 08620, Sant Vicenc Dels
Horts Barcelona |
|
|
|
|
Country : |
Spain |
|
|
|
|
Financials (as on) : |
31.12.2006 |
|
|
|
|
Date of Incorporation : |
|
|
|
|
|
Legal Form : |
Joint Stock Company |
|
|
|
|
Line of Business : |
RATING &
COMMENTS
|
MIRA’s Rating : |
Ba |
|
RATING |
STATUS |
PROPOSED CREDIT LINE |
|
|
41-55 |
Ba |
Overall operation is considered normal. Capable to meet normal
commitments. |
Satisfactory |
|
Maximum Credit Limit : |
188.002,60 € |
|
|
|
|
Status : |
Satisfactory |
|
|
|
|
Payment Behaviour : |
No Complaints |
|
|
|
|
Litigation : |
Clear |
FINANCIAL REPORT
SIEMSGLUSS IBERICA SA
TAX NUMBER: A08931198
EXECUTIVE SUMMARY
Identification
Current Business Name: SIEMSGLUSS IBERICA
SA
Other names: NO
Current Address: POLIGONO INDUSTRIAL
SANT ANTONI, 6 (NAV 2 APDO 168), CP 08620, SANT VICENC DELS
HORTS BARCELONA
Telephone number: 936768787 Fax: 936769933
URL: www.siemsgluss.com
Corporate e-mail:
siemsgluss@siemsgluss.com
Commercial Risk
Credit Appraisal: 188.002,60 €
RAI: NO
Legal Actions: NO
Financial
Information
Latest sales known (2007): 17.066.597,28 € (Estimated)
Latest Balance sheet sales (2006): 16.569.511,93 € (MERCANTILE REGISTER)
Result: 127.639,77 €
Total Assets:
6.075.864,4 €
Social Capital: 533.267,30 €
Employees: 11
Commercial Information
Constitution Date: 31/07/1984
Business activity: Wholesale of
pharmaceutical products
NACE Code: 5146
International Operations: Imports and
Exports
Corporate Structure
Sole Administrator:
SALDANHA
ALBURQUERQUE JERONIMO FABIAN
Parent Company:
SALDANHA
ALBURQUERQUE JERONIMO FABIAN
Other Complementary Information
Latest proceeding published in BORME: 17/03/2008 Appointments
Latest press article: 24/05/1994 GACETA
NEG (INFORMATION ON LEGAL ANNOUNCE)
Bank Entities: Yes
Credit Appraisal
Maximum Credit
(from 0 a 6,000,000 €)
Favourable to 188.002,60 €
Rating Evolution

Financial Situation
Fiscal year2006
|
Treasury |
Good |
|
Indebtedness |
Important |
|
Profitability |
Null |
|
Balance |
Excellent |
Performance
|
Legal Actions |
None or Negligible |
|
Business
Trajectory |
Excellent |
COMPANY NOT REGISTERED IN THE R.A.I.
This company is not registered in the Disputed Bills register (R.A.I.)
DATE AND TIME OF THE CONSULTATION: 05/11/2008
13:11:54
INCIDENTS

Summary
LEGAL ACTIONS: No legal
incidences registered
CLAIM FILED AGAINST THE ADMINISTRATION: No administrative
claims registered
AFFECTED BY: No significant
element.
FINANCIAL ELEMENTS AND SECTORIAL
COMPARATIVE
FINANCIAL ELEMENTS
Figures given in €
|
|
2005 (12) |
2006 (12) |
2007 |
|
|
|
|
|
BALANCE SHEET
ANALYSIS |
|
|
|
|
|
|
|
|
OWN FUNDS |
969.122,63 |
1.052.129,90 |
|
|
|
|
|
|
DEBT |
3.606.196,16 |
5.023.734,50 |
|
|
|
|
|
|
FIXED ASSETS |
83.942,09 |
90.676,05 |
|
|
|
|
|
|
TOTAL ASSETS |
4.575.318,79 |
6.075.864,40 |
|
|
|
|
|
|
|
|
|
|
|
|
|
|
|
|
2005 (12) |
2006 (12) |
2007 |
|
|
|
|
|
PROFIT AND LOSS
ACCOUNT ANALYSIS |
|
|
|
|
|
|
|
|
SALES |
15.041.510,28 |
16.569.511,93 |
17.066.597,28 |
|
|
|
|
|
ADDED VALUE |
820.100,65 |
1.045.341,49 |
|
|
|
|
|
|
EBITDA |
375.594,28 |
501.611,70 |
|
|
|
|
|
|
EBIT |
358.229,61 |
479.829,97 |
|
|
|
|
|
|
NET RESULT |
89.628,81 |
127.639,77 |
|
|
|
|
|
Balance Sheets Items
Analysis
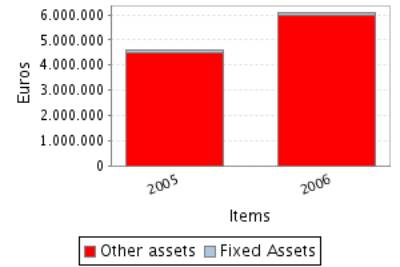

Balance Sheet Comments
Total assets of the company grew 32,80% between 2005 and 2006.
This growth has been inferior in the case of the fixed assets that
increased just in 8,02%.
This growth has been mainly financed with a debt increase of 39,31%.
Nevertheless the net worth increased 8,57%.
Profit and Loss Account Analysis

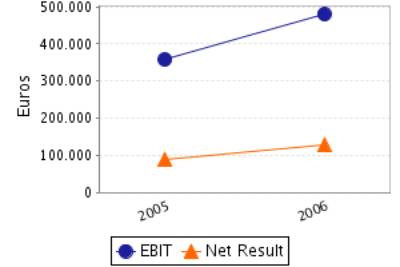
Profit and Loss Account Comments
The company’s sales figure grew 10,16% between 2005 and 2006.
The company’s EBIT grew 33,94% between 2005 and 2006.
This evolution implies an increase in the company’s operating
profitability.
The result of these variations is an increase of the company’s Economic
Profitability of 0,86% in the analysed period, being this profitability of
7,90% in the year 2006.
The company’s Net Result grew 42,41% between 2005 and 2006.
This evolution, compared to the EBIT’s performance, implies that the
financial and extraordinary activities have had a positive effect in the
company’s Financial Profitability.
The result of these variations is an increase of the company’s Economic
Profitability of 31,18% in the analysed period, being equal to 12,13% in the
year 2006.
ANNUAL FINANCIAL REPORT ADDITIONAL DATA
Source: annual financial report 2006
Results Distribution
Figures given in €
|
DISTRIBUTION
BASE |
DISTRIBUTION TO |
||
|
Profit and Loss |
127.639,77 |
Retained earnings |
0,00 |
|
Carry Over |
0,00 |
Voluntary Reserve |
63.819,89 |
|
Voluntary reserves |
0,00 |
Prior years losses |
0,00 |
|
Reserves |
0,00 |
Carry Over |
0,00 |
|
Other concepts |
0,00 |
Other funds |
0,00 |
|
Total of Amounts to be distributed |
127.639,77 |
Dividends |
63.819,88 |
|
|
|
Other Applications |
0,00 |
Auditing
Auditors’ opinion: FAVOURABLE WITH
RESERVATIONS
Auditor: MORISON AC SL
Auditing exceptions:
LA MEMORIA ADJUNTA NO INCLUYE LA INFORMACION REQUERIDA POR EL ARTICULO
127 TER DE LA LEY DE SOCIEDADES ANONIMAS.
COMPARATIVE SECTOR ANALYSIS
Values table
Figures expressed in %
|
|
COMPANY (2006) |
SECTOR |
DIFFERENCE |
DIFFERENCE RELATIVE |
|
|
|
|
|
|
BALANCE SHEET
ANALYSIS: % on the total assets |
|
|
|
|
|
|
|
|
|
|
OWN FUNDS |
17,32 |
38,61 |
-21,29 |
-55,15 |
|
|
|
|
|
|
DEBT |
82,68 |
61,39 |
21,29 |
34,69 |
|
|
|
|
|
|
FIXED ASSETS |
1,49 |
20,07 |
-18,58 |
-92,57 |
|
|
|
|
|
|
|
COMPANY (2006) |
SECTOR |
DIFFERENCE |
DIFFERENCE RELATIVE |
|
|
|
|
|
|
PROFIT AND LOSS
ACCOUNT ANALYSIS: % on the total operating income |
|
|
|
|
|
|
|
|
|
|
SALES |
100,00 |
98,43 |
1,57 |
1,59 |
|
|
|
|
|
|
ADDED VALUE |
6,31 |
15,12 |
-8,81 |
-58,27 |
|
|
|
|
|
|
EBIT |
2,90 |
4,75 |
-1,85 |
-39,03 |
|
|
|
|
|
|
NET RESULT |
0,77 |
3,09 |
-2,32 |
-75,07 |
|
|
|
|
|
Sector Composition
Compared sector (NACE): 514
Number of companies: 635
Size (Sales Figure) : 7.000.000,00 - 40.000.000,00 Euros
Comments on the sectorial comparative
Compared to its sector the assets of the companies show an inferior
proportion of fixed assets. Specifically the difference with the sector average
is -18,58% , which means a relative difference of -92,57% .
In liabilities composition the company appeals on a wider scale to self
financing, being the proportion of net worth of 21,29% inferior, which means a
relative difference of 55,15% 21,29% more than the sector, which means a
difference of 34,69% .
The proportion that the sales mean to the company’s total ordinary
income is 100,00%, 1,57% higher than in the sector, which means a relative
difference of 1,59% .
The company’s EBIT was positive and was 2,90% with regard to the total
ordinary income, 1,85% less than the sector, which means a relative difference
of 39,03% .
The company’s capacity to generate operating income is equal to that of
the sector as its ratio EBIT/Sales is also equal.
The company’s net result was positive and equal to 0,77% with regard to
the total ordinary income, 2,32% less than the sector, which means a relative
difference of 75,07% .
ADDRESSES
Current Legal Seat Address:
POLIGONO INDUSTRIAL SANT ANTONI, 6 (NAV 2 APDO 168)
08620 SANT VICENC DELS HORTS BARCELONA
Previous Seat Address:
AVENIDA TRES-CENTS TRES, 12
08860
CASTELLDEFELS BARCELONA
Characteristics of the current address
Type of premises: office
Property: rented
Local Situation: secondary
CORPORATE STRUCTURE
ADMINISTRATIVE LINKS
Main Board members, Directors and Auditor ![]()
|
POSITION |
SURNAMES AND
NAME |
APPOINTMENT DATE |
|
|
SOLE ADMINISTRATOR |
SALDANHA ALBURQUERQUE JERONIMO FABIAN |
01/06/2007 |
|
|
AUDITOR |
APPOINTMENT DATE |
||
|
MORISON AC SL |
17/03/2008 |
||
Functional Managers
|
POSITION |
SURNAMES AND
NAME |
|
General Manager |
SALDANHA ALBURQUERQUE JERONIMO FABIAN |
|
Commercial Manager |
CERDA PEDRO |
FINANCIAL LINKS
|
|
BUSINESS NAME |
CIF / COUNTRY |
% |
SOURCE |
DATA INF. |
|
|
SALDANHA ALBURQUERQUE JERONIMO FABIAN |
|
Major. |
OWN SOURCES |
05/11/2008 |
CREDIT INFORMATION
Constitution Date: 31/07/1984
Foundation Date: 01/01/1984
Business activity 
Activity: Wholesale of pharmaceutical products
NACE Code: 5146
NACE Activity: Wholesale of
pharmaceutical goods
Business: COMERCIO MAYOR DE PRODUCTOS FARMACEUTICOS,
MEDICAMENTOS
Employees 
Number of total employees: 11 (2008)
Number of fixed employees: 100,00%
Number of temporary employees: 0,00%
Employees evolution

COMMERCIAL OPERATIONS 
PURCHASES
Payments (estimated):
Import Percentage: 70%
Imports from: U.E., EEUU, Tailandia, China, India, Japon.
SALES
Collection (estimated):
Export Percentage: 40%
Exports to: Alemania, Belgica, Holanda, Japon, Tailandia,
India.
National Distribution: 60%
Banks 
|
ENTITY |
BRANCH |
ADDRESS |
TOWN OR CITY |
PROVINCE |
|
BANCO BILBAO VIZCAYA ARGENTARIA, S.A. |
|
|
BARCELONA |
|
|
BANCO DE SABADELL, S.A. |
|
|
BARCELONA |
|
|
BANCO POPULAR ESPAÑOL, S.A. |
0122 |
TUSET, 20-24 |
BARCELONA |
Barcelona |
3 bank entities registered
LEGAL STRUCTURE
Constitution Data
Register Date: 31/07/1984
Current Legal Form: JOINT STOCK
COMPANY
Current Capital: 533.267,30 €
Legal Aspects
Obligation to fill in Financial
Statements: YES
Chamber census: YES (2006)
Listed on a Stock Exchange: NO
B.O.R.M.E.(Official Companies
Registry Gazette) 
Registered Proceedings
|
PROCEEDINGS |
DATE |
NOTICE NUM. |
TRADE REG. |
|
Appointments |
17/03/2008 |
146264 |
Barcelona |
|
Resignations |
17/03/2008 |
146263 |
Barcelona |
|
Resignations |
01/06/2007 |
298030 |
Barcelona |
|
Appointments |
01/06/2007 |
298030 |
Barcelona |
Other Proceedings published
|
PROCEEDINGS |
DATE |
NOTICE NUM. |
TRADE REG. |
|
Registration of accounts (2006) Individual |
06/11/2007 |
972649 |
Barcelona |
Press articles

24/05/1994 GACETA NEG (INFORMATION ON LEGAL ANNOUNCE)
POR ACUERDO DE LA JUNTA GENERAL EXTRAORDINARIA Y UNIVERSAL DE 24-05-94
SE HA ACORDADO EL CAMBIO DE DOMICILIO SOCIAL AL POLIGONO INDUSTRIAL SANT
ANTONI, PARCELA, N.6, DE SANT VICENS DEL HORTS (BARCELONA).
FINANCIAL INFORMATION
The information on the last account contained in this report is
extracted from the Mercantile Register file of the legal address of the Company
and dated 05/10/2007.
BALANCE SHEET
Assets
Figures given in €
|
|
31/12/2004 (12) |
31/12/2005 (12) |
31/12/2006 (12) |
|
A) DUE FROM SHAREHOLDERS FOR UNCALLED CAPITAL |
|
|
|
|
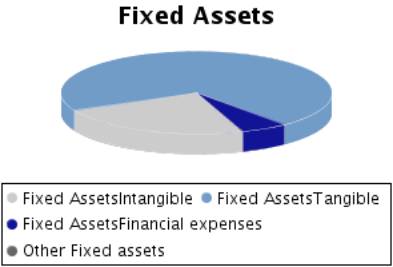
B) FIXED ASSETS |
63.522,70 |
83.942,09 |
90.676,05 |
|
I. Incorporation costs |
|
|
|
|
II. Intangible fixed assets |
38.851,13 |
30.163,99 |
21.238,92 |
|
R & D expenses |
|
|
|
|
Concessions,
patents, licences , trademarks |
|
|
|
|
Goodwill |
|
|
|
|
Acquired rights from finance leases |
|
|
|
|
Software |
|
|
|
|
Leasing |
48.261,91 |
48.261,91 |
48.261,91 |
|
Cash advance |
|
|
|
|
Provisions |
|
|
|
|
Depreciation |
-9.410,78 |
-18.097,92 |
-27.022,99 |
|
III. Tangible fixed assets |
23.034,03 |
51.915,03 |
64.249,56 |
|
Property, plant and equipment |
15.126,84 |
15.126,84 |
15.126,84 |
|
Machinery, equipment and other |
41.986,48 |
41.986,48 |
41.986,48 |
|
Other property plant and equipment |
111.771,96 |
145.174,25 |
148.248,57 |
|
Prepaid expenses on fixed assets |
|
|
|
|
Other assets |
69.764,96 |
69.764,96 |
84.721,93 |
|
Provisions |
|
|
|
|
Depreciation |
-215.616,21 |
-220.137,50 |
-225.834,26 |
|
IV. Financial fixed assets |
1.637,54 |
1.863,07 |
5.187,57 |
|
Shares in affiliated companies |
|
|
|
|
Receivables in affiliated companies |
|
|
|
|
Shares in associated companies |
|
|
|
|
Loans to associated companies |
|
|
|
|
Securities |
|
|
|
|
Other loans |
|
|
1.074,34 |
|
Long term deposits and guarantees |
1.637,54 |
1.863,07 |
4.113,23 |
|
Provisions |
|
|
|
|
Taxes receivable |
|
|
|
|
V.Owners equity |
|
|
|
|
VI.Long term trade liabilities |
|
|
|
|
C) DEFERRED EXPENSES |
1.296,96 |
396,15 |
|
|
D) CURRENT ASSETS |
3.366.577,75 |
4.490.980,55 |
5.985.188,35 |
|
I. Shareholders by required outlays |
|
|
|
|
II. Stocks |
884.241,27 |
1.126.753,38 |
972.203,30 |
|
Goods available for sale |
820.343,44 |
1.060.837,97 |
918.847,27 |
|
Raw material inventory |
|
|
|
|
Work in Progress |
|
|
|
|
Finished goods |
|
|
|
|
Subproducts and recycled materials |
|
|
|
|
Cash advance |
63.897,83 |
65.915,41 |
53.356,03 |
|
Provisions |
|
|
|
|
III. Debtors |
2.311.680,37 |
3.175.196,33 |
4.549.571,43 |
|
Clients |
2.250.483,79 |
3.129.183,55 |
4.497.830,93 |
|
Amounts owned by affiliated companies |
45.014,63 |
|
|
|
Amounts owned by associated companies |
|
|
|
|
Other debts |
|
|
232,00 |
|
Staff Expenses |
|
|
|
|
Government |
16.181,95 |
46.012,78 |
51.508,50 |
|
Provisions |
|
|
|
|
IV. Temporary financial investment |
-424,91 |
|
|
|
Shares in affiliated companies |
|
|
|
|
Receivables in affiliated companies |
|
|
|
|
Shares in associated companies |
|
|
|
|
Loans to associated companies |
|
|
|
|
Short term investment |
|
|
|
|
Other loans |
424,91 |
|
|
|
Short Term Deposit and guarantees |
|
|
|
|
Provisions |
-849,82 |
|
|
|
V. Short-term own shares |
|
|
|
|
VI. Treasury |
160.716,75 |
180.518,73 |
455.790,68 |
|
VII. Periodification adjustments |
10.364,27 |
8.512,11 |
7.622,94 |
|
ASSETS (A + B + C + D) |
3.431.397,41 |
4.575.318,79 |
6.075.864,40 |
Assets composition


Liabilities
Figures given in €
|
|
31/12/2004 (12) |
31/12/2005 (12) |
31/12/2006 (12) |
|
A) SHAREHOLDERS EQUITY |
933.205,35 |
969.122,63 |
1.051.948,00 |
|
I. Share capital |
533.267,30 |
533.267,30 |
533.267,30 |
|
II. Issue bonus |
|
|
|
|
III.Revaluation reserve |
|
|
|
|
IV.Reserves |
319.370,75 |
346.226,52 |
391.040,93 |
|
Retained earnings |
106.655,61 |
106.655,61 |
106.655,61 |
|
Sinking fund from owner equity |
|
|
|
|
Reserve for the parent company capital |
|
|
|
|
Statutory reserve |
|
|
|
|
Other funds |
212.715,14 |
239.570,91 |
284.385,32 |
|
Capital adjustments in Euros |
|
|
|
|
V.Results from previous years |
|
|
|
|
Carry Over |
|
|
|
|
Prior years losses |
|
|
|
|
Loans from partners for losses compensation |
|
|
|
|
VI.Profit and Losses |
80.567,30 |
89.628,81 |
127.639,77 |
|
VII.Dividend paid during the year |
|
|
|
|
VIII.Own shares for capital reduction |
|
|
|
|
B) DEFERRED INCOME |
25.310,01 |
|
181,90 |
|
Capital grants |
|
|
|
|
Positive change difference |
25.310,01 |
|
|
|
Other deferred income |
|
|
181,90 |
|
Fiscal deferred income |
|
|
|
|
C) PROVISIONS FOR LIABILITIES AND EXPENSES |
|
|
|
|
Provision for pensions plans |
|
|
|
|
Provision for taxes |
|
|
|
|
Other provisions |
|
|
|
|
Reversion fund |
|
|
|
|
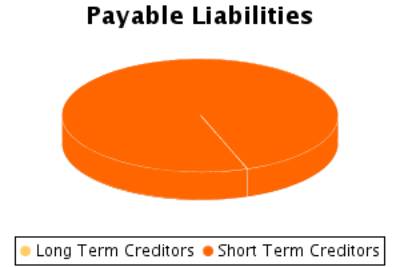
D) LONG TERM LIABILITIES |
20.537,88 |
10.092,10 |
|
|
I.Negotiable bonds and other negotiable values |
|
|
|
|
Non convertible securities |
|
|
|
|
Convertible securities |
|
|
|
|
Other convertible debentures |
|
|
|
|
II.Debt with bank entities |
|
|
|
|
Long term bank loans |
|
|
|
|
Leasing |
|
|
|
|
III.Debts with associated and affiliated
companies |
|
|
|
|
With affiliated companies |
|
|
|
|
Associated companies |
|
|
|
|
IV. Other creditors |
20.537,88 |
10.092,10 |
|
|
Bills payable |
|
|
|
|
Other debts |
20.537,88 |
10.092,10 |
|
|
Long term deposit and guaranties |
|
|
|
|
Taxes receivable |
|
|
|
|
V. Deferred debts on shares |
|
|
|
|
From affiliated companies |
|
|
|
|
From associated companies |
|
|
|
|
Other companies |
|
|
|
|
VI. Long term debt with creditor |
|
|
|
|
E) SHORT TERM LIABILITIES |
2.452.344,17 |
3.596.104,06 |
5.023.734,50 |
|
I.Negotiable bonds and other negotiable values |
|
|
|
|
Non convertible securities |
|
|
|
|
Convertible securities |
|
|
|
|
Other convertible debentures |
|
|
|
|
Interests from bonds |
|
|
|
|
II.Debt with bank entities |
1.377.973,34 |
2.206.127,80 |
2.913.274,92 |
|
Loans and other debts |
1.377.973,34 |
2.206.127,80 |
2.913.274,92 |
|
Debt interest |
|
|
|
|
Leasing |
|
|
|
|
III. Short term debts with associated and
affiliated companies |
163.298,82 |
|
|
|
With affiliated companies |
163.298,82 |
|
|
|
Associated companies |
|
|
|
|
IV. Commercial creditors |
775.691,93 |
1.242.696,69 |
1.988.485,49 |
|
Accounts payable |
|
|
|
|
Expenses |
775.691,93 |
1.242.696,69 |
1.988.485,49 |
|
Bills payable |
|
|
|
|
V. Other non-commercial debt |
135.380,08 |
147.279,57 |
121.974,09 |
|
Government |
25.779,25 |
47.380,24 |
59.346,58 |
|
Bills payable |
|
|
|
|
Other debts |
83.122,76 |
56.523,86 |
26.638,82 |
|
Accounts receivable |
26.478,07 |
43.375,47 |
35.988,69 |
|
Short term deposits and guarantees |
|
|
|
|
VI. Provisions for current assets |
|
|
|
|
VII. Periodification adjustments |
|
|
|
|
F) SHORT TERM PROVISIONS FOR LIABILITIES AND
EXPENSES |
|
|
|
|
LIABILITIES (A + B + C + D + E + F) |
3.431.397,41 |
4.575.318,79 |
6.075.864,40 |
Liabilities
Composition


PROFIT AND LOSS ACCOUNT
Itams of the Profit and Loss Account
Figures given in €
|
|
31/12/2004 (12) |
31/12/2005 (12) |
31/12/2006 (12) |
|
A) EXPENSES (A.1 a A.16) |
12.388.187,36 |
15.209.857,26 |
16.739.737,41 |
|
A.1.Reduction in stocks of finished goods and
work in progress |
|
|
|
|
A.2.Supplies |
10.994.039,18 |
13.588.627,44 |
14.553.779,87 |
|
Material consumed |
10.994.039,18 |
13.588.627,44 |
14.553.779,87 |
|
Raw materials consumed |
|
|
|
|
Other expenses |
|
|
|
|
A.3. Labour cost |
385.978,75 |
444.506,37 |
543.729,79 |
|
Wages |
326.965,56 |
380.471,03 |
464.662,74 |
|
Social security expenses |
59.013,19 |
64.035,34 |
79.067,05 |
|
A.4. Assets depreciation |
14.506,65 |
13.208,43 |
14.621,83 |
|
A.5.Variance in the traffic provisions |
|
4.156,24 |
7.159,90 |
|
Variance in provision for inventory |
|
|
|
|
Variance in provision for bad debts |
|
4.156,24 |
7.159,90 |
|
Variance in provision for other current assets |
|
|
|
|
A.6. Other operating costs |
639.437,43 |
632.782,19 |
970.390,57 |
|
External costs |
634.964,84 |
628.157,30 |
964.562,94 |
|
Taxes |
4.472,59 |
4.624,89 |
5.827,63 |
|
Other day to day expenses |
|
|
|
|
Allowance to reversion fund |
|
|
|
|
A.I.OPERATING RESULT
(B.1+B.2+B.3+B.4-A.1-A.2-A.3-A.4-A.5-A.6) |
25.195,58 |
358.229,61 |
479.829,97 |
|
A.7.Financial expenses and similar |
125.410,80 |
169.401,91 |
239.472,46 |
|
Debts with related companies |
125.380,80 |
169.399,05 |
239.466,15 |
|
Debts with associated companies |
|
|
|
|
Other companies debts By debts with third parties and similar expenses |
30,00 |
2,86 |
6,31 |
|
Losses from financial investments |
|
|
|
|
A.8. Variation in financial investment provision |
|
|
|
|
A.9.Negative exchange difference |
178.196,35 |
300.811,47 |
213.526,52 |
|
A.II.POSITIVE FINANCIAL RESULTS
(B.5+B.6+B.7+B.8-A.7-A.8-A.9) |
85.290,35 |
|
|
|
A.III.PROFIT FROM ORDINARY ACTIVITIES
(A.I+A.II-B.I-B.II) |
110.485,93 |
144.055,85 |
293.966,17 |
|
A.10. Variation in provision in fixed assets |
|
|
|
|
A.11. Losses in fixed assets |
6.975,89 |
|
|
|
A.12. Losses from own shares and bonds |
|
|
|
|
A.13. Extraordinary charges |
|
708,57 |
1.063,38 |
|
A.14.Other exercises’ expenses and losses |
5,46 |
7.185,00 |
126.912,00 |
|
A.IV.POSITIVE EXTRAORDINARY RESULT
(B.9+B.10+B.11+B.12+B.13-A.10-A.11-A.12-A.13-A.14) |
13.718,22 |
|
|
|
A.V.PROFIT BEFORE TAXES (A.III+A.IV-B.III-B.IV) |
124.204,15 |
138.098,45 |
196.720,86 |
|
A.15.Corporate Taxes |
43.636,85 |
48.469,64 |
69.081,09 |
|
A.16. Other taxes |
|
|
|
|
A.VI.EXERCISE RESULT (PROFIT) (A.V-A.14-A.15) |
80.567,30 |
89.628,81 |
127.639,77 |
|
B) INCOMES (B.1 a B13) |
12.468.754,66 |
15.299.486,07 |
16.867.377,18 |
|
B.1. Turnover |
12.059.157,59 |
15.041.510,28 |
16.569.511,93 |
|
Sales |
12.053.098,32 |
15.035.718,53 |
16.535.986,95 |
|
Services provided |
8.648,67 |
5.791,75 |
33.524,98 |
|
Refunds and sale reminders |
-2.589,40 |
|
|
|
B.2.Increase in inventory of finished goods and
works in progress |
|
|
|
|
B.3.Expenses capitalized |
|
|
|
|
B.4. Other operating income |
|
|
|
|
Other incomes |
|
|
|
|
Grants |
|
|
|
|
Excess in provision for liabilities and charges |
|
|
|
|
B.I.OPERATING LOSSES
(A.1+A.2+A.3+A.4+A.5+A.6-B.1-B.2-B.3-B.4) |
|
|
|
|
B.5.Incomes from share participations |
|
|
|
|
From affiliated companies |
|
|
|
|
From associated companies |
|
|
|
|
From other companies |
|
|
|
|
B.6.Income from other securities and credits to
fixed assets |
|
|
|
|
From affiliated companies |
|
|
|
|
From associated companies |
|
|
|
|
Other companies |
|
|
|
|
B.7.Other interests and similar |
132,24 |
139,43 |
118,72 |
|
From affiliated companies |
13,63 |
|
|
|
From associated companies |
|
|
|
|
Other Interests |
118,61 |
139,43 |
118,72 |
|
Profits from investments |
|
|
|
|
B.8. Positive change difference |
388.765,26 |
255.900,19 |
267.016,46 |
|
B.II. NEGATIVE FINANCIAL RESULTS
(A.7+A.8+A.9-B.5-B.6-B.7-B.8) |
|
214.173,76 |
185.863,80 |
|
B.III.LOSSES FROM ORDINARY ACTIVITIES
(B.I+B.II-A.I-A.II) |
|
|
|
|
B.9.B.9. Gains from disposal of fixed assets |
9.482,76 |
|
|
|
B.10.Gains from dealing in own shares |
|
|
|
|
B.11. Paid in surplus |
|
|
|
|
B.12. Extraordinary income |
11.216,81 |
1.936,17 |
10.738,10 |
|
B.13.Other year’s income and profits |
|
|
19.991,97 |
|
B.IV.NEGATIVE EXTRAORDINARY LOSSES (A.10+A.11+A.12+A.13+A.14-B.9-B.10-B.11-B.12-B.13) |
|
5.957,40 |
97.245,31 |
|
B.V.LOSS BEFORE TAXES (B.III+B.IV-A.III-A.IV) |
|
|
|
|
B.VI.EXERCISE RESULTS (LOSS) (B.V+A.14+A.15) |
|
|
|
Composition of the
Profit and Loss Account


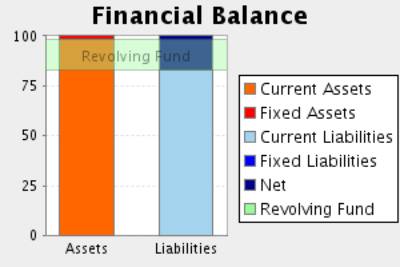
FINANCIAL BALANCE
Here the Main Capital Amounts of the company and the Revolving Fund
Evolution are analysed.
Financial Balance Table
Figures given in €
|
|
31/12/2004 (12) |
% |
31/12/2005 (12) |
% |
31/12/2006 (12) |
% |
|
A) DUE FROM
SHAREHOLDERS FOR UNCALLED CAPITAL |
|
|
|
|
|
|
|
B) FIXED ASSETS |
63.522,70 |
1,85 |
83.942,09 |
1,83 |
90.676,05 |
1,49 |
|
C) DEFERRED EXPENSES |
1.296,96 |
0,04 |
396,15 |
0,01 |
|
|
|
D) CURRENT ASSETS |
3.366.577,75 |
98,11 |
4.490.980,55 |
98,16 |
5.985.188,35 |
98,51 |
|
ASSETS (A + B + C + D) |
3.431.397,41 |
|
4.575.318,79 |
|
6.075.864,40 |
|
|
|
||||||
|
A) SHAREHOLDERS
EQUITY |
933.205,35 |
27,20 |
969.122,63 |
21,18 |
1.051.948,00 |
17,31 |
|
B) DEFERRED INCOME |
25.310,01 |
0,74 |
|
|
181,90 |
0,00 |
|
C) PROVISIONS
FOR LIABILITIES AND EXPENSES |
|
|
|
|
|
|
|
D) LONG TERM
LIABILITIES |
20.537,88 |
0,60 |
10.092,10 |
0,22 |
|
|
|
E) SHORT TERM
LIABILITIES |
2.452.344,17 |
71,47 |
3.596.104,06 |
78,60 |
5.023.734,50 |
82,68 |
|
F) SHORT TERM
PROVISIONS FOR LIABILITIES AND EXPENSES |
|
|
|
|
|
|
|
LIABILITIES (A +
B + C + D + E + F) |
3.431.397,41 |
|
4.575.318,79 |
|
6.075.864,40 |
|
Financial Balance
Composition

Comments on Financial Balance
In the 2004, the assets of the company were formed in 1,89% of Fixed
Assets and in 98,11% of Current Assets.This assets were financed in 27,93% with
own capitals, and in 0,60% with long term debt and in 71,47% with current
liabilities.
The result of this financial structure is a positive turnover fund of
914.233,58 Euros, which is equivalent to 26,64% proportion of the
company’s total assets.
In the 2005, the assets of the company were formed in 1,84% of Fixed
Assets and in 98,16% of Current Assets.This assets were financed in 21,18% with
own capitals, and in 0,22% with long term debt and in 78,60% with current
liabilities.
The result of this financial structure is a positive turnover fund of
894.876,49 Euros, which is equivalent to 19,56% proportion of the
company’s total assets.
This measure has diminished with respect to the previous exercise in
2,12% having also diminished its proportion with respect to the total assets of
the company.
In the 2006, the assets of the company were formed in 1,49% of Fixed
Assets and in 98,51% of Current Assets.This assets were financed in 17,32% with
own capitals and in 82,68% with current liabilities.
The result of this financial structure is a positive turnover fund of
961.453,85 Euros, which is equivalent to 15,82% proportion of the
company’s total assets.
This measure has increased with respect to the previous exercise in
7,44% having, however, diminished its proportion with respect to the total
assets of the company.
RATIOS
Main Ratios
|
|
31/12/2004 (12) |
31/12/2005 (12) |
31/12/2006 (12) |
|
STRUCTURAL RATIOS |
|
|
|
|
Management fund |
914.233,58 |
894.876,49 |
961.453,85 |
|
Management Fund Requirement |
2.131.915,08 |
2.920.485,56 |
3.418.938,09 |
|
Indebtedness (%) |
72,07 |
78,82 |
82,68 |
|
External Funds on Net Worth |
2,58 |
3,72 |
4,78 |
|
GENERAL ACTIVITY RATIO |
|
|
|
|
Turnover Increase (%) |
13,12 |
24,73 |
10,16 |
|
Added value growth (%) |
-3,36 |
92,66 |
27,46 |
|
Cash Flow |
95.073,95 |
106.993,48 |
149.421,50 |
|
Labour Productivity |
1,10 |
1,84 |
1,92 |
|
Assets turnover |
3,51 |
3,29 |
2,73 |
|
Breakdown Point |
11.773.895,91 |
11.332.804,93 |
12.625.263,30 |
|
Security Margin of the Breakdown Point (%) |
2,37 |
24,66 |
23,80 |
|
ACTIVITY RATIOS |
|
|
|
|
Average Payment Period |
25 |
33 |
49 |
|
Average Collection Period |
69 |
76 |
99 |
|
Inventory Turnover Period |
26 |
27 |
21 |
|
SOLVENCY RATIOS |
|
|
|
|
Payback Capacity |
0,04 |
0,03 |
0,03 |
|
Assets Guarantee |
1,39 |
1,27 |
1,21 |
|
Short Term Debts Proportion (%) |
99,17 |
99,72 |
100,00 |
|
Interest Coverage |
-2,51 |
-0,89 |
-0,62 |
|
LIQUIDITY RATIOS |
|
|
|
|
Current Ratio |
1,37 |
1,25 |
1,19 |
|
Immediate liquidity |
0,06 |
0,05 |
0,09 |
|
Treasury |
-1.217.681,50 |
-2.025.609,07 |
-2.457.484,24 |
|
Sales on Current Assets |
1.290 |
1.206 |
997 |
Results Analysis
Ratios
|
|
31/12/2004 (12) |
31/12/2005 (12) |
31/12/2006 (12) |
|
Economic profitability (%) |
0,73 |
7,83 |
7,90 |
|
Operating Profitability (%) |
0,21 |
2,38 |
2,90 |
|
Equity gearing |
15,70 |
1,90 |
3,54 |
|
Financial profitability (%) |
8,40 |
9,25 |
12,13 |
|
General Profitability (%) |
0,67 |
0,60 |
0,77 |
Comments on the
Results Analysis Ratios
The economic profitability in the year2005 achieved a 7,83% positive
level, due to a 2,38% economic margin and to an assets turnover of3,29%.
The economic profitability in the year has increased from 0,73% up to 7,83%.
This growth is due to the economic margin increase, from 0,21% to the current
2,38% in spite of the assets turnover drop, which have decreased from 3,51 to
3,29%.
Financial profitability on 2005 achieved a 9,25%.
The company’s financial structure has instigated its economic
profitability with an indebtedness level of 1,90.
The general profitability on 2005 achieved a 0,60%.
The economic profitability in the year2006 achieved a 7,90% positive
level, due to a 2,90% economic margin and to an assets turnover of2,73%.
The economic profitability in the year has increased from 7,83% up to
7,90%. This growth is due to the economic margin increase, from 2,38% to the
current 2,90% in spite of the assets turnover drop, which have decreased from
3,29 to 2,73%.
Financial profitability on 2006 achieved a 12,13%.
The company’s financial structure has instigated its economic
profitability with an indebtedness level of 3,54.
The general profitability on 2006 achieved a 0,77%.
SECTORIAL ANÁLYSIS
Large Capital Amounts and Financial Balance
Figures given in %
|
|
COMPANY (2006) |
SECTOR |
DIFFERENCE |
DIFFERENCE RELATIVE |
|
|
|
|
|
|
ASSETS |
|
|
|
|
|
|
|
|
|
|
A) DUE FROM
SHAREHOLDERS FOR UNCALLED CAPITAL |
|
0,07 |
|
|
|
|
|
|
|
|
B) FIXED ASSETS |
1,49 |
20,07 |
-18,58 |
-92,58 |
|
|
|
|
|
|
C) DEFERRED EXPENSES |
|
0,26 |
|
|
|
|
|
|
|
|
D) CURRENT ASSETS |
98,51 |
79,59 |
18,92 |
23,77 |
|
|
|
|
|
|
ASSETS (A + B + C + D) |
100 |
100 |
|
|
|
|
|
|
|
|
|
|
|
|
|
|
|
|
|
|
|
|
COMPANY (2006) |
SECTOR |
DIFFERENCE |
DIFFERENCE RELATIVE |
|
|
|
|
|
|
LIABILITIES |
|
|
|
|
|
|
|
|
|
|
A) SHAREHOLDERS
EQUITY |
17,31 |
38,48 |
-21,17 |
-55,02 |
|
|
|
|
|
|
B) DEFERRED
INCOME |
0,00 |
0,13 |
-0,13 |
-100,00 |
|
|
|
|
|
|
C) PROVISIONS
FOR LIABILITIES AND EXPENSES |
|
0,18 |
|
|
|
|
|
|
|
|
D) LONG TERM
LIABILITIES |
|
6,37 |
|
|
|
|
|
|
|
|
E) SHORT TERM
LIABILITIES |
82,68 |
54,83 |
27,85 |
50,79 |
|
|
|
|
|
|
F) SHORT TERM
PROVISIONS FOR LIABILITIES AND EXPENSES |
|
0,01 |
|
|
|
|
|
|
|
|
LIABILITIES (A + B + C + D + E + F) |
100 |
100 |
|
|
|
|
|
|
|
Sectorial Financial
Balance Comparison


Comments to the
Sectorial Analysis
In the 2006, the assets of the company were formed in 1,49% of fixed
assets and in 98,51Current Assets % In the sector, the proportion of fixed
assets was of 20,41%, 92,70% superior, and the proportion of current assets was
of 79,59%, 23,77% inferior.
The assets were financed in the company in 17,32% with own capitals and
in 82,68% with current liabilities In the sector, the self financing
represented 38,61%, 55,14% superior. On the other hand the long term debts
represented in the sector an average of 54,84% financing, with a relative
difference of 50,77% in favour of the company
The result of this company’s financial structure is a turnover fund that
represents 15,82% of the total assets; in the sector, this same proportion is
24,75%, therefore, we can say that the company’s turnover fund is 36,08%
smaller than the sector one.
Analytical Account of Results
Figures given in %
|
|
COMPANY (2006) |
SECTOR |
DIFFERENCE |
DIFFERENCE RELATIVE |
|
Turnover |
100,00 |
98,43 |
1,57 |
1,59 |
|
Other operating income |
|
1,57 |
|
|
|
Production Value |
100,00 |
100,00 |
0,00 |
0,00 |
|
Operating expenses |
87,83 |
72,35 |
15,48 |
21,40 |
|
Other operation expenses |
5,86 |
12,53 |
-6,67 |
-53,24 |
|
Added value |
6,31 |
15,12 |
-8,81 |
-58,27 |
|
Labour cost |
3,28 |
8,98 |
-5,70 |
-63,46 |
|
Gross Economic Result |
3,03 |
6,14 |
-3,11 |
-50,68 |
|
Assets depreciation |
0,09 |
1,12 |
-1,03 |
-91,94 |
|
Variation in provision for current assets and bad debt losses |
0,04 |
0,28 |
-0,24 |
-85,66 |
|
Net Economic Result |
2,90 |
4,75 |
-1,85 |
-38,95 |
|
Financial income |
1,61 |
0,66 |
0,96 |
145,80 |
|
Financial Charges |
2,73 |
1,02 |
1,71 |
168,17 |
|
Variation in financial investment provision |
|
0,01 |
|
|
|
Ordinary Activities Result |
1,77 |
4,38 |
-2,61 |
-59,56 |
|
Extraordinary income |
0,19 |
0,42 |
-0,22 |
-54,22 |
|
Extraordinary charges |
0,77 |
0,25 |
0,52 |
203,15 |
|
Variation in provision in fixed assets |
|
0,03 |
|
|
|
Results before Taxes |
1,19 |
4,51 |
-3,32 |
-73,59 |
|
Corporate taxes |
0,42 |
1,42 |
-1,00 |
-70,32 |
|
Net Result |
0,77 |
3,09 |
-2,32 |
-75,08 |
|
Assets depreciation |
0,09 |
1,12 |
-1,03 |
-91,94 |
|
Change of Provisions |
0,04 |
0,32 |
-0,28 |
-87,54 |
|
Net Self-Financing |
0,90 |
4,53 |
-3,63 |
-80,12 |
Main Ratios
|
|
COMPANY (2006) |
PTILE25 |
PTILE50 |
PTILE75 |
|
STRUCTURAL RATIOS |
|
|
|
|
|
Management fund |
961.453,85 |
610,51 |
1.586,83 |
3.187,42 |
|
Management Fund Requirement |
3.418.938,09 |
-1.491,45 |
-89,41 |
1.323,52 |
|
Indebtedness (%) |
82,68 |
47,21 |
65,48 |
80,34 |
|
External Funds on Net Worth |
4,78 |
0,89 |
1,90 |
4,09 |
|
GENERAL ACTIVITY
RATIO |
|
|
|
|
|
Turnover Increase (%) |
10,16 |
-3,56 |
4,33 |
12,92 |
|
Added value growth (%) |
27,46 |
-6,74 |
5,05 |
18,01 |
|
Cash Flow |
149.421,50 |
214,98 |
431,17 |
834,43 |
|
Labour Productivity |
1,92 |
1,31 |
1,64 |
2,14 |
|
Assets turnover |
2,73 |
1,28 |
1,68 |
2,18 |
|
Breakdown Point |
12.625.263,30 |
7.497.656,71 |
10.370.635,11 |
15.788.682,26 |
|
Security Margin
of the Breakdown Point (%) |
23,80 |
7,18 |
15,84 |
25,64 |
|
ACTIVITY RATIOS |
|
|
|
|
|
Average Payment Period |
49 |
28 |
73 |
120 |
|
Average Collection Period |
99 |
63 |
97 |
135 |
|
Inventory Turnover Period |
21 |
25 |
46 |
71 |
|
SOLVENCY RATIOS |
|
|
|
|
|
Payback Capacity |
0,03 |
0,04 |
0,09 |
0,19 |
|
Assets Guarantee |
1,21 |
1,24 |
1,52 |
2,11 |
|
Short Term Debts Proportion (%) |
100,00 |
86,30 |
96,58 |
100,00 |
|
Interest Coverage |
-0,62 |
1,21 |
4,22 |
11,65 |
|
LIQUIDITY RATIOS |
|
|
|
|
|
Current Ratio |
1,19 |
1,14 |
1,39 |
1,93 |
|
Immediate liquidity |
0,09 |
0,05 |
0,14 |
0,36 |
|
Treasury |
-2.457.484,24 |
-1.320,43 |
39,57 |
793,71 |
|
Sales on Current Assets |
997 |
581 |
729 |
992 |
Results Analysis
Ratios
|
|
COMPANY (2006) |
PTILE25 |
PTILE50 |
PTILE75 |
|
Economic profitability (%) |
7,90 |
2,70 |
5,55 |
10,54 |
|
Operating Profitability (%) |
2,90 |
1,44 |
3,51 |
6,25 |
|
Equity gearing |
3,54 |
1,56 |
2,34 |
3,90 |
|
Financial profitability (%) |
12,13 |
5,41 |
11,40 |
20,75 |
|
General Profitability (%) |
0,77 |
0,79 |
2,08 |
4,25 |
NOTES
In answer to your request of a Financial
Report on the above-mentioned company,
we inform you that the requested product cannot be processed as the necessary
accounts haven’t been published yet.
Last Accounts published in Borme are those from the exercise: 2006.
FOREIGN EXCHANGE
RATES
|
Currency |
Unit
|
Indian Rupees |
|
US Dollar |
1 |
Rs.47.67 |
|
UK Pound |
1 |
Rs.75.47 |
|
Euro |
1 |
Rs.61.19 |
RATING
EXPLANATIONS
|
RATING |
STATUS |
PROPOSED CREDIT LINE |
|
|
>86 |
Aaa |
Possesses an extremely sound financial base with the strongest
capability for timely payment of interest and principal sums |
Unlimited |
|
71-85 |
Aa |
Possesses adequate working capital. No caution needed for credit
transaction. It has above average (strong) capability for payment of interest
and principal sums |
Large |
|
56-70 |
A |
Financial & operational base are regarded healthy. General
unfavourable factors will not cause fatal effect. Satisfactory capability for
payment of interest and principal sums |
Fairly Large |
|
41-55 |
Ba |
Overall operation is considered normal. Capable to meet normal
commitments. |
Satisfactory |
|
26-40 |
B |
Unfavourable & favourable factors carry similar weight in credit consideration.
Capability to overcome financial difficulties seems comparatively below
average. |
Small |
|
11-25 |
Ca |
Adverse factors are apparent. Repayment of interest and principal sums
in default or expected to be in default upon maturity |
Limited with
full security |
|
<10 |
C |
Absolute credit risk exists. Caution needed to be exercised |
Credit not
recommended |
|
NR |
In view of the lack of information, we have no basis upon which to
recommend credit dealings |
No Rating |
|
This score serves as a reference to assess SC’s credit risk
and to set the amount of credit to be extended. It is calculated from a
composite of weighted scores obtained from each of the major sections of this
report. The assessed factors and their relative weights (as indicated through
%) are as follows:
Financial
condition (40%) Ownership
background (20%) Payment
record (10%)
Credit history
(10%) Market trend
(10%) Operational
size (10%)