![]()
MIRA
INFORM REPORT
|
Report Date : |
08.11.2008 |
IDENTIFICATION
DETAILS
|
Name : |
BELTRAN Y BELTRAN SL |
|
|
|
|
Registered Office : |
Carretera Nacional 340 Km 985
5, Cp 12560, Benicasim Castellón |
|
|
|
|
Country : |
Spain |
|
|
|
|
Financials (as on) : |
31.12.2007 |
|
|
|
|
Date of Incorporation : |
|
|
|
|
|
Legal Form : |
Limited Liability Company |
|
|
|
|
Line of Business : |
RATING &
COMMENTS
|
MIRA’s Rating : |
Ba |
|
RATING |
STATUS |
PROPOSED CREDIT LINE |
|
|
41-55 |
Ba |
Overall operation is considered normal. Capable to meet normal
commitments. |
Satisfactory |
|
Maximum Credit Limit : |
728.426,67 € |
|
|
|
|
Status : |
Satisfactory |
|
|
|
|
Payment Behaviour : |
No Complaints |
|
|
|
|
Litigation : |
Clear |
FINANCIAL
REPORT
BELTRAN Y BELTRAN SL
TAX NUMBER: B12090510
EXECUTIVE SUMMARY
Identification
Current Business Name: BELTRAN Y BELTRAN SL
Commercial Name: JOBELSA
Other names: NO
Current Address: CARRETERA NACIONAL
340 KM 985 5, CP 12560, BENICASIM CASTELLÓN
Telephone number: 964390039 Fax: 964303111
URL: www.jobelsa.com Corporate
e-mail: jovelsa@jovelsa.com
Commercial Risk
Credit Appraisal: 728.426,67 €
RAI: NO
Legal Actions: NO
Financial
Information
Latest Balance sheet sales (2007): 23.199.354,66 € (MERCANTILE REGISTER)
Result: 483.992,72 €
Total Assets:
20.994.752,74 €
Social Capital: 18.030,00 €
Employees: 86
Commercial Information
Constitution Date: 02/01/1988
Business activity: Finishing of
textiles
NACE Code: 1730
International Operations: Imports
Corporate Structure
Sole Administrator:
Parent Company:
Participations: 1
Other Complementary Information
Latest proceeding published in BORME: 06/10/2008 Registration
of accounts
Bank Entities: Yes
Credit Appraisal
Maximum Credit
(from 0 a 6,000,000 €)
Favourable to 728.426,67 €
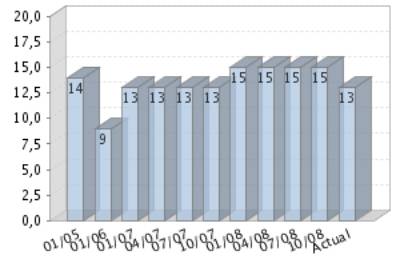
Rating Evolution
Financial Situation
Fiscal year2007
|
Treasury |
Average |
|
Indebtedness |
Average |
|
Profitability |
Average |
|
Balance |
Weak |
Performance
|
Legal Actions |
None or Negligible |
|
Business
Trajectory |
Excellent |
COMPANY NOT REGISTERED IN THE R.A.I.
This company is not registered in the Disputed Bills register (R.A.I.)
Summary
LEGAL ACTIONS: No legal incidences registered
CLAIM FILED AGAINST THE ADMINISTRATION: No administrative
claims registered
AFFECTED BY: No significant
element.
FINANCIAL ELEMENTS AND SECTORIAL
COMPARATIVE
FINANCIAL ELEMENTS
Figures given in €
|
|
2005 (12) |
2006 (12) |
2007 (12) |
% ASSETS |
|
|
|
|
|
|
BALANCE SHEET
ANALYSIS |
|
|
|
|
|
|
|
|
|
|
OWN FUNDS |
3.529.610,48 |
4.187.890,90 |
4.670.120,96 |
22,24 |
|
|
|
|
|
|
DEBT |
15.526.613,17 |
15.740.750,84 |
16.324.631,78 |
77,76 |
|
|
|
|
|
|
FIXED ASSETS |
4.554.779,78 |
5.230.722,25 |
6.297.044,16 |
29,99 |
|
|
|
|
|
|
TOTAL ASSETS |
19.056.223,65 |
19.928.641,74 |
20.994.752,74 |
|
|
|
|
|
|
|
|
|
|
|
|
|
|
|
|
|
|
|
2005 (12) |
2006 (12) |
2007 (12) |
% SALES |
|
|
|
|
|
|
PROFIT AND LOSS
ACCOUNT ANALYSIS |
|
|
|
|
|
|
|
|
|
|
SALES |
25.960.251,06 |
22.400.114,09 |
23.199.354,66 |
|
|
|
|
|
|
|
ADDED VALUE |
3.835.778,27 |
3.180.048,41 |
3.040.637,30 |
13,11 |
|
|
|
|
|
|
EBITDA |
1.361.828,37 |
1.548.150,63 |
1.404.404,13 |
6,05 |
|
|
|
|
|
|
EBIT |
954.784,77 |
1.277.559,72 |
1.079.088,21 |
4,65 |
|
|
|
|
|
|
NET RESULT |
485.939,78 |
660.042,88 |
483.992,72 |
2,09 |
|
|
|
|
|
Balance Sheets Items
Analysis


Balance Sheet Comments
Total assets of the company grew 4,58% between 2005 and 2006.
This growth is a consequence of the fixed assets increase of 14,84%.
This growth has been financed, on a wider scale, with a Shareholders’
equity increase of 18,65% and in a smaller proportion with an debt increase of
1,38%.
Total assets of the company grew 5,35% between 2006 and 2007.
This growth is a consequence of the fixed assets increase of 20,39%.
This growth has been financed, on a wider scale, with a Shareholders’
equity increase of 11,51% and in a smaller proportion with an debt increase of
3,71%.
Profit and Loss Account Analysis


Profit and Loss Account Comments
The company’s sales figure decreased in 13,71% between 2005 and 2006.
The company’s EBIT grew 33,81% between 2005 and 2006.
This evolution implies an increase in the company’s operating
profitability.
The result of these variations is an increase of the company’s Economic
Profitability of 27,95% in the analysed period, being this profitability of
6,41% in the year 2006.
The company’s Net Result grew 35,83% between 2005 and 2006.
This evolution, compared to the EBIT’s performance, implies that the
financial and extraordinary activities have had a positive effect in the
company’s Financial Profitability.
The result of these variations is an increase of the company’s Economic
Profitability of 14,48% in the analysed period, being equal to 15,76% in the
year 2006.
The company’s sales figure grew 3,57% between 2006 and 2007.
The company’s EBIT decreased in 15,54% between 2006 and 2007.
This evolution implies a reduction in the company’s operating
profitability.
The result of these variations is a decrease of the company’s Economic
Profitability of 19,82% in the analysed period, being this profitability of
5,14% in the year 2007.
The company’s Net Result decreased in 26,67% between 2006 and 2007.
This evolution, compared to the EBIT’s performance, implies that the
financial and extraordinary activities have had a negative effect in the
company’s Financial Profitability.
The result of these variations is a reduction of the company’s
profitability of 34,24% in the analysed period, being equal to 10,36% in the
year 2007.
ANNUAL FINANCIAL REPORT ADDITIONAL DATA
Source: annual financial report 2007
Results Distribution
Figures given in €
|
DISTRIBUTION
BASE |
DISTRIBUTION TO |
||
|
Profit and Loss |
483.992,72 |
Retained earnings |
0,00 |
|
Carry Over |
0,00 |
Voluntary Reserve |
483.992,72 |
|
Voluntary reserves |
0,00 |
Prior years losses |
0,00 |
|
Reserves |
0,00 |
Carry Over |
0,00 |
|
Other concepts |
0,00 |
Other funds |
0,00 |
|
Total of Amounts to be distributed |
483.992,72 |
Dividends |
0,00 |
|
|
|
Other Applications |
0,00 |
Auditing
Auditors’ opinion: FAVOURABLE WITH
RESERVATIONS
Auditor: PLANELLES SEGARRA SALVADOR
COMPARATIVE SECTOR ANALYSIS
Values table
Figures expressed in %
|
|
COMPANY (2007) |
SECTOR |
DIFFERENCE |
DIFFERENCE RELATIVE |
|
|
|
|
|
|
BALANCE SHEET
ANALYSIS: % on the total assets |
|
|
|
|
|
|
|
|
|
|
OWN FUNDS |
22,24 |
42,13 |
-19,88 |
-47,20 |
|
|
|
|
|
|
DEBT |
77,76 |
57,87 |
19,88 |
34,35 |
|
|
|
|
|
|
FIXED ASSETS |
29,99 |
44,06 |
-14,07 |
-31,93 |
|
|
|
|
|
|
|
|
|
|
|
|
|
|
|
|
|
|
COMPANY (2007) |
SECTOR |
DIFFERENCE |
DIFFERENCE RELATIVE |
|
|
|
|
|
|
PROFIT AND LOSS
ACCOUNT ANALYSIS: % on the total operating income |
|
|
|
|
|
|
|
|
|
|
SALES |
99,75 |
98,34 |
1,42 |
1,44 |
|
|
|
|
|
|
ADDED VALUE |
13,07 |
36,23 |
-23,16 |
-63,92 |
|
|
|
|
|
|
EBIT |
4,64 |
1,53 |
3,11 |
204,05 |
|
|
|
|
|
|
NET RESULT |
2,08 |
0,19 |
1,89 |
983,87 |
|
|
|
|
|
Sector Composition
Compared sector (NACE): 173
Number of companies: 16
Size (Sales Figure) : 7.000.000,00 -
40.000.000,00 Euros
Comments on the sectorial comparative
Compared to its sector the assets of the companies show an inferior proportion
of fixed assets. Specifically the difference with the sector average is -14,07%
, which means a relative difference of -31,93% .
In liabilities composition the company appeals on a wider scale to self
financing, being the proportion of net worth of 19,88% inferior, which means a
relative difference of 47,20% 19,88% more than the sector, which means a
difference of 34,35% .
The proportion that the sales mean to the company’s total ordinary
income is 99,75%, 1,42% higher than in the sector, which means a relative
difference of 1,44% .
The company’s EBIT was positive and was 4,64% with regard to the total
ordinary income, 3,11% higher than in the sector, which means a relative
difference of 204,05% .
The company’s capacity to generate operating income is higher than the
one of the sector as its ratio EBIT/Sales is higher (ES Company versus ES
Sector).
The company’s net result was positive and equal to 2,08% with regard to
the total ordinary income, 1,89% higher than in the sector, which means a
relative difference of 983,87% .
The financial and extraordinary results and the tax impact have had a
less negative impact on the Net result in the company than in the sector; as a
consequence, the company shows a better Net Result/EBIT ratio (REBEmpresa vs.
REBSector).
ADDRESSES
Current Legal Seat Address:
CARRETERA NACIONAL 340 KM 985 5
12560 BENICASIM CASTELLÓN
Previous Seat Address:
CARRETERA NACIONAL 340 KM 76.6,
12560
BENICASIM CASTELLÓN
Characteristics of the current address
Type of premises: office, factory,
warehouse
Property: rented
Local Situation: secondary
CORPORATE STRUCTURE
ADMINISTRATIVE LINKS
Main Board members, Directors and Auditor ![]()
|
POSITION |
SURNAMES AND
NAME |
APPOINTMENT DATE |
|
|
SOLE ADMINISTRATOR |
BELTRAN BELTRAN JOSE |
28/02/2008 |
|
|
AUDITOR |
APPOINTMENT DATE |
||
|
AGUILELLA LLINARES JORGE |
24/05/2007 |
||
|
PLANELLES SEGARRA SALVADOR |
24/05/2007 |
||
Functional Managers
|
POSITION |
SURNAMES AND
NAME |
|
General Manager |
BELTRAN BELTRAN JOSE |
|
Financial Manager |
NACHES EUGENIO |
|
Commercial Manager |
BELTRAN BELTRAN JOSE |
FINANCIAL LINKS
|
|
BUSINESS NAME |
CIF / COUNTRY |
% |
SOURCE |
DATA INF. |
|
|
INDAUVIL S.L. |
B12522082 |
100,00 |
TRADE REG. |
31/12/2007 |
|
|
BUSINESS NAME |
CIF / COUNTRY |
% |
SOURCE |
DATA INF. |
|
|
CARSEAT S.L. |
B12522439 |
Indet. |
TRADE REG. |
31/12/2006 |
CREDIT INFORMATION
Constitution Date: 02/01/1988
Foundation Date: 01/01/1964
Founder / Origin: el padre del
accionista de la titular, quien lo vino explotando a su nombre hasta cedérselo a
éste posteriormente.
Business activity 
Activity: Finishing of textiles
NACE Code: 1730
NACE Activity: Finishing of textiles
Business: FABRICACION,
COMPRA, VENTA, IMPORTACION, EXPORTACION Y COMERCIALIZACION EN GENERAL DE
ARTICULOS DE GUARNICIONERIA. CONFECCION DE OTROS ARTICULOS CON MATERIAS
TEXTILES, Y PRINCIPALMENTE TAPICERIAS PARA VEHICULOS
Employees 
Number of total employees: 86 (2008)
Number of fixed employees: 76,47%
Number of temporary employees: 23,53%
Employees evolution

COMMERCIAL OPERATIONS 
PURCHASES
Payments (estimated):
Import Percentage: 50%
Imports from: Austria e Italia
SALES
Collection (estimated):
Cash sales percentage: 50%
On a credit basis: 50%
National Distribution: 100%
Banks 
|
ENTITY |
BRANCH |
ADDRESS |
TOWN OR CITY |
PROVINCE |
|
BANCO SANTANDER, S.A. |
2409 |
PZ PUERTA DEL SOL 5 APDO. 00060 |
CASTELLON DE LA PLANA |
Castellón |
|
CAJA AH.
VALENCIA, CASTELLON Y ALICANTE, BANCAJA |
|
|
CASTELLON |
|
|
CAIXA D’ESTALVIS DE CATALUNYA |
|
|
|
|
|
DEUTSCHE BANK, S.A.E. |
|
|
|
|
|
BANCO DE VALENCIA, S.A. |
0505 |
RONDA VINATEA, 21 |
CASTELLON DE LA PLANA |
Castellón |
5 bank entities registered
Brands, Signs and Commercial
Names 
Brand name: JOBELSA... ALTA COSTURA PARA EL
AUTOMOVIL (Valid)
Type: DENOMINATIVE Date: 06/11/1998
Name: BELTRAN Y BELTRAN, S.L. (Valid)
Type: DENOMINATIVE Date: 23/05/1996
LEGAL STRUCTURE
Constitution Data
Register Date: 02/01/1988
Current Legal Form: LIMITED LIABILITY
COMPANY
Current Capital: 18.030,00 €
Legal Aspects
Obligation to fill in Financial
Statements: YES
Chamber census: YES (2006)
Listed on a Stock Exchange: NO
B.O.R.M.E.(Official Companies
Registry Gazette) 
Registered Proceedings
|
PROCEEDINGS |
DATE |
NOTICE NUM. |
TRADE REG. |
|
Appointments |
19/06/2008 |
306948 |
Castellón |
|
Resignations |
28/02/2008 |
112277 |
Castellón |
|
Appointments |
28/02/2008 |
112277 |
Castellón |
|
Change of statutes |
28/02/2008 |
112277 |
Castellón |
Other Proceedings published
|
PROCEEDINGS |
DATE |
NOTICE NUM. |
TRADE REG. |
|
Registration of accounts (2007) Individual |
06/10/2008 |
768561 |
Castellón |
FINANCIAL INFORMATION
The information on the last account contained in this report is
extracted from the Mercantile Register file of the legal address of the Company
and dated 07/10/2008.
BALANCE SHEET
Assets
Figures given in €
|
|
31/12/2005 (12) |
31/12/2006 (12) |
31/12/2007 (12) |
|
A) DUE FROM SHAREHOLDERS FOR UNCALLED CAPITAL |
|
|
|
|
B) FIXED ASSETS |
4.554.779,78 |
5.230.722,25 |
6.297.044,16 |
|
I. Incorporation costs |
|
|
|
|
II. Intangible fixed assets |
14.497,87 |
52.809,27 |
36.026,20 |
|
R & D expenses |
|
|
|
|
Concessions, patents, licences , trademarks |
398,33 |
398,33 |
398,33 |
|
Goodwill |
|
|
|
|
Acquired rights from finance leases |
|
|
|
|
Software |
158.910,91 |
209.800,24 |
210.300,24 |
|
Leasing |
|
|
|
|
Cash advance |
|
|
|
|
Provisions |
|
|
|
|
Depreciation |
-144.811,37 |
-157.389,30 |
-174.672,37 |
|
III. Tangible fixed assets |
414.863,06 |
524.361,48 |
416.752,69 |
|
Property, plant and equipment |
22.153,31 |
22.153,31 |
22.153,31 |
|
Machinery, equipment and other |
1.025.828,01 |
1.025.116,39 |
986.032,28 |
|
Other property plant and equipment |
699.983,90 |
792.690,19 |
793.597,19 |
|
Prepaid expenses on fixed assets |
|
|
|
|
Other assets |
367.337,74 |
491.329,35 |
519.902,14 |
|
Provisions |
|
|
|
|
Depreciation |
-1.700.439,90 |
-1.806.927,76 |
-1.904.932,23 |
|
IV. Financial fixed assets |
4.125.418,85 |
4.653.551,50 |
5.844.265,27 |
|
Shares in affiliated companies |
49.000,00 |
49.000,00 |
49.000,00 |
|
Receivables in affiliated companies |
3.976.480,23 |
4.505.612,88 |
5.541.066,65 |
|
Shares in associated companies |
|
|
|
|
Loans to associated companies |
|
|
|
|
Securities |
841,42 |
841,42 |
156.101,42 |
|
Other loans |
|
|
|
|
Long term deposits and guarantees |
99.097,20 |
98.097,20 |
98.097,20 |
|
Provisions |
|
|
|
|
Taxes receivable |
|
|
|
|
V.Owners equity |
|
|
|
|
VI.Long term trade liabilities |
|
|
|
|
C) DEFERRED EXPENSES |
|
|
|
|
D) CURRENT ASSETS |
14.501.443,87 |
14.697.919,49 |
14.697.708,58 |
|
I. Shareholders by required outlays |
|
|
|
|
II. Stocks |
4.451.045,08 |
4.907.290,16 |
3.923.519,12 |
|
Goods available for sale |
|
|
|
|
Raw material inventory |
3.051.523,76 |
2.997.752,65 |
2.772.519,36 |
|
Work in Progress |
370.512,26 |
747.895,91 |
276.685,39 |
|
Finished goods |
1.232.187,24 |
1.441.678,19 |
1.311.675,32 |
|
Subproducts and recycled materials |
|
|
|
|
Cash advance |
|
|
|
|
Provisions |
-203.178,18 |
-280.036,59 |
-437.360,95 |
|
III. Debtors |
9.896.064,18 |
9.437.701,98 |
7.478.248,77 |
|
Clients |
6.688.270,97 |
7.284.779,84 |
5.509.067,35 |
|
Amounts owned by affiliated companies |
3.207.793,21 |
2.152.922,14 |
1.969.181,42 |
|
Amounts owned by associated companies |
|
|
|
|
Other debts |
|
|
|
|
Staff Expenses |
|
|
|
|
Government |
|
|
|
|
Provisions |
|
|
|
|
IV. Temporary financial investment |
112.000,00 |
12.000,00 |
2.734.635,22 |
|
Shares in affiliated companies |
|
|
|
|
Receivables in affiliated companies |
|
|
2.620.077,23 |
|
Shares in associated companies |
|
|
|
|
Loans to associated companies |
|
|
|
|
Short term investment |
112.000,00 |
12.000,00 |
12.000,00 |
|
Other loans |
|
|
102.557,99 |
|
Short Term Deposit and guarantees |
|
|
|
|
Provisions |
|
|
|
|
V. Short-term own shares |
|
|
|
|
VI. Treasury |
33.929,95 |
330.631,99 |
533.180,58 |
|
VII. Periodification adjustments |
8.404,66 |
10.295,36 |
28.124,89 |
|
ASSETS (A + B + C + D) |
19.056.223,65 |
19.928.641,74 |
20.994.752,74 |
Assets composition


Liabilities
Figures given in €
|
|
31/12/2005 (12) |
31/12/2006 (12) |
31/12/2007 (12) |
|
A) SHAREHOLDERS EQUITY |
3.526.085,36 |
4.186.128,24 |
4.670.120,96 |
|
I. Share capital |
18.030,36 |
18.030,00 |
18.030,00 |
|
II. Issue bonus |
|
|
|
|
III.Revaluation reserve |
|
|
|
|
IV.Reserves |
3.022.115,22 |
3.508.055,36 |
4.168.098,24 |
|
Retained earnings |
3.606,07 |
3.606,07 |
3.606,07 |
|
Sinking fund from owner equity |
|
|
|
|
Reserve for the parent company capital |
|
|
|
|
Statutory reserve |
|
|
|
|
Other funds |
3.018.509,15 |
3.504.448,93 |
4.164.491,81 |
|
Capital adjustments in Euros |
|
0,36 |
0,36 |
|
V.Results from previous years |
|
|
|
|
Carry Over |
|
|
|
|
Prior years losses |
|
|
|
|
Loans from partners for losses compensation |
|
|
|
|
VI.Profit and Losses |
485.939,78 |
660.042,88 |
483.992,72 |
|
VII.Dividend paid during the year |
|
|
|
|
VIII.Own shares for capital reduction |
|
|
|
|
B) DEFERRED INCOME |
3.525,12 |
1.762,66 |
|
|
Capital grants |
3.525,12 |
1.762,66 |
|
|
Positive change difference |
|
|
|
|
Other deferred income |
|
|
|
|
Fiscal deferred income |
|
|
|
|
C) PROVISIONS FOR LIABILITIES AND EXPENSES |
|
|
|
|
Provision for pensions plans |
|
|
|
|
Provision for taxes |
|
|
|
|
Other provisions |
|
|
|
|
Reversion fund |
|
|
|
|
D) LONG TERM LIABILITIES |
1.054.638,91 |
2.426.385,87 |
1.667.671,43 |
|
I.Negotiable
bonds and other negotiable values |
|
|
|
|
Non convertible securities |
|
|
|
|
Convertible securities |
|
|
|
|
Other convertible debentures |
|
|
|
|
II.Debt with bank entities |
281.250,00 |
2.368.087,51 |
1.667.671,43 |
|
Long term bank loans |
281.250,00 |
2.368.087,51 |
1.667.671,43 |
|
Leasing |
|
|
|
|
III.Debts with associated and affiliated
companies |
773.388,91 |
58.298,36 |
|
|
With affiliated companies |
773.388,91 |
58.298,36 |
|
|
Associated companies |
|
|
|
|
IV. Other creditors |
|
|
|
|
Bills payable |
|
|
|
|
Other debts |
|
|
|
|
Long term deposit and guaranties |
|
|
|
|
Taxes receivable |
|
|
|
|
V. Deferred debts on shares |
|
|
|
|
From affiliated companies |
|
|
|
|
From associated companies |
|
|
|
|
Other companies |
|
|
|
|
VI. Long term debt with creditor |
|
|
|
|
E) SHORT TERM LIABILITIES |
14.471.974,26 |
13.314.364,97 |
14.656.960,35 |
|
I.Negotiable
bonds and other negotiable values |
|
|
|
|
Non convertible securities |
|
|
|
|
Convertible securities |
|
|
|
|
Other convertible debentures |
|
|
|
|
Interests from bonds |
|
|
|
|
II.Debt with bank entities |
8.590.321,88 |
5.336.150,25 |
9.653.174,63 |
|
Loans and other debts |
8.590.321,88 |
5.336.150,25 |
9.653.174,63 |
|
Debt interest |
|
|
|
|
Leasing |
|
|
|
|
III. Short term debts with associated and
affiliated companies |
1.235.777,30 |
3.357.628,59 |
1.726.958,05 |
|
With affiliated companies |
1.235.777,30 |
3.357.628,59 |
1.726.958,05 |
|
Associated companies |
|
|
|
|
IV. Commercial creditors |
4.198.332,62 |
4.196.937,67 |
2.962.338,85 |
|
Accounts payable |
|
|
|
|
Expenses |
4.198.332,62 |
4.196.937,67 |
2.962.338,85 |
|
Bills payable |
|
|
|
|
V. Other non-commercial debt |
447.542,46 |
412.351,35 |
314.488,82 |
|
Government |
295.650,84 |
299.273,01 |
209.954,59 |
|
Bills payable |
|
|
|
|
Other debts |
|
|
|
|
Accounts receivable |
151.891,62 |
113.078,34 |
104.534,23 |
|
Short term deposits and guarantees |
|
|
|
|
VI. Provisions for current assets |
|
|
|
|
VII. Periodification adjustments |
|
11.297,11 |
|
|
F) SHORT TERM PROVISIONS FOR LIABILITIES AND
EXPENSES |
|
|
|
|
LIABILITIES (A + B + C + D + E + F) |
19.056.223,65 |
19.928.641,74 |
20.994.752,74 |
Liabilities
Composition


PROFIT AND LOSS ACCOUNT
Itams of the Profit and Loss Account
Figures given in €
|
|
31/12/2005 (12) |
31/12/2006 (12) |
31/12/2007 (12) |
|
A) EXPENSES (A.1 a A.16) |
26.028.234,92 |
22.561.002,12 |
23.009.482,42 |
|
A.1.Reduction in stocks of finished goods and
work in progress |
|
|
601.213,39 |
|
A.2.Supplies |
20.830.399,90 |
18.275.294,70 |
17.881.751,86 |
|
Material consumed |
|
|
586.462,95 |
|
Raw materials consumed |
16.235.063,39 |
12.856.577,69 |
12.813.703,24 |
|
Other expenses |
4.595.336,51 |
5.418.717,01 |
4.481.585,67 |
|
A.3. Labour cost |
2.473.949,90 |
1.631.897,78 |
1.636.233,17 |
|
Wages |
1.904.909,41 |
1.296.039,67 |
1.287.109,16 |
|
Social security expenses |
569.040,49 |
335.858,11 |
349.124,01 |
|
A.4. Assets depreciation |
195.584,24 |
189.906,37 |
162.983,28 |
|
A.5.Variance in the traffic provisions |
211.459,36 |
80.684,54 |
162.332,64 |
|
Variance in provision for inventory |
203.178,18 |
76.858,41 |
157.324,36 |
|
Variance in provision for bad debts |
8.281,18 |
3.826,13 |
5.008,28 |
|
Variance in provision for other current assets |
|
|
|
|
A.6. Other operating costs |
1.718.359,23 |
1.637.052,20 |
1.733.789,52 |
|
External costs |
1.712.833,73 |
1.593.218,37 |
1.726.956,57 |
|
Taxes |
5.525,50 |
43.833,83 |
6.832,95 |
|
Other day to day expenses |
|
|
|
|
Allowance to reversion fund |
|
|
|
|
A.I.OPERATING
RESULT (B.1+B.2+B.3+B.4-A.1-A.2-A.3-A.4-A.5-A.6) |
954.784,77 |
1.277.559,72 |
1.079.088,21 |
|
A.7.Financial expenses and similar |
306.944,31 |
375.395,87 |
587.772,33 |
|
Debts with related companies |
|
|
|
|
Debts with associated companies |
|
|
|
|
Other companies debts By debts with third parties and similar expenses |
306.944,31 |
375.395,87 |
587.772,33 |
|
Losses from financial investments |
|
|
|
|
A.8. Variation in financial investment provision |
|
|
|
|
A.9.Negative exchange difference |
10.768,46 |
6.763,48 |
10.278,24 |
|
A.II.POSITIVE FINANCIAL RESULTS
(B.5+B.6+B.7+B.8-A.7-A.8-A.9) |
|
|
|
|
A.III.PROFIT
FROM ORDINARY ACTIVITIES (A.I+A.II-B.I-B.II) |
747.796,16 |
1.006.552,35 |
709.362,67 |
|
A.10. Variation
in provision in fixed assets |
|
|
|
|
A.11. Losses in
fixed assets |
|
|
|
|
A.12. Losses
from own shares and bonds |
|
|
|
|
A.13.
Extraordinary charges |
12.421,26 |
3.054,62 |
94,46 |
|
A.14.Other
exercises’ expenses and losses |
|
3.900,06 |
|
|
A.IV.POSITIVE
EXTRAORDINARY RESULT (B.9+B.10+B.11+B.12+B.13-A.10-A.11-A.12-A.13-A.14) |
6.491,88 |
10.543,03 |
7.663,58 |
|
A.V.PROFIT
BEFORE TAXES (A.III+A.IV-B.III-B.IV) |
754.288,04 |
1.017.095,38 |
717.026,25 |
|
A.15.Corporate
Taxes |
268.348,26 |
357.052,50 |
233.033,53 |
|
A.16. Other
taxes |
|
|
|
|
A.VI.EXERCISE RESULT
(PROFIT) (A.V-A.14-A.15) |
485.939,78 |
660.042,88 |
483.992,72 |
|
B) INCOMES (B.1 a B13) |
26.514.174,70 |
23.221.045,00 |
23.493.475,14 |
|
B.1. Turnover |
25.960.251,06 |
22.400.114,09 |
23.199.354,66 |
|
Sales |
25.960.251,06 |
22.400.114,09 |
23.199.354,66 |
|
Services provided |
|
|
|
|
Refunds and sale reminders |
|
|
|
|
B.2.Increase in inventory of finished goods and
works in progress |
369.905,16 |
586.874,60 |
|
|
B.3.Expenses capitalized |
|
|
|
|
B.4. Other operating income |
54.381,18 |
105.406,62 |
58.037,41 |
|
Other incomes |
28.106,18 |
83.821,62 |
9.419,41 |
|
Grants |
26.275,00 |
21.585,00 |
48.618,00 |
|
Excess in provision for liabilities and charges |
|
|
|
|
B.I.OPERATING
LOSSES (A.1+A.2+A.3+A.4+A.5+A.6-B.1-B.2-B.3-B.4) |
|
|
|
|
B.5.Incomes from
share participations |
|
|
|
|
From affiliated
companies |
|
|
|
|
From associated companies |
|
|
|
|
From other companies |
|
|
|
|
B.6.Income from other securities and credits to
fixed assets |
|
|
|
|
From affiliated companies |
|
|
|
|
From associated companies |
|
|
|
|
Other companies |
|
|
|
|
B.7.Other interests and similar |
110.724,16 |
109.817,76 |
224.008,39 |
|
From affiliated companies |
38.623,51 |
39.466,99 |
125.070,71 |
|
From associated companies |
|
|
|
|
Other Interests |
72.100,65 |
70.350,77 |
98.937,68 |
|
Profits from investments |
|
|
|
|
B.8. Positive change difference |
|
1.334,22 |
4.316,64 |
|
B.II. NEGATIVE FINANCIAL RESULTS
(A.7+A.8+A.9-B.5-B.6-B.7-B.8) |
206.988,61 |
271.007,37 |
369.725,54 |
|
B.III.LOSSES
FROM ORDINARY ACTIVITIES (B.I+B.II-A.I-A.II) |
|
|
|
|
B.9.B.9. Gains
from disposal of fixed assets |
9.685,55 |
8.709,66 |
2.300,00 |
|
B.10.Gains from
dealing in own shares |
|
|
|
|
B.11. Paid in
surplus |
2.116,58 |
1.762,46 |
1.762,66 |
|
B.12.
Extraordinary income |
7.111,01 |
7.025,59 |
3.695,38 |
|
B.13.Other
year’s income and profits |
|
|
|
|
B.IV.NEGATIVE
EXTRAORDINARY LOSSES (A.10+A.11+A.12+A.13+A.14-B.9-B.10-B.11-B.12-B.13) |
|
|
|
|
B.V.LOSS BEFORE
TAXES (B.III+B.IV-A.III-A.IV) |
|
|
|
|
B.VI.EXERCISE
RESULTS (LOSS) (B.V+A.14+A.15) |
|
|
|
Composition of the
Profit and Loss Account


FINANCIAL BALANCE
Here the Main Capital Amounts of the company and the Revolving Fund
Evolution are analysed.
Financial Balance Table
Figures given in €
|
|
31/12/2005 (12) |
% |
31/12/2006 (12) |
% |
31/12/2007 (12) |
% |
|
A) DUE FROM
SHAREHOLDERS FOR UNCALLED CAPITAL |
|
|
|
|
|
|
|
B) FIXED ASSETS |
4.554.779,78 |
23,90 |
5.230.722,25 |
26,25 |
6.297.044,16 |
29,99 |
|
C) DEFERRED EXPENSES |
|
|
|
|
|
|
|
D) CURRENT ASSETS |
14.501.443,87 |
76,10 |
14.697.919,49 |
73,75 |
14.697.708,58 |
70,01 |
|
ASSETS (A + B + C + D) |
19.056.223,65 |
|
19.928.641,74 |
|
20.994.752,74 |
|
|
|
||||||
|
A) SHAREHOLDERS
EQUITY |
3.526.085,36 |
18,50 |
4.186.128,24 |
21,01 |
4.670.120,96 |
22,24 |
|
B) DEFERRED INCOME |
3.525,12 |
0,02 |
1.762,66 |
0,01 |
|
|
|
C) PROVISIONS
FOR LIABILITIES AND EXPENSES |
|
|
|
|
|
|
|
D) LONG TERM
LIABILITIES |
1.054.638,91 |
5,53 |
2.426.385,87 |
12,18 |
1.667.671,43 |
7,94 |
|
E) SHORT TERM
LIABILITIES |
14.471.974,26 |
75,94 |
13.314.364,97 |
66,81 |
14.656.960,35 |
69,81 |
|
F) SHORT TERM
PROVISIONS FOR LIABILITIES AND EXPENSES |
|
|
|
|
|
|
|
LIABILITIES (A + B + C + D + E + F) |
19.056.223,65 |
|
19.928.641,74 |
|
20.994.752,74 |
|
Financial Balance
Composition


Comments on Financial Balance
In the 2005, the assets of the company were formed in 23,90% of Fixed
Assets and in 76,10% of Current Assets.This assets were financed in 18,52% with
own capitals, and in 5,53% with long term debt and in 75,94% with current
liabilities.
The result of this financial structure is a positive turnover fund of
29.469,61 Euros, which is equivalent to 0,15% proportion of the company’s
total assets.
In the 2006, the assets of the company were formed in 26,25% of Fixed
Assets and in 73,75% of Current Assets.This assets were financed in 21,01% with
own capitals, and in 12,18% with long term debt and in 66,81% with current
liabilities.
The result of this financial structure is a positive turnover fund of
1.383.554,52 Euros, which is equivalent to 6,94% proportion of the
company’s total assets.
This measure has increased with respect to the previous exercise in
4.594,85% having also increased its proportion with respect to the total assets
of the company.
In the 2007, the assets of the company were formed in 29,99% of Fixed
Assets and in 70,01% of Current Assets.This assets were financed in 22,24% with
own capitals, and in 7,94% with long term debt and in 69,81% with current
liabilities.
The result of this financial structure is a positive turnover fund of
40.748,23 Euros, which is equivalent to 0,19% proportion of the company’s
total assets.
This measure has diminished with respect to the previous exercise in
97,05% having also diminished its proportion with respect to the total assets
of the company.
RATIOS
Main Ratios
|
|
31/12/2005 (12) |
31/12/2006 (12) |
31/12/2007 (12) |
|
STRUCTURAL RATIOS |
|
|
|
|
Management fund |
29.469,61 |
1.383.554,52 |
40.748,23 |
|
Management Fund Requirement |
8.473.861,54 |
6.377.072,78 |
6.426.107,06 |
|
Indebtedness (%) |
81,48 |
78,99 |
77,76 |
|
External Funds on Net Worth |
4,40 |
3,76 |
3,50 |
|
GENERAL ACTIVITY RATIO |
|
|
|
|
Turnover Increase (%) |
87,59 |
-13,71 |
3,57 |
|
Added value growth (%) |
76,03 |
-17,10 |
-4,38 |
|
Cash Flow |
892.983,38 |
930.633,79 |
809.308,64 |
|
Labour Productivity |
1,55 |
1,95 |
1,86 |
|
Assets turnover |
1,36 |
1,12 |
1,10 |
|
Breakdown Point |
21.542.583,31 |
16.536.754,63 |
18.000.891,44 |
|
Security Margin of the Breakdown Point (%) |
17,19 |
26,52 |
22,60 |
|
ACTIVITY RATIOS |
|
|
|
|
Average Payment Period |
74 |
85 |
58 |
|
Average Collection Period |
137 |
152 |
116 |
|
Inventory Turnover Period |
62 |
79 |
61 |
|
SOLVENCY RATIOS |
|
|
|
|
Payback Capacity |
0,06 |
0,06 |
0,05 |
|
Assets Guarantee |
1,23 |
1,27 |
1,29 |
|
Short Term Debts Proportion (%) |
93,21 |
84,58 |
89,78 |
|
Interest Coverage |
1,28 |
0,57 |
0,98 |
|
LIQUIDITY RATIOS |
|
|
|
|
Current Ratio |
1,00 |
1,10 |
1,00 |
|
Immediate liquidity |
0,01 |
0,03 |
0,22 |
|
Treasury |
-8.444.391,93 |
-4.993.518,26 |
-6.385.358,83 |
|
Sales on Current Assets |
644 |
549 |
568 |
Results Analysis
Ratios
|
|
31/12/2005 (12) |
31/12/2006 (12) |
31/12/2007 (12) |
|
Economic profitability (%) |
5,01 |
6,41 |
5,14 |
|
Operating Profitability (%) |
3,68 |
5,70 |
4,65 |
|
Equity gearing |
4,23 |
3,75 |
2,96 |
|
Financial profitability (%) |
13,77 |
15,76 |
10,36 |
|
General Profitability (%) |
1,87 |
2,95 |
2,09 |
Comments on the
Results Analysis Ratios
The economic profitability in the year2006 achieved a 6,41% positive
level, due to a 5,70% economic margin and to an assets turnover of1,12%.
The economic profitability in the year has increased from 5,01% up to
6,41%. This growth is due to the economic margin increase, from 3,68% to the
current 5,70% in spite of the assets turnover drop, which have decreased from
1,36 to 1,12%.
Financial profitability on 2006 achieved a 15,76%.
The company’s financial structure has instigated its economic
profitability with an indebtedness level of 3,75.
The general profitability on 2006 achieved a 2,95%.
The economic profitability in the year2007 achieved a 5,14% positive
level, due to a 4,65% economic margin and to an assets turnover of1,10%.
The economic profitability in the year has reduced from 6,41% up to
5,14% of2007, even if it remains positive. This fall is due to the decrease in
operating profitability, that has passe from 5,70% to 4,65%, as assets turnover
whose index has passed from 1,12 to 1,10%.
Financial profitability on 2007 achieved a 10,36%.
The company’s financial structure has instigated its economic
profitability with an indebtedness level of 2,96.
The general profitability on 2007 achieved a 2,09%.
SECTORIAL ANÁLYSIS
Large Capital Amounts and Financial Balance
Figures given in %
|
|
COMPANY (2007) |
SECTOR |
DIFFERENCE |
DIFFERENCE RELATIVE |
|
|
|
|
|
|
ASSETS |
|
|
|
|
|
|
|
|
|
|
A) DUE FROM
SHAREHOLDERS FOR UNCALLED CAPITAL |
|
0,00 |
|
|
|
|
|
|
|
|
B) FIXED ASSETS |
29,99 |
44,06 |
-14,07 |
-31,94 |
|
|
|
|
|
|
C) DEFERRED
EXPENSES |
|
1,08 |
|
|
|
|
|
|
|
|
D) CURRENT ASSETS |
70,01 |
54,86 |
15,15 |
27,62 |
|
|
|
|
|
|
ASSETS (A + B + C + D) |
100 |
100 |
|
|
|
|
|
|
|
|
|
|
|
|
|
|
|
|
|
|
|
|
COMPANY (2007) |
SECTOR |
DIFFERENCE |
DIFFERENCE RELATIVE |
|
|
|
|
|
|
LIABILITIES |
|
|
|
|
|
|
|
|
|
|
A) SHAREHOLDERS
EQUITY |
22,24 |
41,73 |
-19,49 |
-46,70 |
|
|
|
|
|
|
B) DEFERRED
INCOME |
|
0,40 |
|
|
|
|
|
|
|
|
C) PROVISIONS
FOR LIABILITIES AND EXPENSES |
|
4,20 |
|
|
|
|
|
|
|
|
D) LONG TERM
LIABILITIES |
7,94 |
13,23 |
-5,29 |
-39,99 |
|
|
|
|
|
|
E) SHORT TERM
LIABILITIES |
69,81 |
40,44 |
29,37 |
72,60 |
|
|
|
|
|
|
F) SHORT TERM
PROVISIONS FOR LIABILITIES AND EXPENSES |
|
0,00 |
|
|
|
|
|
|
|
|
LIABILITIES (A + B + C + D + E + F) |
100 |
100 |
|
|
|
|
|
|
|
Sectorial Financial
Balance Comparison


Comments to the Sectorial Analysis
In the 2007, the assets of the company were formed in 29,99% of fixed
assets and in 70,01Current Assets % In the sector, the proportion of fixed
assets was of 45,14%, 33,56% superior, and the proportion of current assets was
of 54,86%, 27,62% inferior.
The assets were financed in the company in 22,24% with own capitals , in
7,94% with fixed liabilities and in 69,81% with current liabilities In the
sector, the self financing represented 42,13%, 47,21% superior. On the other
hand the long term debts represented in the sector an average of 17,43%
financing, with a relative difference of 54,44% favourable to the sectorAnd,
short term liabilities represented in the sector an average of 40,44%
financing, with a relative difference of 72,60% in favour of the company
The result of this company’s financial structure is a turnover fund that
represents 0,19% of the total assets; in the sector, this same proportion is
14,42%, therefore, we can say that the company’s turnover fund is 98,68%
smaller than the sector one.
Analytical Account of Results
Figures given in %
|
|
COMPANY (2007) |
SECTOR |
DIFFERENCE |
DIFFERENCE RELATIVE |
|
Turnover |
99,75 |
98,34 |
1,42 |
1,44 |
|
Other operating income |
0,25 |
1,66 |
-1,42 |
-84,98 |
|
Production Value |
100,00 |
100,00 |
0,00 |
0,00 |
|
Operating expenses |
79,47 |
40,95 |
38,52 |
94,06 |
|
Other operation expenses |
7,45 |
22,81 |
-15,36 |
-67,34 |
|
Added value |
13,07 |
36,23 |
-23,16 |
-63,93 |
|
Labour cost |
7,04 |
26,40 |
-19,36 |
-73,34 |
|
Gross Economic Result |
6,04 |
9,83 |
-3,79 |
-38,57 |
|
Assets depreciation |
0,70 |
8,03 |
-7,33 |
-91,28 |
|
Variation in provision for current assets and bad debt losses |
0,70 |
0,28 |
0,42 |
150,90 |
|
Net Economic Result |
4,64 |
1,53 |
3,11 |
204,06 |
|
Financial income |
0,98 |
1,02 |
-0,04 |
-3,83 |
|
Financial Charges |
2,57 |
1,91 |
0,66 |
34,48 |
|
Variation in financial investment provision |
|
-0,14 |
|
|
|
Ordinary
Activities Result |
3,05 |
0,77 |
2,28 |
295,08 |
|
Extraordinary income |
0,03 |
0,86 |
-0,83 |
-96,50 |
|
Extraordinary charges |
0,00 |
0,96 |
-0,96 |
-100,00 |
|
Variation in provision in fixed assets |
|
-0,06 |
|
|
|
Results before Taxes |
3,08 |
0,72 |
2,36 |
326,59 |
|
Corporate taxes |
1,00 |
0,53 |
0,47 |
88,68 |
|
Net Result |
2,08 |
0,19 |
1,89 |
983,33 |
|
Assets depreciation |
0,70 |
8,03 |
-7,33 |
-91,28 |
|
Change of Provisions |
0,70 |
0,08 |
0,62 |
743,37 |
|
Net Self-Financing |
3,48 |
8,30 |
-4,82 |
-58,08 |
Main Ratios
|
|
COMPANY (2007) |
PTILE25 |
PTILE50 |
PTILE75 |
|
STRUCTURAL RATIOS |
|
|
|
|
|
Management fund |
40.748,23 |
-2.182,01 |
847,81 |
5.751,37 |
|
Management Fund
Requirement |
6.426.107,06 |
-4.580,74 |
-2.810,70 |
2.028,20 |
|
Indebtedness (%) |
77,76 |
46,27 |
64,34 |
74,24 |
|
External Funds
on Net Worth |
3,50 |
0,86 |
1,80 |
2,91 |
|
GENERAL ACTIVITY
RATIO |
|
|
|
|
|
Turnover
Increase (%) |
3,57 |
-9,61 |
6,53 |
18,27 |
|
Added value
growth (%) |
-4,38 |
-8,24 |
-1,46 |
11,28 |
|
Cash Flow |
809.308,64 |
490,79 |
906,86 |
1.701,78 |
|
Labour
Productivity |
1,86 |
1,25 |
1,45 |
1,62 |
|
Assets turnover |
1,10 |
0,63 |
0,96 |
1,13 |
|
Breakdown Point |
18.000.891,44 |
7.646.455,79 |
8.711.956,20 |
15.505.267,29 |
|
Security Margin
of the Breakdown Point (%) |
22,60 |
0,76 |
4,23 |
9,56 |
|
ACTIVITY RATIOS |
|
|
|
|
|
Average Payment Period |
58 |
116 |
144 |
197 |
|
Average Collection Period |
116 |
66 |
137 |
163 |
|
Inventory Turnover Period |
61 |
10 |
26 |
87 |
|
SOLVENCY RATIOS |
|
|
|
|
|
Payback Capacity |
0,05 |
0,06 |
0,12 |
0,26 |
|
Assets Guarantee |
1,29 |
1,35 |
1,53 |
2,15 |
|
Short Term Debts Proportion (%) |
89,78 |
61,10 |
81,46 |
90,20 |
|
Interest Coverage |
0,98 |
1,54 |
2,92 |
12,76 |
|
LIQUIDITY RATIOS |
|
|
|
|
|
Current Ratio |
1,00 |
0,59 |
1,17 |
2,19 |
|
Immediate liquidity |
0,22 |
0,02 |
0,03 |
0,14 |
|
Treasury |
-6.385.358,83 |
-5.033,92 |
-1.486,54 |
-63,62 |
|
Sales on Current Assets |
568 |
356 |
698 |
1.405 |
Results Analysis
Ratios
|
|
COMPANY (2007) |
PTILE25 |
PTILE50 |
PTILE75 |
|
Economic profitability (%) |
5,14 |
0,33 |
2,58 |
5,28 |
|
Operating Profitability (%) |
4,65 |
0,50 |
2,58 |
3,67 |
|
Equity gearing |
2,96 |
0,99 |
1,88 |
2,80 |
|
Financial profitability (%) |
10,36 |
-1,90 |
1,96 |
6,86 |
|
General Profitability (%) |
2,09 |
-1,70 |
0,70 |
2,02 |
FOREIGN EXCHANGE
RATES
|
Currency |
Unit
|
Indian Rupees |
|
US Dollar |
1 |
Rs.47.76 |
|
UK Pound |
1 |
Rs.74.87 |
|
Euro |
1 |
Rs.60.81 |
RATING
EXPLANATIONS
|
RATING |
STATUS |
PROPOSED CREDIT LINE |
|
|
>86 |
Aaa |
Possesses an extremely sound financial base with the strongest
capability for timely payment of interest and principal sums |
Unlimited |
|
71-85 |
Aa |
Possesses adequate working capital. No caution needed for credit transaction.
It has above average (strong) capability for payment of interest and
principal sums |
Large |
|
56-70 |
A |
Financial & operational base are regarded healthy. General unfavourable
factors will not cause fatal effect. Satisfactory capability for payment of
interest and principal sums |
Fairly Large |
|
41-55 |
Ba |
Overall operation is considered normal. Capable to meet normal
commitments. |
Satisfactory |
|
26-40 |
B |
Unfavourable & favourable factors carry similar weight in credit
consideration. Capability to overcome financial difficulties seems
comparatively below average. |
Small |
|
11-25 |
Ca |
Adverse factors are apparent. Repayment of interest and principal sums
in default or expected to be in default upon maturity |
Limited with
full security |
|
<10 |
C |
Absolute credit risk exists. Caution needed to be exercised |
Credit not
recommended |
|
NR |
In view of the lack of information, we have no basis upon which to
recommend credit dealings |
No Rating |
|
This score serves as a reference to assess SC’s credit risk
and to set the amount of credit to be extended. It is calculated from a
composite of weighted scores obtained from each of the major sections of this
report. The assessed factors and their relative weights (as indicated through
%) are as follows:
Financial
condition (40%) Ownership
background (20%) Payment
record (10%)
Credit history
(10%) Market trend
(10%) Operational
size (10%)