![]()
MIRA
INFORM REPORT
|
Report Date : |
11.11.2008 |
IDENTIFICATION
DETAILS
|
Name : |
BEFESA AGUA S.A. |
|
|
|
|
Registered Office : |
|
|
|
|
|
Country : |
Spain |
|
|
|
|
Financials (as on) : |
31.12.2007 |
|
|
|
|
Date of Incorporation : |
|
|
|
|
|
Legal Form : |
Joint Stock Company |
|
|
|
|
Line of Business : |
RATING &
COMMENTS
|
MIRA’s Rating : |
B |
|
RATING |
STATUS |
PROPOSED CREDIT LINE |
|
|
26-40 |
B |
Unfavourable & favourable factors carry similar weight in credit
consideration. Capability to overcome financial difficulties seems
comparatively below average. |
Small |
|
Maximum Credit Limit : |
1.887.779,02 € |
|
|
|
|
Status : |
Moderate |
|
|
|
|
Payment Behaviour : |
No Complaints |
|
|
|
|
Litigation : |
Clear |
FINANCIAL
REPORT
BEFESA AGUA S.A.
TAX NUMBER: A41290792
EXECUTIVE SUMMARY
Identification
Current Business Name: BEFESA AGUA S.A.
Other names: YES
Current Address: AVENIDA LA
BUHAIRA, 2, CP 41018 SEVILLA
Branches: 5
Telephone number: 954937111 Fax: 954937020
URL: www.befesa.es
Corporate
e-mail: befesa.cta@befesa.abengoa.com
Commercial Risk
Credit Appraisal:
1.887.779,02 €
RAI: NO
Legal Actions: NO
Financial
Information
Latest Balance sheet sales (2007): 146.946.000,00 € (MERCANTILE REGISTER)
Result: 3.382.000 €
Total Assets:
231.523.000 €
Social Capital: 10.290.000,00 €
Employees: 157
Commercial Information
Constitution Date: 05/10/1990
Business activity: Construction
and civil works
NACE Code: 4520
International Operations: Imports and
Exports
Corporate Structure
President:
Parent Company:
Participations: 76
Other Complementary Information
Latest proceeding published in BORME: 14/10/2008 Re-elections
Latest press article: 23/10/2008 CINCO
DIAS (FINANCIAL INFORMATION)
Bank Entities: Yes
Credit Appraisal
Maximum Credit
(from 0 a 6,000,000 €)
Favourable to 1.887.779,02 €
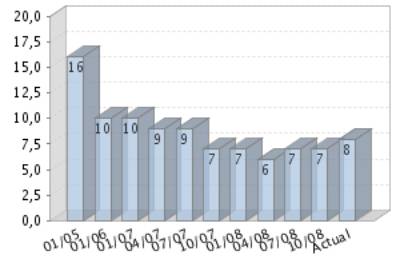
Rating Evolution
Financial Situation
Fiscal year2007
|
Treasury |
Limited |
|
Indebtedness |
Heavy |
|
Profitability |
Average |
|
Balance |
Very Degraded |
Performance
|
Legal Actions |
None or Negligible |
|
Business Trajectory |
Excellent |
RAI 
COMPANY NOT REGISTERED IN THE R.A.I.
This company is not registered in the Disputed Bills register (R.A.I.)
INCIDENTS

Summary
LEGAL ACTIONS: No legal
incidences registered
CLAIM FILED AGAINST THE ADMINISTRATION: No administrative
claims registered
AFFECTED BY: No significant
element.
FINANCIAL ELEMENTS AND SECTORIAL
COMPARATIVE
FINANCIAL ELEMENTS
Figures given in thousands €
|
|
2005 (12) |
2006 (12) |
2007 (12) |
% ASSETS |
|
|
|
|
|
|
BALANCE SHEET
ANALYSIS |
|
|
|
|
|
|
|
|
|
|
OWN FUNDS |
15.145,00 |
28.176,00 |
30.608,00 |
13,22 |
|
|
|
|
|
|
DEBT |
120.333,00 |
161.678,00 |
200.915,00 |
86,78 |
|
|
|
|
|
|
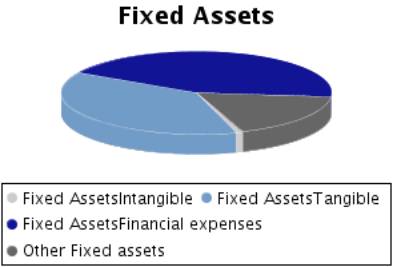
FIXED ASSETS |
21.863,00 |
42.342,00 |
54.018,00 |
23,33 |
|
|
|
|
|
|
TOTAL ASSETS |
135.478,00 |
189.854,00 |
231.523,00 |
|
|
|
|
|
|
|
|
2005 (12) |
2006 (12) |
2007 (12) |
% SALES |
|
|
|
|
|
|
PROFIT AND LOSS
ACCOUNT ANALYSIS |
|
|
|
|
|
|
|
|
|
|
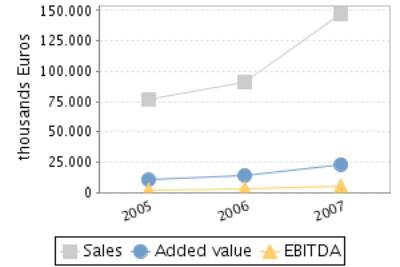
SALES |
76.760,00 |
90.680,00 |
146.946,00 |
|
|
|
|
|
|
|
ADDED VALUE |
10.120,00 |
14.043,00 |
23.109,00 |
15,73 |
|
|
|
|
|
|
EBITDA |
1.820,00 |
3.275,00 |
5.185,00 |
3,53 |
|
|
|
|
|
|
EBIT |
1.651,00 |
465,00 |
1.737,00 |
1,18 |
|
|
|
|
|
|
NET RESULT |
389,00 |
-291,00 |
3.382,00 |
2,30 |
|
|
|
|
|
Balance Sheets Items
Analysis


Balance Sheet Comments
Total assets of the company grew 40,14% between 2005 and 2006.
This growth is a consequence of the fixed assets increase of 93,67%.
This growth has been financed, on a wider scale, with a Shareholders’
equity increase of 86,04% and in a smaller proportion with an debt increase of
34,36%.
Total assets of the company grew 21,95% between 2006 and 2007.
This growth is a consequence of the fixed assets increase of 27,58%.
This growth has been mainly financed with a debt increase of 24,27%.
Nevertheless the net worth increased 8,63%.
Profit and Loss Account Analysis

Profit and Loss Account Comments
The company’s sales figure grew 18,13% between 2005 and 2006.
The company’s EBIT decreased in 71,84% between 2005 and 2006.
This evolution implies a reduction in the company’s operating
profitability.
The result of these variations is a decrease of the company’s Economic
Profitability of 79,90% in the analysed period, being this profitability of
0,24% in the year 2006.
The company’s Net Result decreased in 174,81% between 2005 and 2006.
This evolution, compared to the EBIT’s performance, implies that the
financial and extraordinary activities have had a negative effect in the
company’s Financial Profitability.
The result of these variations is a reduction of the company’s
profitability of 140,21% in the analysed period, being equal to -1,03% in the
year 2006.
The company’s sales figure grew 62,05% between 2006 and 2007.
The company’s EBIT grew 273,55% between 2006 and 2007.
This evolution implies an increase in the company’s operating
profitability.
The result of these variations is an increase of the company’s Economic
Profitability of 206,33% in the analysed period, being this profitability of
0,75% in the year 2007.
The company’s Net Result grew 1.262,20% between 2006 and 2007.
This evolution, compared to the EBIT’s performance, implies that the
financial and extraordinary activities have had a positive effect in the
company’s Financial Profitability.
The result of these variations is an increase of the company’s Economic
Profitability of 1.169,85% in the analysed period, being equal to 11,05% in the
year 2007.
ANNUAL FINANCIAL REPORT ADDITIONAL DATA
Source: annual financial report 2007
Results Distribution
Figures given in €
|
DISTRIBUTION
BASE |
DISTRIBUTION TO |
||
|
Profit and Loss |
3.382.000,00 |
Retained earnings |
338.000,00 |
|
Carry Over |
0,00 |
Voluntary Reserve |
3.044.000,00 |
|
Voluntary reserves |
0,00 |
Prior years losses |
0,00 |
|
Reserves |
0,00 |
Carry Over |
0,00 |
|
Other concepts |
0,00 |
Other funds |
0,00 |
|
Total of Amounts to be distributed |
3.382.000,00 |
Dividends |
0,00 |
|
|
|
Other Applications |
0,00 |
Auditing
Auditors’ opinion: FAVOURABLE
Auditor: DELOITTE S.L.
COMPARATIVE SECTOR ANALYSIS
Values table
Figures expressed in %
|
|
COMPANY (2007) |
SECTOR |
DIFFERENCE |
DIFFERENCE RELATIVE |
|
|
|
|
|
|
BALANCE SHEET
ANALYSIS: % on the total assets |
|
|
|
|
|
|
|
|
|
|
OWN FUNDS |
13,22 |
24,40 |
-11,18 |
-45,82 |
|
|
|
|
|
|
DEBT |
86,78 |
75,60 |
11,18 |
14,79 |
|
|
|
|
|
|
FIXED ASSETS |
23,33 |
30,56 |
-7,23 |
-23,66 |
|
|
|
|
|
|
|
|
|
|
|
|
|
|
|
|
|
|
COMPANY (2007) |
SECTOR |
DIFFERENCE |
DIFFERENCE RELATIVE |
|
|
|
|
|
|
PROFIT AND LOSS
ACCOUNT ANALYSIS: % on the total operating income |
|
|
|
|
|
|
|
|
|
|
SALES |
94,38 |
97,80 |
-3,41 |
-3,49 |
|
|
|
|
|
|
ADDED VALUE |
14,84 |
24,21 |
-9,37 |
-38,69 |
|
|
|
|
|
|
EBIT |
1,12 |
8,76 |
-7,64 |
-87,26 |
|
|
|
|
|
|
NET RESULT |
2,17 |
6,54 |
-4,36 |
-66,76 |
|
|
|
|
|
Sector Composition
Compared sector (NACE): 452
Number of companies: 216
Size (Sales Figure) : > 40.000.000,00
Euros
Comments on the sectorial comparative
Compared to its sector the assets of the companies show an inferior
proportion of fixed assets. Specifically the difference with the sector average
is -7,23% , which means a relative difference of -23,66% .
In liabilities composition the company appeals on a wider scale to self
financing, being the proportion of net worth of 11,18% inferior, which means a
relative difference of 45,82% 11,18% more than the sector, which means a
difference of 14,79% .
The proportion that the sales mean to the company’s total ordinary
income is 94,38%, 3,41% lower than in the sector, which means a relative
difference of 3,49% .
The company’s EBIT was positive and was 1,12% with regard to the total
ordinary income, 7,64% less than the sector, which means a relative difference
of 87,26% .
The company’s capacity to generate operating income is equal to that of
the sector as its ratio EBIT/Sales is also equal.
The company’s net result was positive and equal to 2,17% with regard to
the total ordinary income, 4,36% less than the sector, which means a relative
difference of 66,76% .
The financial and extraordinary results and the tax impact have had a
more positive impact on the Net result in the company than in the sector; as a consequence,
the company shows a better Net Result/EBIT ratio.
ADDRESSES
Current Legal Seat Address:
AVENIDA LA BUHAIRA, 2
41018
SEVILLA
Characteristics
of the current address
Type of premises: office
Property: owned; with no official confirmation
Local Situation: secondary
|
STREET |
POSTAL CODE |
TOWN |
PROVINCE |
|
STREET FERNANDO
EL SANTO 27 |
28010 |
MADRID |
Madrid |
|
POLIGONO INDUSTRIAL
LA CELULOSA S-N |
04007 |
ALMERIA |
Almería |
|
PASAJE EMPORDA 4 |
25111 |
RAIMAT |
Lérida |
|
STREET BRAVO MURILLO 203 |
28020 |
MADRID |
Madrid |
|
SANTO ESTEVO, S/N |
32160 |
NOGUEIRA |
Orense |
5 branches registered
CORPORATE STRUCTURE
ADMINISTRATIVE LINKS
Main Board members, Directors and Auditor ![]()
|
POSITION |
SURNAMES AND
NAME |
APPOINTMENT DATE |
|
|
PRESIDENT |
MOLINA MONTES JAVIER |
30/12/2005 |
|
|
CHIEF OFFICER |
BRAVO MANCHENO GUILLERMO |
23/06/2004 |
|
|
CHIEF OFFICER |
MARIN HITA ANTONIO |
30/12/2005 |
|
|
AUDITOR |
APPOINTMENT DATE |
||
|
DELOITTE SL |
14/10/2008 |
||
Functional Managers
|
POSITION |
SURNAMES AND
NAME |
|
General Manager |
MOLINA MONTES JAVIER |
|
Financial Manager |
GARCIA HERNANDEZ IGNACIO |
|
Human Resources Manager |
POLO ALVARO |
FINANCIAL LINKS
|
|
BUSINESS NAME |
CIF / COUNTRY |
% |
SOURCE |
DATA INF. |
|
|
BEFESA MEDIO AMBIENTE SA |
A80689052 |
100,00 |
OWN SOURCES |
20/02/2008 |
|
|
BUSINESS NAME |
CIF / COUNTRY |
% |
SOURCE |
DATA INF. |
|
|
ABENSUR TRADING
COMPANY S.A. |
URUGUAY |
100,00 |
TRADE REG. |
31/12/2005 |
|
|
BEFESA CTA
QINGDAO SL |
B84941095 |
100,00 |
OWN SOURCES |
28/03/2008 |
|
|
BEFESA FLUIDOS,
S.A. |
A33031071 |
100,00 |
B.O.R.M.E. |
20/08/2008 |
|
|
BEFESA AGUA TENES
S.L. |
B91750646 |
100,00 |
B.O.R.M.E. |
07/07/2008 |
|
|
CONSTRUCCIONES Y
DEPURACIONES SA |
A41350679 |
100,00 |
TRADE REG. |
31/12/2007 |
|
|
BEFESA
INFRAESTRUCTURAS INDIA SL |
INDIA |
100,00 |
TRADE REG. |
31/12/2007 |
CREDIT INFORMATION
Constitution Date: 05/10/1990
Business activity 
Activity: Construction and civil works
NACE Code: 4520
NACE Activity: Building of
complete constructions or parts thereof; civil engineering
Business: CONSTRUCCION, REPARACION, REHABILITACION,
CONSOLIDACION, RESTAURACION, DECORACION, ORNAMENTACION, CONSERVACION Y
MANTENIMIENTO, TRATAMIENTO Y DISTRIBUCION DE OBRAS, DE EDIFICACIONES
HIDRAULICAS, VIALES Y PISTAS MARITIMAS
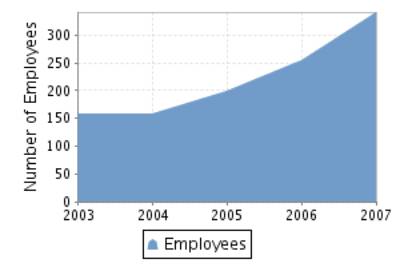
Employees 
Number of total employees: 157 (2008)
Number of fixed employees: 45,75%
Number of temporary employees: 54,25%
Employees evolution
COMMERCIAL OPERATIONS 
SALES
Collection (estimated):
On a credit basis: 100%
National Distribution: 100%
Banks 
|
ENTITY |
BRANCH |
ADDRESS |
TOWN OR CITY |
PROVINCE |
|
BANCO BILBAO
VIZCAYA ARGENTARIA, S.A. |
6000 |
GRANADA, 1 |
SEVILLA |
Sevilla |
|
BANCO SANTANDER,
S.A. |
|
|
SEVILLA |
|
|
BANKINTER, S.A. |
|
|
SEVILLA |
|
|
BARCLAYS BANK,
S.A. |
0034 |
CL TETUAN 30 |
SEVILLA |
Sevilla |
|
CAIXA D’ESTALVIS
DE CATALUNYA |
|
|
SEVILLA |
|
8 bank entities registered
Brands, Signs and Commercial
Names 
FORMER NAMES:
•
BEFESA CONSTRUCCION Y TECNOLOGIA AMBIENTAL, S.A.
•
ABENSUR SERVICIOS URBANOS SA
LEGAL STRUCTURE
Constitution Data
Register Date: 05/10/1990
Register town: Sevilla
Announcement number: 32347
Legal form: JOINT STOCK
COMPANY
Current Legal Form: JOINT STOCK
COMPANY
Current Capital:
10.290.000,00 €
Legal Aspects
Obligation to fill in Financial
Statements: YES
Chamber census: YES (2006)
Listed on a Stock Exchange: NO
B.O.R.M.E.(Official Companies
Registry Gazette) 
Registered Proceedings
|
PROCEEDINGS |
DATE |
NOTICE NUM. |
TRADE REG. |
|
Re-elections |
14/10/2008 |
474038 |
Sevilla |
|
Resignations |
09/10/2008 |
467334 |
Sevilla |
|
Appointments |
09/10/2008 |
467334 |
Sevilla |
|
Appointments |
02/10/2008 |
457323 |
Sevilla |
Other Proceedings published
|
PROCEEDINGS |
DATE |
NOTICE NUM. |
TRADE REG. |
|
Registration of accounts (2007) Individual |
09/10/2008 |
816876 |
Sevilla |
Press articles

23/10/2008 CINCO DIAS (FINANCIAL INFORMATION)
EL GRUPO ABENGOA PREVE CERRAR EL AÑO CON UNA CARTERA DE 508,2 MM. DE
EUROS EN LA DIVISION BEFESA WATER EPC DE SU FILIAL MEDIOAMBIENTAL.
14/10/2008 CINCO DIAS (SUBSIDIARIES INFORMATION)
BEFESA MEDIO AMBIENTE HA LLEGADO A UN ACUERDO PARA ADQUIRIR, A TRAVES DE
SU FILIAL BEFESA AGUA, EL 51% DE LA CIA. ESTADOUNIDENSE DE INGENIERIA Y
CONSTRUCCION DE PLANTAS DE AGUA NRS CONSULTING ENGINEERS, QUE FACTURA UNOS 7,5
MM. DE DOLARES (5,51 MM. DE EUROS). ESTA ADQUISICION SUPONE LA ENTRADA DE
BEFESA EN EEUU A TRAVES DE UNA SDAD. ALTAMENTE ESPECIALIZADA EN DESALACION, LO
QUE LES DARA LA OPORTUNIDAD DE CRECER EN ESTE MERCADO, SEGUN JAVIER MOLINA,
PRESIDENTE DE LA FIRMA.
Complementary Information
Segun BORME (SECCION SEGUNDA) del 02/06/04
la sociedad esta en pro-
ceso de absorber a ABENSUR MEDIO AMBIENTE SA NIF A91034132.
FINANCIAL INFORMATION
The information on the last account contained in this report is extracted
from the Mercantile Register file of the legal address of the Company and
dated 20/10/2008.
BALANCE SHEET
Assets
Figures given in thousands €
|
|
31/12/2005 (12) |
31/12/2006 (12) |
31/12/2007 (12) |
|
A) DUE FROM SHAREHOLDERS FOR UNCALLED CAPITAL |
|
|
|
|
B) FIXED ASSETS |
21.863,00 |
42.342,00 |
54.018,00 |
|
I. Incorporation costs |
|
|
|
|
II. Intangible fixed assets |
367,00 |
376,00 |
444,00 |
|
R & D expenses |
|
868,00 |
1.888,00 |
|
Concessions,
patents, licences , trademarks |
174,00 |
|
|
|
Goodwill |
|
|
|
|
Acquired rights from finance leases |
|
|
|
|
Software |
451,00 |
634,00 |
868,00 |
|
Leasing |
|
112,00 |
112,00 |
|
Cash advance |
|
|
|
|
Provisions |
|
|
|
|
Depreciation |
-258,00 |
-1.238,00 |
-2.424,00 |
|
III. Tangible fixed assets |
624,00 |
21.841,00 |
20.480,00 |
|
Property, plant and equipment |
|
|
61,00 |
|
Machinery, equipment and other |
582,00 |
22.752,00 |
22.738,00 |
|
Other property plant and equipment |
273,00 |
814,00 |
1.090,00 |
|
Prepaid expenses on fixed assets |
|
|
|
|
Other assets |
764,00 |
959,00 |
1.016,00 |
|
Provisions |
|
|
|
|
Depreciation |
-995,00 |
-2.684,00 |
-4.425,00 |
|
IV. Financial fixed assets |
11.300,00 |
10.539,00 |
23.491,00 |
|
Shares in affiliated companies |
8.754,00 |
6.283,00 |
9.499,00 |
|
Receivables in affiliated companies |
|
|
|
|
Shares in associated companies |
1,00 |
1.301,00 |
4.336,00 |
|
Loans to associated companies |
|
|
|
|
Securities |
|
|
|
|
Other loans |
4.557,00 |
4.218,00 |
4.013,00 |
|
Long term deposits and guarantees |
22,00 |
83,00 |
91,00 |
|
Provisions |
-2.034,00 |
-1.346,00 |
-423,00 |
|
Taxes receivable |
|
|
5.975,00 |
|
V.Owners equity |
|
|
|
|
VI.Long term trade liabilities |
9.572,00 |
9.586,00 |
9.603,00 |
|
C) DEFERRED EXPENSES |
|
|
|
|
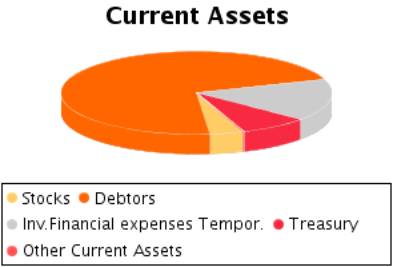
D) CURRENT ASSETS |
113.615,00 |
147.512,00 |
177.505,00 |
|
I. Shareholders by required outlays |
|
|
|
|
II. Stocks |
37.101,00 |
26.086,00 |
6.999,00 |
|
Goods available for sale |
|
|
|
|
Raw material inventory |
|
|
|
|
Work in Progress |
37.030,00 |
25.021,00 |
5.948,00 |
|
Finished goods |
|
|
|
|
Subproducts and recycled materials |
|
|
|
|
Cash advance |
71,00 |
1.065,00 |
1.051,00 |
|
Provisions |
|
|
|
|
III. Debtors |
40.313,00 |
66.984,00 |
126.349,00 |
|
Clients |
34.391,00 |
50.394,00 |
107.617,00 |
|
Amounts owned by affiliated companies |
1.149,00 |
1.105,00 |
1.078,00 |
|
Amounts owned by associated companies |
912,00 |
6.468,00 |
5.615,00 |
|
Other debts |
342,00 |
149,00 |
4.552,00 |
|
Staff Expenses |
|
585,00 |
579,00 |
|
Government |
3.929,00 |
8.381,00 |
7.006,00 |
|
Provisions |
-410,00 |
-98,00 |
-98,00 |
|
IV. Temporary financial investment |
21.936,00 |
38.081,00 |
29.270,00 |
|
Shares in affiliated companies |
|
|
|
|
Receivables in affiliated companies |
8.835,00 |
4.113,00 |
4.709,00 |
|
Shares in associated companies |
|
|
|
|
Loans to associated companies |
|
158,00 |
|
|
Short term investment |
652,00 |
1.433,00 |
4.684,00 |
|
Other loans |
12.436,00 |
32.238,00 |
19.781,00 |
|
Short Term Deposit and guarantees |
13,00 |
139,00 |
96,00 |
|
Provisions |
|
|
|
|
V. Short-term own shares |
|
|
|
|
VI. Treasury |
14.256,00 |
16.326,00 |
14.441,00 |
|
VII. Periodification adjustments |
9,00 |
35,00 |
446,00 |
|
ASSETS (A + B + C + D) |
135.478,00 |
189.854,00 |
231.523,00 |
Assets composition

Liabilities
Figures given in thousands €
|
|
31/12/2005 (12) |
31/12/2006 (12) |
31/12/2007 (12) |
|
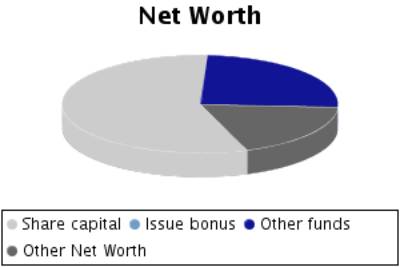
A) SHAREHOLDERS EQUITY |
15.145,00 |
14.854,00 |
18.236,00 |
|
I. Share capital |
10.290,00 |
10.290,00 |
10.290,00 |
|
II. Issue bonus |
|
|
|
|
III.Revaluation reserve |
|
|
|
|
IV.Reserves |
4.466,00 |
4.855,00 |
4.564,00 |
|
Retained earnings |
1.304,00 |
1.343,00 |
1.343,00 |
|
Sinking fund from owner equity |
|
|
|
|
Reserve for the parent company capital |
|
|
|
|
Statutory reserve |
|
|
|
|
Other funds |
3.162,00 |
3.512,00 |
3.221,00 |
|
Capital adjustments in Euros |
|
|
|
|
V.Results from previous years |
|
|
|
|
Carry Over |
|
|
|
|
Prior years losses |
|
|
|
|
Loans from partners for losses compensation |
|
|
|
|
VI.Profit and Losses |
389,00 |
-291,00 |
3.382,00 |
|
VII.Dividend paid during the year |
|
|
|
|
VIII.Own shares for capital reduction |
|
|
|
|
B) DEFERRED INCOME |
|
13.322,00 |
12.372,00 |
|
Capital grants |
|
13.322,00 |
12.372,00 |
|
Positive change difference |
|
|
|
|
Other deferred income |
|
|
|
|
Fiscal deferred income |
|
|
|
|
C) PROVISIONS FOR LIABILITIES AND EXPENSES |
|
|
225,00 |
|
Provision for pensions plans |
|
|
225,00 |
|
Provision for taxes |
|
|
|
|
Other provisions |
|
|
|
|
Reversion fund |
|
|
|
|
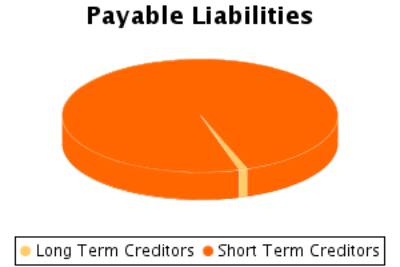
D) LONG TERM LIABILITIES |
2.579,00 |
2.757,00 |
2.024,00 |
|
I.Negotiable
bonds and other negotiable values |
|
|
|
|
Non convertible securities |
|
|
|
|
Convertible securities |
|
|
|
|
Other convertible debentures |
|
|
|
|
II.Debt with bank entities |
2.532,00 |
1.735,00 |
1.002,00 |
|
Long term bank loans |
2.532,00 |
1.735,00 |
1.002,00 |
|
Leasing |
|
|
|
|
III.Debts with associated and affiliated
companies |
|
|
|
|
With affiliated companies |
|
|
|
|
Associated companies |
|
|
|
|
IV. Other creditors |
|
|
|
|
Bills payable |
|
|
|
|
Other debts |
|
|
|
|
Long term deposit and guaranties |
|
|
|
|
Taxes receivable |
|
|
|
|
V. Deferred debts on shares |
47,00 |
1.022,00 |
1.022,00 |
|
From affiliated companies |
47,00 |
47,00 |
47,00 |
|
From associated companies |
|
975,00 |
975,00 |
|
Other companies |
|
|
|
|
VI. Long term debt with creditor |
|
|
|
|
E) SHORT TERM LIABILITIES |
117.754,00 |
158.921,00 |
198.666,00 |
|
I.Negotiable
bonds and other negotiable values |
|
|
|
|
Non convertible securities |
|
|
|
|
Convertible securities |
|
|
|
|
Other convertible debentures |
|
|
|
|
Interests from bonds |
|
|
|
|
II.Debt with bank entities |
1.592,00 |
6.539,00 |
7.773,00 |
|
Loans and other debts |
1.592,00 |
6.539,00 |
7.773,00 |
|
Debt interest |
|
|
|
|
Leasing |
|
|
|
|
III. Short term debts with associated and
affiliated companies |
25.929,00 |
45.688,00 |
63.445,00 |
|
With affiliated companies |
24.213,00 |
44.053,00 |
62.723,00 |
|
Associated companies |
1.716,00 |
1.635,00 |
722,00 |
|
IV. Commercial creditors |
87.665,00 |
103.342,00 |
116.348,00 |
|
Accounts payable |
19.379,00 |
11.563,00 |
4.083,00 |
|
Expenses |
68.286,00 |
91.779,00 |
112.265,00 |
|
Bills payable |
|
|
|
|
V. Other non-commercial debt |
1.446,00 |
3.329,00 |
11.077,00 |
|
Government |
574,00 |
1.823,00 |
1.373,00 |
|
Bills payable |
467,00 |
|
|
|
Other debts |
53,00 |
1.420,00 |
9.577,00 |
|
Accounts receivable |
352,00 |
86,00 |
127,00 |
|
Short term deposits and guarantees |
|
|
|
|
VI. Provisions for current assets |
1.122,00 |
23,00 |
23,00 |
|
VII. Periodification adjustments |
|
|
|
|
F) SHORT TERM PROVISIONS FOR LIABILITIES AND
EXPENSES |
|
|
|
|
LIABILITIES (A + B + C + D + E + F) |
135.478,00 |
189.854,00 |
231.523,00 |
Liabilities
Composition

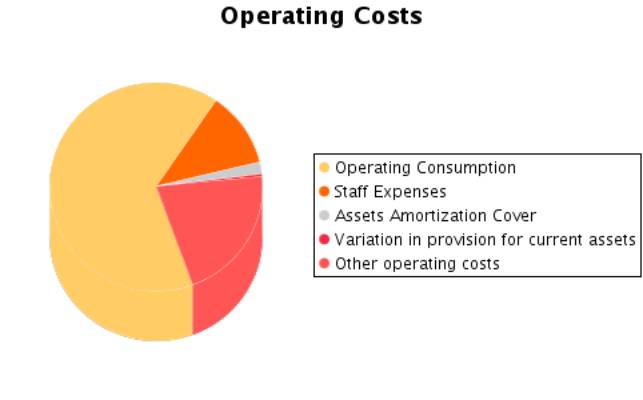
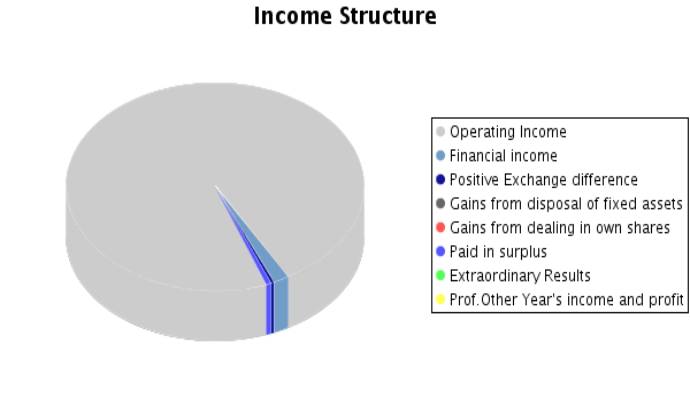
PROFIT AND LOSS ACCOUNT
Itams of the Profit and Loss Account
Figures given in thousands €
|
|
31/12/2005 (12) |
31/12/2006 (12) |
31/12/2007 (12) |
|
A) EXPENSES (A.1 a A.16) |
77.161,00 |
93.315,00 |
156.532,00 |
|
A.1.Reduction in stocks of finished goods and
work in progress |
12.371,00 |
12.009,00 |
19.932,00 |
|
A.2.Supplies |
36.298,00 |
46.691,00 |
80.263,00 |
|
Material consumed |
|
|
|
|
Raw materials consumed |
7.026,00 |
12.372,00 |
34.903,00 |
|
Other expenses |
29.272,00 |
34.319,00 |
45.360,00 |
|
A.3. Labour cost |
8.300,00 |
10.768,00 |
17.924,00 |
|
Wages |
6.717,00 |
8.649,00 |
15.137,00 |
|
Social security expenses |
1.583,00 |
2.119,00 |
2.787,00 |
|
A.4. Assets depreciation |
169,00 |
2.669,00 |
2.927,00 |
|
A.5.Variance in the traffic provisions |
|
141,00 |
521,00 |
|
Variance in provision for inventory |
|
|
521,00 |
|
Variance in provision for bad debts |
|
141,00 |
|
|
Variance in provision for other current assets |
|
|
|
|
A.6. Other operating costs |
18.044,00 |
17.978,00 |
32.387,00 |
|
External costs |
17.635,00 |
17.340,00 |
31.302,00 |
|
Taxes |
150,00 |
109,00 |
561,00 |
|
Other day to day expenses |
259,00 |
529,00 |
524,00 |
|
Allowance to reversion fund |
|
|
|
|
A.I.OPERATING
RESULT (B.1+B.2+B.3+B.4-A.1-A.2-A.3-A.4-A.5-A.6) |
1.651,00 |
465,00 |
1.737,00 |
|
A.7.Financial expenses and similar |
1.939,00 |
2.773,00 |
6.970,00 |
|
Debts with related companies |
1.195,00 |
1.428,00 |
3.476,00 |
|
Debts with associated companies |
|
40,00 |
138,00 |
|
Other companies debts By debts with third parties and similar expenses |
744,00 |
1.305,00 |
3.356,00 |
|
Losses from financial investments |
|
|
|
|
A.8. Variation in financial investment provision |
|
|
|
|
A.9.Negative exchange difference |
413,00 |
79,00 |
491,00 |
|
A.II.POSITIVE FINANCIAL RESULTS
(B.5+B.6+B.7+B.8-A.7-A.8-A.9) |
|
|
|
|
A.III.PROFIT
FROM ORDINARY ACTIVITIES (A.I+A.II-B.I-B.II) |
11,00 |
|
|
|
A.10. Variation
in provision in fixed assets |
-582,00 |
1.117,00 |
-876,00 |
|
A.11. Losses in
fixed assets |
|
683,00 |
|
|
A.12. Losses
from own shares and bonds |
|
|
|
|
A.13.
Extraordinary charges |
|
|
168,00 |
|
A.14.Other
exercises’ expenses and losses |
|
|
|
|
A.IV.POSITIVE
EXTRAORDINARY RESULT (B.9+B.10+B.11+B.12+B.13-A.10-A.11-A.12-A.13-A.14) |
587,00 |
|
1.660,00 |
|
A.V.PROFIT
BEFORE TAXES (A.III+A.IV-B.III-B.IV) |
598,00 |
|
|
|
A.15.Corporate Taxes |
209,00 |
-1.593,00 |
-4.175,00 |
|
A.16. Other taxes |
|
|
|
|
A.VI.EXERCISE
RESULT (PROFIT) (A.V-A.14-A.15) |
389,00 |
|
3.382,00 |
|
B) INCOMES (B.1
a B13) |
77.550,00 |
93.024,00 |
159.914,00 |
|
B.1. Turnover |
76.760,00 |
90.680,00 |
146.946,00 |
|
Sales |
|
|
|
|
Services
provided |
76.760,00 |
90.680,00 |
146.946,00 |
|
Refunds and sale
reminders |
|
|
|
|
B.2.Increase in
inventory of finished goods and works in progress |
|
|
|
|
B.3.Expenses
capitalized |
|
|
1.020,00 |
|
B.4. Other
operating income |
73,00 |
41,00 |
7.725,00 |
|
Other incomes |
14,00 |
|
7.164,00 |
|
Grants |
59,00 |
41,00 |
561,00 |
|
Excess in
provision for liabilities and charges |
|
|
|
|
B.I.OPERATING
LOSSES (A.1+A.2+A.3+A.4+A.5+A.6-B.1-B.2-B.3-B.4) |
|
|
|
|
B.5.Incomes from share participations |
|
|
|
|
From affiliated companies |
|
|
|
|
From associated companies |
|
|
|
|
From other companies |
|
|
|
|
B.6.Income from other securities and credits to
fixed assets |
|
|
|
|
From affiliated companies |
|
|
|
|
From associated companies |
|
|
|
|
Other companies |
|
|
|
|
B.7.Other interests and similar |
358,00 |
493,00 |
2.782,00 |
|
From affiliated companies |
321,00 |
48,00 |
198,00 |
|
From associated companies |
|
104,00 |
|
|
Other Interests |
37,00 |
341,00 |
2.584,00 |
|
Profits from investments |
|
|
|
|
B.8. Positive change difference |
354,00 |
76,00 |
489,00 |
|
B.II. NEGATIVE FINANCIAL RESULTS
(A.7+A.8+A.9-B.5-B.6-B.7-B.8) |
1.640,00 |
2.283,00 |
4.190,00 |
|
B.III.LOSSES
FROM ORDINARY ACTIVITIES (B.I+B.II-A.I-A.II) |
|
1.818,00 |
2.453,00 |
|
B.9.B.9. Gains
from disposal of fixed assets |
5,00 |
|
|
|
B.10.Gains from
dealing in own shares |
|
|
|
|
B.11. Paid in
surplus |
|
950,00 |
952,00 |
|
B.12.
Extraordinary income |
|
784,00 |
|
|
B.13.Other
year’s income and profits |
|
|
|
|
B.IV.NEGATIVE
EXTRAORDINARY LOSSES (A.10+A.11+A.12+A.13+A.14-B.9-B.10-B.11-B.12-B.13) |
|
66,00 |
|
|
B.V.LOSS BEFORE
TAXES (B.III+B.IV-A.III-A.IV) |
|
1.884,00 |
793,00 |
|
B.VI.EXERCISE RESULTS (LOSS) (B.V+A.14+A.15) |
|
291,00 |
|
Composition of the
Profit and Loss Account


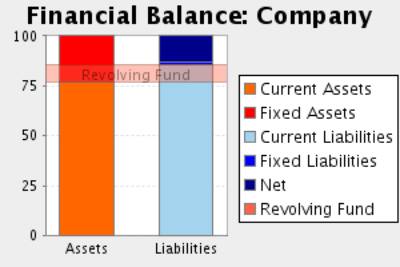
FINANCIAL BALANCE
Here the Main Capital Amounts of the company and the Revolving Fund
Evolution are analysed.
Financial Balance Table
Figures given in thousands €
|
|
31/12/2005 (12) |
% |
31/12/2006 (12) |
% |
31/12/2007 (12) |
% |
|
A) DUE FROM SHAREHOLDERS
FOR UNCALLED CAPITAL |
|
|
|
|
|
|
|
B) FIXED ASSETS |
21.863,00 |
16,14 |
42.342,00 |
22,30 |
54.018,00 |
23,33 |
|
C) DEFERRED
EXPENSES |
|
|
|
|
|
|
|
D) CURRENT
ASSETS |
113.615,00 |
83,86 |
147.512,00 |
77,70 |
177.505,00 |
76,67 |
|
ASSETS (A + B +
C + D) |
135.478,00 |
|
189.854,00 |
|
231.523,00 |
|
|
|
||||||
|
A) SHAREHOLDERS
EQUITY |
15.145,00 |
11,18 |
14.854,00 |
7,82 |
18.236,00 |
7,88 |
|
B) DEFERRED INCOME |
|
|
13.322,00 |
7,02 |
12.372,00 |
5,34 |
|
C) PROVISIONS
FOR LIABILITIES AND EXPENSES |
|
|
|
|
225,00 |
0,10 |
|
D) LONG TERM
LIABILITIES |
2.579,00 |
1,90 |
2.757,00 |
1,45 |
2.024,00 |
0,87 |
|
E) SHORT TERM
LIABILITIES |
117.754,00 |
86,92 |
158.921,00 |
83,71 |
198.666,00 |
85,81 |
|
F) SHORT TERM
PROVISIONS FOR LIABILITIES AND EXPENSES |
|
|
|
|
|
|
|
LIABILITIES (A +
B + C + D + E + F) |
135.478,00 |
|
189.854,00 |
|
231.523,00 |
|
Financial Balance
Composition


Comments on Financial Balance
In the 2005, the assets of the company were formed in 16,14% of Fixed
Assets and in 83,86% of Current Assets.This assets were financed in 11,18% with
own capitals, and in 1,90% with long term debt and in 86,92% with current liabilities.
The result of this financial structure is a negative turnover fund of
-4.139,00 thousands Euros, which is equivalent to -3,06% proportion of the
company’s total assets.
In the 2006, the assets of the company were formed in 22,30% of Fixed
Assets and in 77,70% of Current Assets.This assets were financed in 14,84% with
own capitals, and in 1,45% with long term debt and in 83,71% with current
liabilities.
The result of this financial structure is a negative turnover fund of
-11.409,00 thousands Euros, which is equivalent to -6,01% proportion of
the company’s total assets.
This measure has diminished with respect to the previous exercise in
175,65% having also diminished its proportion with respect to the total assets
of the company.
In the 2007, the assets of the company were formed in 23,33% of Fixed
Assets and in 76,67% of Current Assets.This assets were financed in 13,22% with
own capitals, and in 0,97% with long term debt and in 85,81% with current
liabilities.
The result of this financial structure is a negative turnover fund of
-21.161,00 thousands Euros, which is equivalent to -9,14% proportion of
the company’s total assets.
This measure has diminished with respect to the previous exercise in
85,48% having also diminished its proportion with respect to the total assets
of the company.
RATIOS
Main Ratios
|
|
31/12/2005 (12) |
31/12/2006 (12) |
31/12/2007 (12) |
|
STRUCTURAL RATIOS |
|
|
|
|
Management fund |
-4.139,00 |
-11.409,00 |
-21.161,00 |
|
Management Fund Requirement |
-38.739,00 |
-59.277,00 |
-57.099,00 |
|
Indebtedness (%) |
88,82 |
85,16 |
86,78 |
|
External Funds on Net Worth |
7,94 |
5,74 |
6,56 |
|
GENERAL ACTIVITY RATIO |
|
|
|
|
Turnover Increase (%) |
55,79 |
18,13 |
62,05 |
|
Added value growth (%) |
-5,69 |
38,76 |
64,56 |
|
Cash Flow |
-24,00 |
3.636,00 |
5.954,00 |
|
Labour Productivity |
1,22 |
1,30 |
1,29 |
|
Assets turnover |
0,57 |
0,48 |
0,64 |
|
Breakdown Point |
72.328,98 |
89.403,57 |
150.817,94 |
|
Security Margin of the Breakdown Point (%) |
5,86 |
1,45 |
3,13 |
|
ACTIVITY RATIOS |
|
|
|
|
Average Payment Period |
648 |
634 |
418 |
|
Average Collection Period |
189 |
266 |
310 |
|
Inventory Turnover Period |
174 |
104 |
17 |
|
SOLVENCY RATIOS |
|
|
|
|
Payback Capacity |
0,00 |
0,02 |
0,03 |
|
Assets Guarantee |
1,13 |
1,17 |
1,15 |
|
Short Term Debts Proportion (%) |
97,86 |
98,30 |
98,88 |
|
Interest Coverage |
-0,08 |
0,08 |
0,37 |
|
LIQUIDITY RATIOS |
|
|
|
|
Current Ratio |
0,96 |
0,93 |
0,89 |
|
Immediate liquidity |
0,31 |
0,34 |
0,22 |
|
Treasury |
34.600,00 |
47.868,00 |
35.938,00 |
|
Sales on Current Assets |
243 |
221 |
298 |
Results Analysis
Ratios
|
|
31/12/2005 (12) |
31/12/2006 (12) |
31/12/2007 (12) |
|
Economic profitability (%) |
1,22 |
0,24 |
0,75 |
|
Operating Profitability (%) |
2,15 |
0,51 |
1,18 |
|
Equity gearing |
0,06 |
-26,34 |
-10,68 |
|
Financial profitability (%) |
2,57 |
-1,03 |
11,05 |
|
General Profitability (%) |
0,51 |
-0,32 |
2,30 |
Comments on the
Results Analysis Ratios
The economic profitability in the year2006 achieved a 0,24% positive
level, due to a 0,51% economic margin and to an assets turnover of0,48%.
The economic profitability in the year has reduced from 1,22% up to
0,24% of2006, even if it remains positive. This fall is due to the decrease in
operating profitability, that has passe from 2,15% to 0,51%, as assets turnover
whose index has passed from 0,57 to 0,48%.
Financial profitability on 2006The economic profitability in the year
-1,03
The company’s financial structure has endangered its profitability with
an indebtedness level -26,34.
The general profitability on 2006The economic profitability in the year
-0,32
The economic profitability in the year2007 achieved a 0,75% positive
level, due to a 1,18% economic margin and to an assets turnover of0,64%.
The economic profitability in the year has increased from 0,24% up to
0,75%. This growth is due to the economic margin increase, from 0,51% to the
current 1,18Y%, and to the assets turnover index, which in the last period has
achieved 0,64, compared to 0,48 del 2006.
Financial profitability on 2007 achieved a 11,05%.
The company’s financial structure has endangered its profitability with
an indebtedness level -10,68.
The general profitability on 2007 achieved a 2,30%.
SECTORIAL ANÁLYSIS
Large Capital Amounts and Financial Balance
Figures given in %
|
|
COMPANY (2007) |
SECTOR |
DIFFERENCE |
DIFFERENCE RELATIVE |
|
|
|
|
|
|
ASSETS |
|
|
|
|
|
|
|
|
|
|
A) DUE FROM
SHAREHOLDERS FOR UNCALLED CAPITAL |
|
0,01 |
|
|
|
|
|
|
|
|
B) FIXED ASSETS |
23,33 |
30,56 |
-7,23 |
-23,67 |
|
|
|
|
|
|
C) DEFERRED
EXPENSES |
|
2,09 |
|
|
|
|
|
|
|
|
D) CURRENT
ASSETS |
76,67 |
67,34 |
9,33 |
13,85 |
|
|
|
|
|
|
ASSETS (A + B +
C + D) |
100 |
100 |
|
|
|
|
|
|
|
|
|
|
|
|
|
|
|
|
|
|
|
|
COMPANY (2007) |
SECTOR |
DIFFERENCE |
DIFFERENCE RELATIVE |
|
|
|
|
|
|
LIABILITIES |
|
|
|
|
|
|
|
|
|
|
A) SHAREHOLDERS
EQUITY |
7,88 |
24,16 |
-16,28 |
-67,39 |
|
|
|
|
|
|
B) DEFERRED
INCOME |
5,34 |
0,24 |
5,10 |
2.172,34 |
|
|
|
|
|
|
C) PROVISIONS
FOR LIABILITIES AND EXPENSES |
0,10 |
5,48 |
-5,38 |
-98,17 |
|
|
|
|
|
|
D) LONG TERM
LIABILITIES |
0,87 |
12,54 |
-11,67 |
-93,06 |
|
|
|
|
|
|
E) SHORT TERM
LIABILITIES |
85,81 |
57,49 |
28,32 |
49,25 |
|
|
|
|
|
|
F) SHORT TERM
PROVISIONS FOR LIABILITIES AND EXPENSES |
|
0,09 |
|
|
|
|
|
|
|
|
LIABILITIES (A +
B + C + D + E + F) |
100 |
100 |
|
|
|
|
|
|
|
Sectorial Financial
Balance Comparison

Comments to the Sectorial Analysis
In the 2007, the assets of the company were formed in 23,33% of fixed
assets and in 76,67Current Assets % In the sector, the proportion of fixed
assets was of 32,66%, 28,56% superior, and the proportion of current assets was
of 67,34%, 13,85% inferior.
The assets were financed in the company in 13,22% with own capitals , in
0,97% with fixed liabilities and in 85,81% with current liabilities In the
sector, the self financing represented 24,40%, 45,82% superior. On the other
hand the long term debts represented in the sector an average of 18,02%
financing, with a relative difference of 94,62% favourable to the sectorAnd,
short term liabilities represented in the sector an average of 57,58%
financing, with a relative difference of 49,02% in favour of the company
The result of this company’s financial structure is a turnover fund that
represents -9,14% of the total assets; in the sector, this same proportion is
9,76%, therefore, we can say that the company’s turnover fund is 193,65%
smaller than the sector one.
Analytical Account of Results
Figures given in %
|
|
COMPANY (2007) |
SECTOR |
DIFFERENCE |
DIFFERENCE RELATIVE |
|
Turnover |
94,38 |
97,80 |
-3,42 |
-3,49 |
|
Other operating income |
5,62 |
2,20 |
3,42 |
154,99 |
|
Production Value |
100,00 |
100,00 |
0,00 |
0,00 |
|
Operating expenses |
64,36 |
63,29 |
1,07 |
1,69 |
|
Other operation expenses |
20,80 |
12,50 |
8,30 |
66,41 |
|
Added value |
14,84 |
24,21 |
-9,37 |
-38,71 |
|
Labour cost |
11,51 |
13,86 |
-2,35 |
-16,94 |
|
Gross Economic Result |
3,33 |
10,35 |
-7,02 |
-67,84 |
|
Assets depreciation |
1,88 |
1,17 |
0,71 |
60,55 |
|
Variation in provision for current assets and bad debt losses |
0,33 |
0,43 |
-0,10 |
-22,90 |
|
Net Economic Result |
1,12 |
8,76 |
-7,64 |
-87,21 |
|
Financial income |
2,10 |
2,01 |
0,09 |
4,63 |
|
Financial Charges |
4,79 |
1,38 |
3,42 |
248,36 |
|
Variation in financial investment provision |
|
0,01 |
|
|
|
Ordinary
Activities Result |
-1,58 |
9,38 |
-10,96 |
-116,85 |
|
Extraordinary income |
0,61 |
0,58 |
0,03 |
5,35 |
|
Extraordinary charges |
0,11 |
0,70 |
-0,59 |
-84,38 |
|
Variation in provision in fixed assets |
-0,56 |
0,10 |
-0,66 |
-660,00 |
|
Results before Taxes |
-0,51 |
9,15 |
-9,66 |
-105,57 |
|
Corporate taxes |
-2,68 |
2,61 |
-5,29 |
-202,52 |
|
Net Result |
2,17 |
6,54 |
-4,36 |
-66,79 |
|
Assets depreciation |
1,88 |
1,17 |
0,71 |
60,55 |
|
Change of Provisions |
-0,23 |
0,54 |
-0,77 |
-142,44 |
|
Net Self-Financing |
3,82 |
8,25 |
-4,43 |
-53,69 |
Main Ratios
|
|
COMPANY (2007) |
PTILE25 |
PTILE50 |
PTILE75 |
|
STRUCTURAL RATIOS |
|
|
|
|
|
Management fund |
-21.161,00 |
2.495,25 |
8.669,03 |
23.448,03 |
|
Management Fund
Requirement |
-57.099,00 |
-23.005,35 |
-7.911,03 |
4.299,98 |
|
Indebtedness (%) |
86,78 |
71,80 |
81,95 |
88,31 |
|
External Funds
on Net Worth |
6,56 |
2,55 |
4,54 |
7,55 |
|
GENERAL ACTIVITY
RATIO |
|
|
|
|
|
Turnover Increase (%) |
62,05 |
3,85 |
16,40 |
36,99 |
|
Added value growth (%) |
64,56 |
-0,69 |
12,44 |
28,86 |
|
Cash Flow |
5.954,00 |
2.393,83 |
4.826,74 |
10.580,23 |
|
Labour Productivity |
1,29 |
1,32 |
1,60 |
2,20 |
|
Assets turnover |
0,64 |
0,69 |
0,99 |
1,24 |
|
Breakdown Point |
150.817,94 |
39.143.019,55 |
57.183.598,59 |
94.517.614,24 |
|
Security Margin
of the Breakdown Point (%) |
3,13 |
11,59 |
18,42 |
33,21 |
|
ACTIVITY RATIOS |
|
|
|
|
|
Average Payment
Period |
418 |
168 |
241 |
315 |
|
Average
Collection Period |
310 |
137 |
184 |
223 |
|
Inventory
Turnover Period |
17 |
7 |
25 |
145 |
|
SOLVENCY RATIOS |
|
|
|
|
|
Payback Capacity |
0,03 |
0,04 |
0,07 |
0,11 |
|
Assets Guarantee |
1,15 |
1,13 |
1,22 |
1,39 |
|
Short Term Debts
Proportion (%) |
98,88 |
79,50 |
92,29 |
98,03 |
|
Interest
Coverage |
0,37 |
2,16 |
5,52 |
13,96 |
|
LIQUIDITY RATIOS |
|
|
|
|
|
Current Ratio |
0,89 |
1,04 |
1,15 |
1,39 |
|
Immediate
liquidity |
0,22 |
0,06 |
0,15 |
0,33 |
|
Treasury |
35.938,00 |
-7.596,92 |
1.122,28 |
17.345,28 |
|
Sales on Current Assets |
298 |
330 |
420 |
544 |
Results Analysis
Ratios
|
|
COMPANY (2007) |
PTILE25 |
PTILE50 |
PTILE75 |
|
Economic profitability (%) |
0,75 |
3,57 |
5,34 |
9,17 |
|
Operating Profitability (%) |
1,18 |
3,47 |
5,91 |
11,74 |
|
Equity gearing |
-10,68 |
3,34 |
5,42 |
7,65 |
|
Financial profitability (%) |
11,05 |
12,29 |
21,65 |
31,47 |
|
General Profitability (%) |
2,30 |
2,17 |
4,03 |
8,21 |
NOTES
ABOUT YOUR REQUEST.
The address included in your enquiry belongs to a branch.
FOREIGN EXCHANGE
RATES
|
Currency |
Unit
|
Indian Rupees |
|
US Dollar |
1 |
Rs.48.79 |
|
UK Pound |
1 |
Rs.75.41 |
|
Euro |
1 |
Rs.61.48 |
RATING
EXPLANATIONS
|
RATING |
STATUS |
PROPOSED CREDIT LINE |
|
|
>86 |
Aaa |
Possesses an extremely sound financial base with the strongest capability
for timely payment of interest and principal sums |
Unlimited |
|
71-85 |
Aa |
Possesses adequate working capital. No caution needed for credit
transaction. It has above average (strong) capability for payment of interest
and principal sums |
Large |
|
56-70 |
A |
Financial & operational base are regarded healthy. General
unfavourable factors will not cause fatal effect. Satisfactory capability for
payment of interest and principal sums |
Fairly Large |
|
41-55 |
Ba |
Overall operation is considered normal. Capable to meet normal
commitments. |
Satisfactory |
|
26-40 |
B |
Unfavourable & favourable factors carry similar weight in credit
consideration. Capability to overcome financial difficulties seems comparatively
below average. |
Small |
|
11-25 |
Ca |
Adverse factors are apparent. Repayment of interest and principal sums
in default or expected to be in default upon maturity |
Limited with
full security |
|
<10 |
C |
Absolute credit risk exists. Caution needed to be exercised |
Credit not
recommended |
|
NR |
In view of the lack of information, we have no basis upon which to
recommend credit dealings |
No Rating |
|
This score serves as a reference to assess SC’s credit risk
and to set the amount of credit to be extended. It is calculated from a
composite of weighted scores obtained from each of the major sections of this
report. The assessed factors and their relative weights (as indicated through
%) are as follows:
Financial
condition (40%) Ownership
background (20%) Payment
record (10%)
Credit history
(10%) Market trend
(10%) Operational
size (10%)