![]()
MIRA
INFORM REPORT
|
Report Date : |
11.11.2008 |
IDENTIFICATION
DETAILS
|
Name : |
EFICIENCIA Y TECNOLOGIA SA. |
|
|
|
|
Registered Office : |
Street Bellvei,
41 (49 Nav 9 Pg Ind Can Salvatella), Cp 08210, Barbera Del
Valles Barcelona |
|
|
|
|
Country : |
Spain |
|
|
|
|
Financials (as on) : |
31.12.2007 |
|
|
|
|
Date of Incorporation : |
|
|
|
|
|
Legal Form : |
Joint Stock Company |
|
|
|
|
Line of Business : |
Manufacture
of Machinery for Food Beverages and Tabacco Processing |
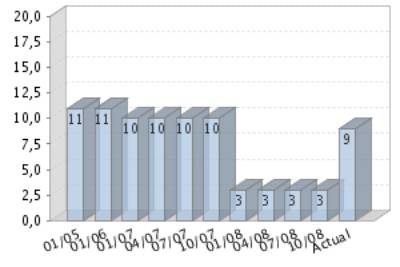
RATING &
COMMENTS
|
MIRA’s Rating : |
B |
|
RATING |
STATUS |
PROPOSED CREDIT LINE |
|
|
26-40 |
B |
Unfavourable & favourable factors carry similar weight in credit
consideration. Capability to overcome financial difficulties seems
comparatively below average. |
Small |
|
Maximum Credit Limit : |
44.997,78 € |
|
|
|
|
Status : |
Moderate |
|
|
|
|
Payment Behaviour : |
No Complaints |
|
|
|
|
Litigation : |
Clear |
FINANCIAL
REPORT
EFICIENCIA Y TECNOLOGIA SA.
TAX NUMBER: A63511224
EXECUTIVE SUMMARY
Identification
Current Business Name: EFICIENCIA Y TECNOLOGIA
SA.
Commercial Name: EFFYTEC PACKAGING
Other names: NO
Current Address: STREET BELLVEI,
41 (49 NAV 9 PG IND CAN SALVATELLA), CP 08210, BARBERA DEL VALLES BARCELONA
Telephone number: 937185840 Fax: 937188221
URL: www.effytec.com Corporate e-mail: info@effytec.com
Commercial Risk
Credit Appraisal: 44.997,78 €
RAI: NO
Legal Actions: NO
Financial
Information
Latest Balance sheet sales (2007): 7.109.291,55 € (MERCANTILE REGISTER)
Result: 407.018,3 €
Total Assets: 4.075.166 €
Social Capital: 600.000,00 €
Employees: 30
Commercial Information
Constitution Date: 07/05/2004
Business activity: Mfg. of machinery
for food beverages & tabacco proccessing
NACE Code: 2953
International Operations: Imports and
Exports
Corporate Structure
President:
Other Complementary Information
Latest proceeding published in BORME: 25/04/2008 Appointments
Bank Entities: Yes
Credit Appraisal
Maximum Credit
(from 0 a 6,000,000 €)
Favourable to 44.997,78 €
Rating Evolution
Financial Situation
Fiscal year2007
|
Treasury |
Limited |
|
Indebtedness |
Important |
|
Profitability |
Sufficient |
|
Balance |
Very Degraded |
Performance
|
Legal Actions |
None or Negligible |
|
Business
Trajectory |
Excellent |
COMPANY NOT REGISTERED IN THE R.A.I.
This company is not registered in the Disputed Bills register (R.A.I.)
INCIDENTS

Summary
LEGAL ACTIONS: No legal
incidences registered
CLAIM FILED AGAINST THE ADMINISTRATION: No administrative
claims registered
AFFECTED BY: No significant
element.
FINANCIAL ELEMENTS AND SECTORIAL
COMPARATIVE
FINANCIAL ELEMENTS
Figures given in €
|
|
2005 (12) |
2006 (12) |
2007 (12) |
% ASSETS |
|
|
|
|
|
|
BALANCE SHEET
ANALYSIS |
|
|
|
|
|
|
|
|
|
|
OWN FUNDS |
341.104,64 |
87.034,57 |
494.052,87 |
12,12 |
|
|
|
|
|
|
DEBT |
1.280.085,75 |
2.856.929,92 |
3.581.113,13 |
87,88 |
|
|
|
|
|
|
FIXED ASSETS |
503.379,69 |
736.354,44 |
1.187.166,26 |
29,13 |
|
|
|
|
|
|
TOTAL ASSETS |
1.621.190,39 |
2.943.964,49 |
4.075.166,00 |
|
|
|
|
|
|
|
|
|
|
|
|
|
|
|
|
|
|
|
2005 (12) |
2006 (12) |
2007 (12) |
% SALES |
|
|
|
|
|
|
PROFIT AND LOSS
ACCOUNT ANALYSIS |
|
|
|
|
|
|
|
|
|
|
SALES |
1.044.738,28 |
2.506.676,20 |
7.109.291,55 |
|
|
|
|
|
|
|
ADDED VALUE |
376.212,43 |
492.652,09 |
1.738.786,62 |
24,46 |
|
|
|
|
|
|
EBITDA |
-77.481,78 |
-137.827,34 |
761.477,50 |
10,71 |
|
|
|
|
|
|
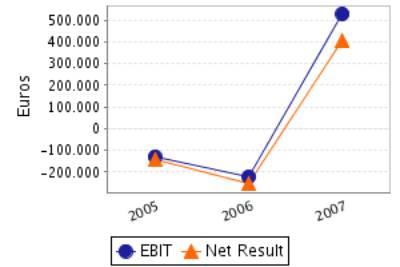
EBIT |
-129.134,56 |
-221.160,73 |
529.554,05 |
7,45 |
|
|
|
|
|
|
NET RESULT |
-144.455,82 |
-254.070,07 |
407.018,30 |
5,73 |
|
|
|
|
|
Balance Sheets Items
Analysis


Balance Sheet Comments
Total assets of the company grew 81,59% between 2005 and 2006.
This growth has been inferior in the case of the fixed assets that
increased just in 46,28%.
This growth has been financed with an indebtedness increase of
123,18%.Moreover, net worth has been reduced in 74,48%, which explains a part
of the indebtedness increase. .
Total assets of the company grew 38,42% between 2006 and 2007.
This growth is a consequence of the fixed assets increase of 61,22%.
This growth has been financed, on a wider scale, with a Shareholders’
equity increase of 467,65% and in a smaller proportion with an debt increase of
25,35%.
Profit and Loss Account Analysis

Profit and Loss Account Comments
The company’s sales figure grew 139,93% between 2005 and 2006.
The company’s EBIT decreased in 71,26% between 2005 and 2006.
This evolution implies a reduction in the company’s operating
profitability.
The result of these variations is an increase of the company’s Economic
Profitability of 5,69% in the analysed period, being this profitability of
-7,51% in the year 2006.
The company’s Net Result decreased in 75,88% between 2005 and 2006.
This evolution, compared to the EBIT’s performance, implies that the
financial and extraordinary activities have had a negative effect in the company’s
Financial Profitability.
The result of these variations is a reduction of the company’s
profitability of 589,31% in the analysed period, being equal to -291,92% in the
year 2006.
The company’s sales figure grew 183,61% between 2006 and 2007.
The company’s EBIT grew 339,44% between 2006 and 2007.
This evolution implies an increase in the company’s operating
profitability.
The result of these variations is an increase of the company’s Economic
Profitability of 272,98% in the analysed period, being this profitability of
12,99% in the year 2007.
The company’s Net Result grew 260,20% between 2006 and 2007.
This evolution, compared to the EBIT’s performance, implies that the
financial and extraordinary activities have had a negative effect in the
company’s Financial Profitability.
The result of these variations is an increase of the company’s Economic
Profitability of 128,22% in the analysed period, being equal to 82,38% in the
year 2007.
ANNUAL FINANCIAL
REPORT ADDITIONAL DATA
Source: annual financial report 2004
Results Distribution
Figures given in €
|
DISTRIBUTION
BASE |
DISTRIBUTION TO |
||
|
Profit and Loss |
-114.439,54 |
Retained earnings |
0,00 |
|
Carry Over |
0,00 |
Voluntary Reserve |
0,00 |
|
Voluntary reserves |
0,00 |
Prior years losses |
-114.439,54 |
|
Reserves |
0,00 |
Carry Over |
0,00 |
|
Other concepts |
0,00 |
Other funds |
0,00 |
|
Total of Amounts to be distributed |
-114.439,54 |
Dividends |
0,00 |
|
|
|
Other Applications |
0,00 |
COMPARATIVE SECTOR
ANALYSIS
Values table
Figures expressed in %
|
|
COMPANY (2007) |
SECTOR |
DIFFERENCE |
DIFFERENCE RELATIVE |
|
|
|
|
|
|
BALANCE SHEET
ANALYSIS: % on the total assets |
|
|
|
|
|
|
|
|
|
|
OWN FUNDS |
12,12 |
42,16 |
-30,04 |
-71,24 |
|
|
|
|
|
|
DEBT |
87,88 |
57,84 |
30,04 |
51,93 |
|
|
|
|
|
|
FIXED ASSETS |
29,13 |
29,21 |
-0,08 |
-0,28 |
|
|
|
|
|
|
|
COMPANY (2007) |
SECTOR |
DIFFERENCE |
DIFFERENCE RELATIVE |
|
|
|
|
|
|
PROFIT AND LOSS
ACCOUNT ANALYSIS: % on the total operating income |
|
|
|
|
|
|
|
|
|
|
SALES |
90,92 |
98,13 |
-7,21 |
-7,35 |
|
|
|
|
|
|
ADDED VALUE |
22,24 |
29,56 |
-7,32 |
-24,77 |
|
|
|
|
|
|
EBIT |
6,77 |
6,40 |
0,38 |
5,87 |
|
|
|
|
|
|
NET RESULT |
5,21 |
4,42 |
0,79 |
17,91 |
|
|
|
|
|
Sector Composition
Compared sector (NACE): 295
Number of companies: 139
Size (Sales Figure) : 7.000.000,00 -
40.000.000,00 Euros
Comments on the sectorial comparative
Compared to its sector the assets of the companies show an inferior
proportion of fixed assets. Specifically the difference with the sector average
is -0,08% , which means a relative difference of -0,28% .
In liabilities composition the company appeals on a wider scale to self
financing, being the proportion of net worth of 30,04% inferior, which means a
relative difference of 71,24% 30,04% more than the sector, which means a
difference of 51,93% .
The proportion that the sales mean to the company’s total ordinary
income is 90,92%, 7,21% lower than in the sector, which means a relative
difference of 7,35% .
The company’s EBIT was positive and was 6,77% with regard to the total
ordinary income, 0,38% higher than in the sector, which means a relative difference
of 5,87% .
The company’s capacity to generate operating income is higher than the
one of the sector as its ratio EBIT/Sales is higher (ES Company versus ES
Sector).
The company’s net result was positive and equal to 5,21% with regard to
the total ordinary income, 0,79% higher than in the sector, which means a
relative difference of 17,91% .
The financial and extraordinary results and the tax impact have had a
less negative impact on the Net result in the company than in the sector; as a
consequence, the company shows a better Net Result/EBIT ratio (REBEmpresa vs.
REBSector).
ADDRESSES
Current Legal Seat Address:
STREET BELLVEI, 41 (49 NAV 9 PG IND CAN SALVATELLA)
08210
BARBERA DEL VALLES BARCELONA
Characteristics of the current address
Type of premises: store
Property: rented
Local Situation: secondary
CORPORATE STRUCTURE
ADMINISTRATIVE LINKS
Main Board members, Directors and Auditor ![]()
|
POSITION |
SURNAMES AND
NAME |
APPOINTMENT DATE |
|
PRESIDENT |
ENBOLF SA |
15/07/2004 |
|
MANAGING DIRECTOR |
COMERCIO E IMPORTACION DE MAQUINAS AUTOMATICAS SA |
15/07/2004 |
|
CHIEF OFFICER |
VILLEGAS BAUTISTA LUIS GABRIEL |
15/07/2004 |
|
SECRETARY |
BONIQUET PENA CARLOS |
15/07/2004 |
Functional Managers
|
POSITION |
SURNAMES AND
NAME |
|
General Manager |
HERVAS JOSE |
FINANCIAL LINKS
|
|
BUSINESS NAME |
CIF / COUNTRY |
% |
SOURCE |
DATA INF. |
|
|
COMERCIO E IMPORTACION DE MAQUINAS AUTOMATICAS S.A. |
A61034161 |
Indet. |
OWN SOURCES |
17/01/2008 |
|
|
ENBOLF SA. |
A63506141 |
Indet. |
OWN SOURCES |
10/11/2008 |
CREDIT INFORMATION
Constitution Date: 07/05/2004
Business activity 
Activity: Mfg. of machinery for food beverages & tabacco
proccessing
NACE Code: 2953
NACE Activity: Manufacture of
machinery for food, beverage and tobacco processing
Business: EL DISENO, FABRICACION Y COMERCIALIZACION DE
MAQUINARIA INDUSTRIAL
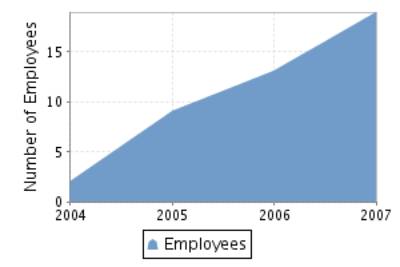
Employees 
Number of total employees: 30 (2008)
Number of fixed employees: 68,42%
Number of temporary employees: 31,58%
Employees evolution
COMMERCIAL OPERATIONS 
PURCHASES
Payments (estimated):
Imports from: CEE IRAN SENEGAL EEUU
SUPPLIERS
|
BUSINESS NAME |
INTERNATIONAL |
|
CELOAGA |
NO |
|
TALLERES MANCHA |
NO |
|
CARPAU |
NO |
3 proveedores
SALES
Collection (estimated):
Exports to: CEE
Banks 
|
ENTITY |
BRANCH |
ADDRESS |
TOWN OR CITY |
PROVINCE |
|
BANCO DE SABADELL, S.A. |
|
|
BARCELONA |
|
1 bank entities registered
Brands, Signs and Commercial
Names 
Brand name: EFFYTEC PACKAGING (Valid)
Type: JOINT Date: 13/07/2004
LEGAL STRUCTURE
Constitution Data
Register Date: 07/05/2004
Register town: Barcelona
Announcement number: 319118
Register Data:
Volume 36665, Book 0, Folio 123, Section 8, Sheet 295143
Legal form: JOINT STOCK
COMPANY
Current Legal Form: JOINT STOCK
COMPANY
Current Capital: 600.000,00 €
Legal Aspects
Obligation to fill in Financial
Statements: YES
Chamber census: YES (2006)
Listed on a Stock Exchange: NO
B.O.R.M.E.(Official Companies
Registry Gazette) 
Registered Proceedings
|
PROCEEDINGS |
DATE |
NOTICE NUM. |
TRADE REG. |
|
Appointments |
25/04/2008 |
215644 |
Barcelona |
|
Establishment |
15/07/2004 |
319118 |
Barcelona |
Other Proceedings published
|
PROCEEDINGS |
DATE |
NOTICE NUM. |
TRADE REG. |
|
Registration of accounts (2006) Individual |
02/11/2007 |
934426 |
Barcelona |
|
Registration of accounts (2005) Individual |
08/01/2007 |
39378 |
Barcelona |
|
Registration of accounts (2004) Individual |
28/03/2006 |
90002 |
Barcelona |
FINANCIAL INFORMATION
The information on the last account contained in this report is
extracted from the Mercantile Register file of the legal address of the Company
and dated 16/10/2008.
BALANCE SHEET
Assets
Figures given in €
|
|
31/12/2005 (12) |
31/12/2006 (12) |
31/12/2007 (12) |
|
A) DUE FROM SHAREHOLDERS FOR UNCALLED CAPITAL |
|
|
|
|
B) FIXED ASSETS |
503.379,69 |
736.354,44 |
1.187.166,26 |
|
I. Incorporation costs |
58.026,78 |
41.847,90 |
4.721,67 |
|
II. Intangible fixed assets |
379.719,16 |
638.640,80 |
1.101.380,86 |
|
III. Tangible fixed assets |
61.546,38 |
51.778,37 |
76.323,29 |
|
IV. Financial fixed assets |
4.087,37 |
4.087,37 |
4.740,44 |
|
V.Owners equity |
|
|
|
|
VI.Long term trade liabilities |
|
|
|
|
C) DEFERRED EXPENSES |
80.883,06 |
80.883,06 |
|
|
D) CURRENT ASSETS |
1.036.927,64 |
2.126.726,99 |
2.887.999,74 |
|
I. Shareholders by required outlays |
|
|
|
|
II. Stocks |
896.286,95 |
1.115.579,36 |
1.222.457,41 |
|
III. Debtors |
140.640,69 |
683.579,27 |
1.105.662,68 |
|
IV. Temporary financial investment |
|
|
|
|
V. Short-term own shares |
|
|
|
|
VI. Treasury |
|
327.568,36 |
559.879,65 |
|
VII. Periodification adjustments |
|
|
|
|
ASSETS (A + B + C + D) |
1.621.190,39 |
2.943.964,49 |
4.075.166,00 |
Assets composition


Liabilities
Figures given in €
|
|
31/12/2005 (12) |
31/12/2006 (12) |
31/12/2007 (12) |
|
A) SHAREHOLDERS EQUITY |
341.104,64 |
87.034,57 |
494.052,87 |
|
I. Share capital |
600.000,00 |
600.000,00 |
600.000,00 |
|
II. Issue bonus |
|
|
|
|
III.Revaluation reserve |
|
|
|
|
IV.Reserves |
|
|
|
|
Capital adjustments in Euros |
|
|
|
|
Sundry reserves |
|
|
|
|
V.Results from previous years |
-114.439,54 |
-258.895,36 |
-512.965,43 |
|
VI.Profit and Losses |
-144.455,82 |
-254.070,07 |
407.018,30 |
|
VII.Dividend paid during the year |
|
|
|
|
VIII.Own shares for capital reduction |
|
|
|
|
B) DEFERRED INCOME |
|
|
|
|
C) PROVISIONS FOR LIABILITIES AND EXPENSES |
|
|
|
|
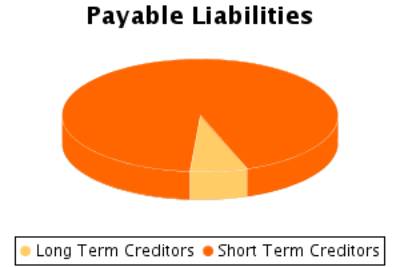
D) LONG TERM LIABILITIES |
188.977,87 |
338.925,67 |
241.768,08 |
|
E) SHORT TERM LIABILITIES |
1.091.107,88 |
2.518.004,25 |
3.339.345,05 |
|
F) SHORT TERM PROVISIONS FOR LIABILITIES AND
EXPENSES |
|
|
|
|
LIABILITIES (A + B + C + D + E + F) |
1.621.190,39 |
2.943.964,49 |
4.075.166,00 |
Liabilities
Composition


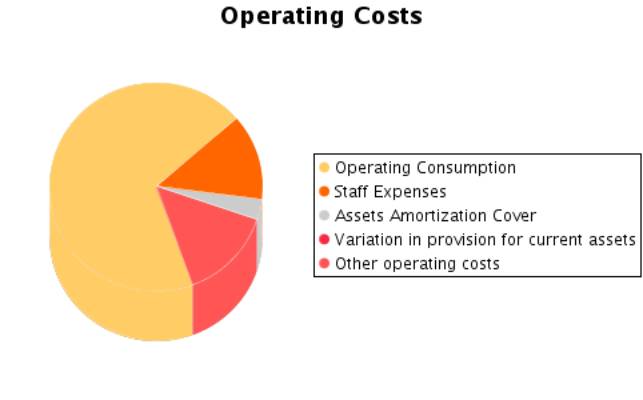
PROFIT AND LOSS ACCOUNT
Itams of the Profit and Loss Account
Figures given in €
|
|
31/12/2005 (12) |
31/12/2006 (12) |
31/12/2007 (12) |
|
A) EXPENSES (A.1 a A.15) |
1.645.713,94 |
2.995.994,65 |
7.419.863,58 |
|
A.1.Operating costs |
792.982,38 |
1.674.105,06 |
5.041.369,58 |
|
A.2. Labour cost |
453.694,21 |
630.479,43 |
977.309,12 |
|
Wages |
369.017,13 |
519.706,20 |
802.881,19 |
|
Social security expenses |
84.677,08 |
110.773,23 |
174.427,93 |
|
A.3. Assets depreciation |
51.652,78 |
83.333,39 |
231.923,45 |
|
A.4. Variation in provision for current assets |
|
|
|
|
A.5. Other operating costs |
331.691,28 |
560.531,78 |
1.038.816,85 |
|
A.I. OPERATING RESULT (B.1-A.1-A.2-A.3-A.4-A.5) |
|
|
529.554,05 |
|
A.6.Financial expenses and similar |
15.621,13 |
47.199,25 |
31.464,09 |
|
Debts with related companies |
|
|
5.019,79 |
|
Debts with associated companies |
|
|
|
|
Other companies debts By debts with third parties and similar expenses |
15.621,13 |
47.199,25 |
26.444,30 |
|
Losses from financial investments |
|
|
|
|
A.7. Variation
in financial investment provision |
|
|
|
|
A.8.Negative
exchange difference |
71,76 |
0,97 |
10.615,51 |
|
A.II.POSITIVE
FINANCIAL RESULTS (B.2+B.3-A.6-A.7-A.8) |
|
|
|
|
A.III.PROFIT
FROM ORDINARY ACTIVITIES (A.I+A.II-B.I-B.II) |
|
|
493.249,85 |
|
A.9. Variation
in provision in fixed assets |
|
|
|
|
A.10. Losses in
fixed assets |
|
|
|
|
A.11. Losses
from own shares and bonds |
|
|
|
|
A.12.
Extraordinary charges |
0,40 |
344,77 |
7.481,92 |
|
A.13.Other
exercises’ expenses and losses |
|
|
80.883,06 |
|
A.IV.POSITIVE
EXTRAORDINARY RESULT (B.4+B.5+B.6+B.7+B.8-A.9-A.10-A.11-A.12-A.13) |
111,08 |
14.284,13 |
|
|
A.V.PROFIT
BEFORE TAXES (A.III+A.IV-B.III-B.IV) |
|
|
407.018,30 |
|
A.14.Corporate
Taxes |
|
|
|
|
A.15. Other
taxes |
|
|
|
|
A.VI.EXERCISE
RESULT (PROFIT) (A.V-A.14-A.15) |
|
|
407.018,30 |
|
B) INCOMES (B.1
a B.8) |
1.501.258,12 |
2.741.924,58 |
7.826.881,88 |
|
B.1.Operating
income |
1.500.886,09 |
2.727.288,93 |
7.818.973,05 |
|
Turnover |
1.044.738,28 |
2.506.676,20 |
7.109.291,55 |
|
Other operating
income |
456.147,81 |
220.612,73 |
709.681,50 |
|
B.I.OPERATING
LOSSES (A.1+A.2+A.3+A.4+A.5-B.1) |
129.134,56 |
221.160,73 |
|
|
B.2.Financial
Income |
260,55 |
2,23 |
5.512,43 |
|
From affiliated
companies |
|
|
|
|
From associated
companies |
|
|
|
|
Other |
260,55 |
2,23 |
5.512,43 |
|
Gains from
investments |
|
|
|
|
B.3. Positive
change difference |
|
4,52 |
262,97 |
|
B.II. NEGATIVE FINANCIAL
RESULTS (A.6+A.7+A.8-B.2-B.3) |
15.432,34 |
47.193,47 |
36.304,20 |
|
B.III.LOSSES
FROM ORDINARY ACTIVITIES (B.I+B.II-A.I-A.II) |
144.566,90 |
268.354,20 |
|
|
B.4.B.9. Gains
from disposal of fixed assets |
|
|
|
|
B.5.Gains from dealing
in own shares |
|
|
|
|
B.6. Paid in
surplus |
|
|
|
|
B.7.
Extraordinary income |
111,48 |
14.628,90 |
2.133,43 |
|
B.8.Other year’s
income and profits |
|
|
|
|
B.IV.NEGATIVE
EXTRAORDINARY LOSSES (A.9+A.10+A.11+A.12+A.13-B.4-B.5-B.6-B.7-B.8) |
|
|
86.231,55 |
|
B.V.LOSS BEFORE
TAXES (B.III+B.IV-A.III-A.IV) |
144.455,82 |
254.070,07 |
|
|
B.VI.EXERCISE
RESULTS (LOSS) (B.V+A.14+A.15) |
144.455,82 |
254.070,07 |
|
Composition of the Profit
and Loss Account


FINANCIAL BALANCE
Here the Main Capital Amounts of the company and the Revolving Fund
Evolution are analysed.
Financial Balance Table
Figures given in €
|
|
31/12/2005 (12) |
% |
31/12/2006 (12) |
% |
31/12/2007 (12) |
% |
|
A) DUE FROM
SHAREHOLDERS FOR UNCALLED CAPITAL |
|
|
|
|
|
|
|
B) FIXED ASSETS |
503.379,69 |
31,05 |
736.354,44 |
25,01 |
1.187.166,26 |
29,13 |
|
C) DEFERRED
EXPENSES |
80.883,06 |
4,99 |
80.883,06 |
2,75 |
|
|
|
D) CURRENT
ASSETS |
1.036.927,64 |
63,96 |
2.126.726,99 |
72,24 |
2.887.999,74 |
70,87 |
|
ASSETS (A + B +
C + D) |
1.621.190,39 |
|
2.943.964,49 |
|
4.075.166,00 |
|
|
|
||||||
|
A) SHAREHOLDERS
EQUITY |
341.104,64 |
21,04 |
87.034,57 |
2,96 |
494.052,87 |
12,12 |
|
B) DEFERRED
INCOME |
|
|
|
|
|
|
|
C) PROVISIONS
FOR LIABILITIES AND EXPENSES |
|
|
|
|
|
|
|
D) LONG TERM
LIABILITIES |
188.977,87 |
11,66 |
338.925,67 |
11,51 |
241.768,08 |
5,93 |
|
E) SHORT TERM
LIABILITIES |
1.091.107,88 |
67,30 |
2.518.004,25 |
85,53 |
3.339.345,05 |
81,94 |
|
F) SHORT TERM
PROVISIONS FOR LIABILITIES AND EXPENSES |
|
|
|
|
|
|
|
LIABILITIES (A +
B + C + D + E + F) |
1.621.190,39 |
|
2.943.964,49 |
|
4.075.166,00 |
|
Financial Balance
Composition
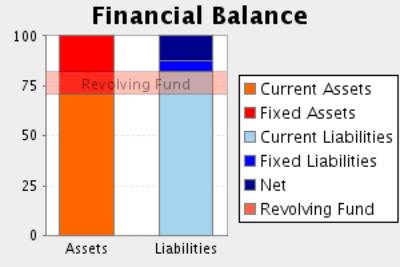

Comments on Financial Balance
In the 2005, the assets of the company were formed in 36,04% of Fixed
Assets and in 63,96% of Current Assets.This assets were financed in 21,04% with
own capitals, and in 11,66% with long term debt and in 67,30% with current
liabilities.
The result of this financial structure is a negative turnover fund of
-54.180,24 Euros, which is equivalent to -3,34% proportion of the company’s
total assets.
In the 2006, the assets of the company were formed in 27,76% of Fixed
Assets and in 72,24% of Current Assets.This assets were financed in 2,96% with
own capitals, and in 11,51% with long term debt and in 85,53% with current
liabilities.
The result of this financial structure is a negative turnover fund of
-391.277,26 Euros, which is equivalent to -13,29% proportion of the company’s
total assets.
This measure has diminished with respect to the previous exercise in
622,18% having also diminished its proportion with respect to the total assets
of the company.
In the 2007, the assets of the company were formed in 29,13% of Fixed
Assets and in 70,87% of Current Assets.This assets were financed in 12,12% with
own capitals, and in 5,93% with long term debt and in 81,94% with current
liabilities.
The result of this financial structure is a negative turnover fund of
-451.345,31 Euros, which is equivalent to -11,08% proportion of the company’s
total assets.
This measure has diminished with respect to the previous exercise in
15,35% having, however, increased its proportion with respect to the total
assets of the company.
RATIOS
Main Ratios
|
|
31/12/2005 (12) |
31/12/2006 (12) |
31/12/2007 (12) |
|
STRUCTURAL RATIOS |
|
|
|
|
Management fund |
-54.180,24 |
-391.277,26 |
-451.345,31 |
|
Indebtedness (%) |
78,96 |
97,04 |
87,88 |
|
External Funds on Net Worth |
3,75 |
32,82 |
7,25 |
|
GENERAL ACTIVITY RATIO |
|
|
|
|
Turnover Increase (%) |
|
139,93 |
183,61 |
|
Added value growth (%) |
|
30,95 |
252,94 |
|
Cash Flow |
-92.803,04 |
-170.736,68 |
638.941,75 |
|
Labour Productivity |
0,83 |
0,78 |
1,78 |
|
Assets turnover |
0,64 |
0,85 |
1,74 |
|
Breakdown Point |
1.774.675,11 |
3.299.999,19 |
6.328.274,72 |
|
Security Margin of the Breakdown Point (%) |
-18,24 |
-21,00 |
19,06 |
|
ACTIVITY RATIOS |
|
|
|
|
Average Collection Period |
48 |
98 |
56 |
|
Inventory Turnover Period |
309 |
160 |
62 |
|
SOLVENCY RATIOS |
|
|
|
|
Payback Capacity |
-0,07 |
-0,06 |
0,18 |
|
Assets Guarantee |
1,16 |
0,99 |
1,14 |
|
Short Term Debts Proportion (%) |
85,24 |
88,14 |
93,25 |
|
Interest Coverage |
-5,96 |
-3,93 |
20,06 |
|
LIQUIDITY RATIOS |
|
|
|
|
Current Ratio |
0,95 |
0,84 |
0,86 |
|
Immediate liquidity |
|
0,13 |
0,17 |
|
Sales on Current Assets |
363 |
424 |
886 |
Results Analysis
Ratios
|
|
31/12/2005 (12) |
31/12/2006 (12) |
31/12/2007 (12) |
|
Economic profitability (%) |
-7,96 |
-7,51 |
13,00 |
|
Operating Profitability (%) |
-12,36 |
-8,82 |
7,45 |
|
Equity gearing |
5,32 |
41,04 |
7,68 |
|
Financial profitability (%) |
-42,35 |
-291,92 |
82,38 |
|
General Profitability (%) |
-13,83 |
-10,14 |
5,72 |
Comments on the
Results Analysis Ratios
The economic profitability in the year2006The economic profitability in
the year -7,51%, derived from a negative operating profitability of -8,82%.The
assets turnover was 0,85%.
The economic profitability in the year has improved from -7,96% up to
the current value, in spite of remaining in negative. This improvement has been
mainly due to the variation in operating profitability, from -12,36% to the
current level of -8,82% having also increased assets turnover to0,64 and 0,85%.
Financial profitability on 2006The economic profitability in the year
-291,92
The company’s financial structure has restrained its financial
profitability with an indebtedness level of 41,04.
The general profitability on 2006The economic profitability in the year
-10,14
The economic profitability in the year2007 achieved a 13,00% positive
level, due to a 7,45% economic margin and to an assets turnover of1,74%.
The economic profitability in the year has passed from a negative level
of -7,51% to its positive current value. This evolution is due to the obtaining
of positive operating profitability of 7,45% in comparison with the previous
negative level of -8,82%. Assets turnover has maintained stable in this period,
with an index of 1,74%.
Financial profitability on 2007 achieved a 82,38%.
The company’s financial structure has instigated its economic
profitability with an indebtedness level of 7,68.
The general profitability on 2007 achieved a 5,72%.
SECTORIAL ANÁLYSIS
Large Capital Amounts and Financial Balance
Figures given in %
|
|
COMPANY (2007) |
SECTOR |
DIFFERENCE |
DIFFERENCE RELATIVE |
|
|
|
|
|
|
ASSETS |
|
|
|
|
|
|
|
|
|
|
A) DUE FROM
SHAREHOLDERS FOR UNCALLED CAPITAL |
|
0,11 |
|
|
|
|
|
|
|
|
B) FIXED ASSETS |
29,13 |
29,21 |
-0,08 |
-0,29 |
|
|
|
|
|
|
C) DEFERRED
EXPENSES |
|
0,52 |
|
|
|
|
|
|
|
|
D) CURRENT ASSETS |
70,87 |
70,16 |
0,71 |
1,01 |
|
|
|
|
|
|
ASSETS (A + B + C + D) |
100 |
100 |
|
|
|
|
|
|
|
|
|
|
|
|
|
|
|
|
|
|
|
|
COMPANY (2007) |
SECTOR |
DIFFERENCE |
DIFFERENCE RELATIVE |
|
|
|
|
|
|
LIABILITIES |
|
|
|
|
|
|
|
|
|
|
A) SHAREHOLDERS
EQUITY |
12,12 |
41,68 |
-29,56 |
-70,92 |
|
|
|
|
|
|
B) DEFERRED
INCOME |
|
0,48 |
|
|
|
|
|
|
|
|
C) PROVISIONS
FOR LIABILITIES AND EXPENSES |
|
0,52 |
|
|
|
|
|
|
|
|
D) LONG TERM
LIABILITIES |
5,93 |
10,67 |
-4,74 |
-44,44 |
|
|
|
|
|
|
E) SHORT TERM
LIABILITIES |
81,94 |
46,65 |
35,29 |
75,66 |
|
|
|
|
|
|
F) SHORT TERM
PROVISIONS FOR LIABILITIES AND EXPENSES |
|
0,00 |
|
|
|
|
|
|
|
|
LIABILITIES (A +
B + C + D + E + F) |
100 |
100 |
|
|
|
|
|
|
|
Sectorial Financial
Balance Comparison
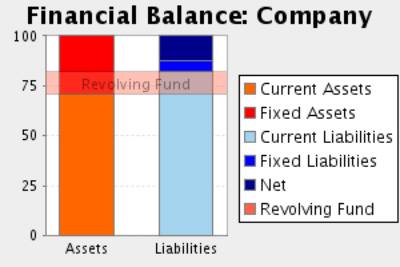

Comments to the Sectorial Analysis
In the 2007, the assets of the company were formed in 29,13% of fixed
assets and in 70,87Current Assets % In the sector, the proportion of fixed
assets was of 29,84%, 2,38% superior, and the proportion of current assets was
of 70,16%, 1,01% inferior.
The assets were financed in the company in 12,12% with own capitals , in
5,93% with fixed liabilities and in 81,94% with current liabilities In the
sector, the self financing represented 42,16%, 71,25% superior. On the other
hand the long term debts represented in the sector an average of 11,19%
financing, with a relative difference of 47,03% favourable to the sectorAnd,
short term liabilities represented in the sector an average of 46,65%
financing, with a relative difference of 75,66% in favour of the company
The result of this company’s financial structure is a turnover fund that
represents -11,08% of the total assets; in the sector, this same proportion is
23,51%, therefore, we can say that the company’s turnover fund is 147,12%
smaller than the sector one.
Analytical Account of Results
Figures given in %
|
|
COMPANY (2007) |
SECTOR |
DIFFERENCE |
DIFFERENCE RELATIVE |
|
Turnover |
90,92 |
98,13 |
-7,21 |
-7,35 |
|
Other operating income |
9,08 |
1,87 |
7,21 |
386,08 |
|
Production Value |
100,00 |
100,00 |
0,00 |
0,00 |
|
Operating expenses |
64,48 |
56,74 |
7,74 |
13,64 |
|
Other operation expenses |
13,29 |
13,70 |
-0,41 |
-3,00 |
|
Added value |
22,24 |
29,56 |
-7,32 |
-24,76 |
|
Labour cost |
12,50 |
19,27 |
-6,77 |
-35,14 |
|
Gross Economic Result |
9,74 |
10,29 |
-0,55 |
-5,32 |
|
Assets depreciation |
2,97 |
3,38 |
-0,41 |
-12,18 |
|
Variation in provision for current assets and bad debt losses |
|
0,51 |
|
|
|
Net Economic Result |
6,77 |
6,40 |
0,37 |
5,83 |
|
Financial income |
0,07 |
0,74 |
-0,67 |
-90,50 |
|
Financial Charges |
0,54 |
1,10 |
-0,56 |
-50,91 |
|
Variation in financial investment provision |
|
0,02 |
|
|
|
Ordinary
Activities Result |
6,31 |
6,01 |
0,30 |
4,94 |
|
Extraordinary income |
0,03 |
0,63 |
-0,60 |
-95,23 |
|
Extraordinary charges |
1,13 |
0,49 |
0,64 |
132,51 |
|
Variation in provision in fixed assets |
|
0,08 |
|
|
|
Results before Taxes |
5,21 |
6,08 |
-0,87 |
-14,24 |
|
Corporate taxes |
|
1,66 |
|
|
|
Net Result |
5,21 |
4,42 |
0,79 |
18,01 |
|
Assets depreciation |
2,97 |
3,38 |
-0,41 |
-12,18 |
|
Change of Provisions |
|
0,61 |
|
|
|
Net Self-Financing |
8,17 |
8,41 |
-0,24 |
-2,82 |
Main Ratios
|
|
COMPANY (2007) |
PTILE25 |
PTILE50 |
PTILE75 |
|
STRUCTURAL RATIOS |
|
|
|
|
|
Management fund |
-451.345,31 |
847,09 |
2.201,10 |
4.861,69 |
|
Indebtedness (%) |
87,88 |
46,55 |
60,24 |
73,43 |
|
External Funds on Net Worth |
7,25 |
0,87 |
1,52 |
2,76 |
|
GENERAL ACTIVITY
RATIO |
|
|
|
|
|
Turnover
Increase (%) |
183,61 |
-4,69 |
7,48 |
21,22 |
|
Added value
growth (%) |
252,94 |
-5,78 |
4,96 |
22,37 |
|
Cash Flow |
638.941,75 |
433,44 |
812,44 |
1.381,49 |
|
Labour
Productivity |
1,78 |
1,24 |
1,47 |
1,82 |
|
Assets turnover |
1,74 |
0,85 |
1,10 |
1,42 |
|
Breakdown Point |
6.328.274,72 |
7.640.615,87 |
9.810.569,03 |
14.351.109,24 |
|
Security Margin
of the Breakdown Point (%) |
19,06 |
5,47 |
14,15 |
24,53 |
|
ACTIVITY RATIOS |
|
|
|
|
|
Average Collection Period |
56 |
95 |
131 |
163 |
|
Inventory Turnover Period |
62 |
39 |
61 |
88 |
|
SOLVENCY RATIOS |
|
|
|
|
|
Payback Capacity |
0,18 |
0,07 |
0,14 |
0,24 |
|
Assets Guarantee |
1,14 |
1,35 |
1,63 |
2,15 |
|
Short Term Debts Proportion (%) |
93,25 |
79,22 |
90,71 |
98,71 |
|
Interest Coverage |
20,06 |
2,22 |
8,78 |
27,26 |
|
LIQUIDITY RATIOS |
|
|
|
|
|
Current Ratio |
0,86 |
1,16 |
1,45 |
1,94 |
|
Immediate liquidity |
0,17 |
0,05 |
0,19 |
0,50 |
|
Sales on Current Assets |
886 |
424 |
537 |
692 |
Results Analysis
Ratios
|
|
COMPANY (2007) |
PTILE25 |
PTILE50 |
PTILE75 |
|
Economic profitability (%) |
13,00 |
2,58 |
5,15 |
10,16 |
|
Operating Profitability (%) |
7,45 |
2,02 |
4,73 |
10,19 |
|
Equity gearing |
7,68 |
1,60 |
2,20 |
3,44 |
|
Financial profitability (%) |
82,38 |
3,59 |
10,51 |
19,22 |
|
General Profitability (%) |
5,72 |
1,23 |
3,60 |
7,34 |
NOTES
The name EFFYTEC PACKAGING, included
in your enquiry, belong to the Trade Name.
FOREIGN EXCHANGE
RATES
|
Currency |
Unit
|
Indian Rupees |
|
US Dollar |
1 |
Rs.48.79 |
|
UK Pound |
1 |
Rs.75.41 |
|
Euro |
1 |
Rs.61.48 |
RATING
EXPLANATIONS
|
RATING |
STATUS |
PROPOSED CREDIT LINE |
|
|
>86 |
Aaa |
Possesses an extremely sound financial base with the strongest
capability for timely payment of interest and principal sums |
Unlimited |
|
71-85 |
Aa |
Possesses adequate working capital. No caution needed for credit
transaction. It has above average (strong) capability for payment of interest
and principal sums |
Large |
|
56-70 |
A |
Financial & operational base are regarded healthy. General unfavourable
factors will not cause fatal effect. Satisfactory capability for payment of
interest and principal sums |
Fairly Large |
|
41-55 |
Ba |
Overall operation is considered normal. Capable to meet normal
commitments. |
Satisfactory |
|
26-40 |
B |
Unfavourable & favourable factors carry similar weight in credit
consideration. Capability to overcome financial difficulties seems
comparatively below average. |
Small |
|
11-25 |
Ca |
Adverse factors are apparent. Repayment of interest and principal sums
in default or expected to be in default upon maturity |
Limited with
full security |
|
<10 |
C |
Absolute credit risk exists. Caution needed to be exercised |
Credit not
recommended |
|
NR |
In view of the lack of information, we have no basis upon which to
recommend credit dealings |
No Rating |
|
This score serves as a reference to assess SC’s credit risk
and to set the amount of credit to be extended. It is calculated from a composite
of weighted scores obtained from each of the major sections of this report. The
assessed factors and their relative weights (as indicated through %) are as
follows:
Financial
condition (40%) Ownership
background (20%) Payment
record (10%)
Credit history
(10%) Market trend
(10%) Operational
size (10%)