![]()
MIRA INFORM REPORT
|
Report Date : |
14.11.2008 |
IDENTIFICATION
DETAILS
|
Name : |
INSTRUMENTACION NIVELTEC S.L. |
|
|
|
|
Registered Office : |
|
|
|
|
|
Country : |
Spain |
|
|
|
|
Financials (as on) : |
31.12.2005 |
|
|
|
|
Date of Incorporation : |
31.05.1994 |
|
|
|
|
Legal Form : |
Limited Liability Company |
|
|
|
|
Line of Business : |
RATING &
COMMENTS
|
MIRA’s Rating : |
Ba |
|
RATING |
STATUS |
PROPOSED CREDIT LINE |
|
|
41-55 |
Ba |
Overall operation is considered normal. Capable to meet normal
commitments. |
Satisfactory |
|
Maximum Credit Limit : |
€ 6,000,000 |
|
|
|
|
Status : |
Satisfactory |
|
|
|
|
Payment Behaviour : |
Usually Correct |
|
|
|
|
Litigation : |
Clear |
Name
INSTRUMENTACION NIVELTEC S.L.
TAX NUMBER: B80914252
EXECUTIVE SUMMARY
Identification
Current Business Name: INSTRUMENTACION NIVELTEC S.L.
Other names: NO
Current Address: STREET CEMENTO, 5, CP 28850, TORREJON
DE ARDOZ MADRID
Telephone number: 916767612
Fax: 916760321
URL: www.atc-control.com
Corporate e-mail: gerencia@niveltec.es
Commercial Risk
Credit Appraisal: 9.015,18 €
RAI: NO
Legal
Actions: NO
Financial Information
Latest Balance sheet sales (2005): 805.879,09 € (MERCANTILE REGISTER)
Result: 14.402,37 €
Total Assets: 691.571,92 €
Social Capital: 60.101,21 €
Employees: 10
Commercial Information
Constitution Date: 31/05/1994
Business activity: Mfg. of metal structures for
construction
NACE Code: 2810
International Operations: No business relationships registered
Corporate Structure
President:
Other Complementary Information
Latest proceeding published in BORME: 03/11/2008 Registration
of accounts
Latest press article: 15/12/1997 EL
PAIS (INFORMATION ON LEGAL ANNOUNCE)
Bank Entities: Yes
COMMERCIAL RISK
RATING
Credit Appraisal
Maximum Credit
(from 0 a 6,000,000 €)
Favourable to 9.015,18 €
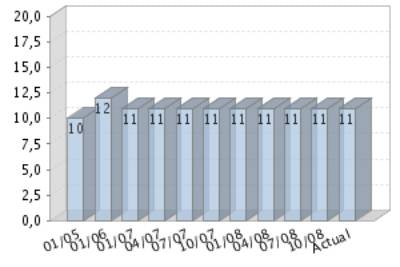
Rating Evolution
Financial Situation
Fiscal year2005
|
Treasury |
Average |
|
Indebtedness |
Important |
|
Profitability |
Average |
|
Balance |
Degraded |
Performance
|
Legal Actions |
None or Negligible |
|
Business
Trajectory |
Excellent |
RAI 
COMPANY NOT REGISTERED IN THE R.A.I.
This company is not registered in the Disputed Bills register (R.A.I.)
INCIDENTS

Summary
LEGAL ACTIONS: No legal incidences registered at D&B, S.A.
CLAIM FILED AGAINST THE ADMINISTRATION: No administrative
claims registered at D&B, S.A.
AFFECTED BY: No significant element.
FINANCIAL ELEMENTS AND SECTORIAL
COMPARATIVE
FINANCIAL ELEMENTS
Figures given in €
|
|
2003 (12) |
2004 (12) |
2005 (12) |
% ASSETS |
|
|
|
|
|
|
BALANCE SHEET ANALYSIS |
|
|
|
|
|
|
|
|
|
|
OWN FUNDS |
97.872,65 |
110.614,81 |
112.275,02 |
16,23 |
|
|
|
|
|
|
DEBT |
447.491,63 |
572.839,54 |
579.296,90 |
83,77 |
|
|
|
|
|
|
FIXED ASSETS |
42.672,43 |
53.889,64 |
134.733,57 |
19,48 |
|
|
|
|
|
|
TOTAL ASSETS |
545.364,28 |
683.454,35 |
691.571,92 |
|
|
|
|
|
|
|
|
|
|
|
|
|
|
|
|
|
|
|
2003 (12) |
2004 (12) |
2005 (12) |
% SALES |
|
|
|
|
|
|
PROFIT AND LOSS ACCOUNT ANALYSIS |
|
|
|
|
|
|
|
|
|
|
SALES |
784.977,22 |
874.537,63 |
805.879,09 |
|
|
|
|
|
|
|
ADDED VALUE |
228.805,83 |
197.860,11 |
190.443,78 |
23,63 |
|
|
|
|
|
|
EBITDA |
52.557,93 |
34.419,36 |
37.325,34 |
4,63 |
|
|
|
|
|
|
EBIT |
42.413,25 |
24.419,36 |
27.475,34 |
3,41 |
|
|
|
|
|
|
NET RESULT |
26.969,63 |
12.742,16 |
14.402,37 |
1,79 |
|
|
|
|
|
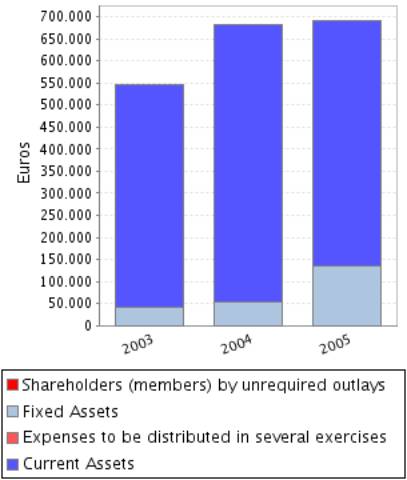
Balance Sheets Items Analysis


Balance Sheet Comments
Total assets of the company grew 25,32% between 2003 and 2004.
This growth is a consequence of the fixed assets increase of 26,29%.
This growth has been mainly financed with a debt increase of 28,01%.
Nevertheless the net worth increased 13,02%.
Total assets of the company grew 1,19% between 2004 and 2005.
This growth is a consequence of the fixed assets increase of 150,02%.
This growth has been financed, on a wider scale, with a Shareholders’
equity increase of 1,50% and in a smaller proportion with an debt increase of
1,13%.
Profit and Loss Account Analysis


Profit and Loss Account Comments
The company’s sales figure grew 11,41% between 2003 and 2004.
The company’s EBIT decreased in 42,43% between 2003 and 2004.
This evolution implies a reduction in the company’s operating
profitability.
The result of these variations is a decrease of the company’s Economic
Profitability of 54,06% in the analysed period, being this profitability of
3,57% in the year 2004.
The company’s Net Result decreased in 52,75% between 2003 and 2004.
This evolution, compared to the EBIT’s performance, implies that the
financial and extraordinary activities have had a negative effect in the
company’s Financial Profitability.
The result of these variations is a reduction of the company’s
profitability of 58,20% in the analysed period, being equal to 11,52% in the
year 2004.
The company’s sales figure decreased in 7,85% between 2004 and 2005.
The company’s EBIT grew 12,51% between 2004 and 2005.
This evolution implies an increase in the company’s operating
profitability.
The result of these variations is an increase of the company’s Economic
Profitability of 11,20% in the analysed period, being this profitability of
3,97% in the year 2005.
The company’s Net Result grew 13,03% between 2004 and 2005.
This evolution, compared to the EBIT’s performance, implies that the
financial and extraordinary activities have had a positive effect in the
company’s Financial Profitability.
The result of these variations is an increase of the company’s Economic
Profitability of 11,36% in the analysed period, being equal to 12,83% in the
year 2005.
ANNUAL FINANCIAL REPORT
ADDITIONAL DATA
Source: annual financial report 2002
Results Distribution
Figures given in €
|
DISTRIBUTION
BASE |
DISTRIBUTION TO |
||
|
Profit and Loss |
13.789,00 |
Retained earnings |
10.802,00 |
|
Carry Over |
0,00 |
Voluntary Reserve |
0,00 |
|
Voluntary reserves |
0,00 |
Prior years losses |
2.987,00 |
|
Reserves |
0,00 |
Carry Over |
0,00 |
|
Other concepts |
0,00 |
Other funds |
0,00 |
|
Total of Amounts to be distributed |
13.789,00 |
Dividends |
0,00 |
|
|
|
Other Applications |
0,00 |
COMPARATIVE SECTOR ANALYSIS
Values table
Figures expressed in %
|
|
COMPANY (2005) |
SECTOR |
DIFFERENCE |
DIFFERENCE RELATIVE |
|
|
|
|
|
|
BALANCE SHEET ANALYSIS: % on the total
assets |
|
|
|
|
|
|
|
|
|
|
OWN FUNDS |
16,23 |
35,56 |
-19,33 |
-54,35 |
|
|
|
|
|
|
DEBT |
83,77 |
64,44 |
19,33 |
29,99 |
|
|
|
|
|
|
FIXED ASSETS |
19,48 |
34,01 |
-14,53 |
-42,72 |
|
|
|
|
|
|
|
|
|
|
|
|
|
|
|
|
|
|
COMPANY (2005) |
SECTOR |
DIFFERENCE |
DIFFERENCE RELATIVE |
|
|
|
|
|
|
PROFIT AND LOSS ACCOUNT ANALYSIS: % on the total
operating income |
|
|
|
|
|
|
|
|
|
|
SALES |
100,00 |
99,50 |
0,50 |
0,50 |
|
|
|
|
|
|
ADDED VALUE |
23,63 |
36,92 |
-13,29 |
-35,99 |
|
|
|
|
|
|
EBIT |
3,41 |
4,64 |
-1,24 |
-26,60 |
|
|
|
|
|
|
NET RESULT |
1,79 |
2,81 |
-1,02 |
-36,38 |
|
|
|
|
|
Sector Composition
Compared sector (NACE): 281
Number of companies: 3740
Size (Sales Figure) : 0 - 2.800.000,00 Euros
Comments on the sectorial
comparative
Compared to its sector the assets of the companies show an inferior
proportion of fixed assets. Specifically the difference with the sector average
is -14,53% , which means a relative difference of -42,72% .
In liabilities composition the company appeals on a wider scale to self
financing, being the proportion of net worth of 19,33% inferior, which means a
relative difference of 54,35% 19,33% more than the sector, which means a
difference of 29,99% .
The proportion that the sales mean to the company’s total ordinary
income is 100,00%, 0,50% higher than in the sector, which means a relative
difference of 0,50% .
The company’s EBIT was positive and was 3,41% with regard to the total
ordinary income, 1,24% less than the sector, which means a relative difference
of 26,60% .
The company’s capacity to generate operating income is equal to that of
the sector as its ratio EBIT/Sales is also equal.
The company’s net result was positive and equal to 1,79% with regard to
the total ordinary income, 1,02% less than the sector, which means a relative
difference of 36,38% .
The financial and extraordinary results and the tax impact have had a
negative impact on the Net result in the company with a worse behaviour than in
the sector; as a consequence, the company shows a worse Net Result/EBIT ratio
(REBEmpresa vs. REBSector).
ADDRESSES
Current Legal Seat Address:
STREET CEMENTO, 5
28850 TORREJON DE ARDOZ MADRID
Previous Seat Address:
STREET SOTO HIDALGO, 2
28042
MADRID
Characteristics of the current
address
Type of premises: office, warehouse
Property: rented
Local Situation: secondary
CORPORATE STRUCTURE
ADMINISTRATIVE LINKS
Main Board members, Directors and Auditor ![]()
|
POSITION |
SURNAMES AND
NAME |
APPOINTMENT DATE |
|
PRESIDENT |
JIMENEZ PEREZ JESUS |
22/05/1997 |
|
MANAGING DIRECTOR |
CATON DELGADO ANA MARIA |
22/05/1997 |
|
MANAGING DIRECTOR |
JIMENEZ CATON JESUS ALBERTO |
22/05/1997 |
|
MANAGING DIRECTOR |
JIMENEZ CATON OSCAR JAVIER |
22/05/1997 |
FINANCIAL LINKS
|
|
BUSINESS NAME |
CIF / COUNTRY |
% |
SOURCE |
DATA INF. |
|
|
JIMENEZ PEREZ JESUS |
|
Indet. |
OWN SOURCES |
13/11/2008 |
|
|
CATON DELGADO ANA MARIA |
|
Indet. |
OWN SOURCES |
13/11/2008 |
|
|
JIMENEZ CATON OSCAR JAVIER |
|
Indet. |
OWN SOURCES |
13/11/2008 |
|
|
JIMENEZ CATON JESUS ALBERTO |
|
Indet. |
OWN SOURCES |
13/11/2008 |
CREDIT INFORMATION
Constitution Date: 31/05/1994
Code: 1314300
Activity: Mfg. of metal structures for construction
NACE Code: 2810
NACE Activity: Manufacture of structural metal products
Business: LA COMPRA, VENTA, IMPORTACION, EXPORTACION,
FABRICACION Y DISTRIBUCION DE APARATOS DE MEDIDA ELECTRONICA.
Employees 
Number of total employees: 10 (2008)
Number of fixed employees: 66,67%
Number of temporary employees: 33,33%
Employees evolution

COMMERCIAL OPERATIONS 
SALES
Collection (estimated):
Regional Distribution: 100%
Banks 
|
ENTITY |
BRANCH |
ADDRESS |
TOWN OR CITY |
PROVINCE |
|
CAJA DE AHORROS Y M.P. DE MADRID |
1097 |
CMNO. VIEJO DE LEGANES, 151 |
MADRID |
Madrid |
|
BANCO BILBAO VIZCAYA ARGENTARIA, S.A. |
|
|
|
|
|
CAIXA D’ESTALVIS DE SABADELL |
|
|
|
|
|
DEUTSCHE BANK, S.A.E. |
|
|
|
|
4 bank entities registered
Brands, Signs and Commercial
Names 
Brand name: NIVELTEC (Valid)
Type: JOINT Date: 06/06/2003
LEGAL STRUCTURE
Constitution Data
Register Date: 31/05/1994
Register town: Madrid
Announcement number: 186773
Legal form: LIMITED LIABILITY COMPANY
Social Capital: 6.010,12 €
Current structure data 
Current Legal Form: LIMITED LIABILITY COMPANY
Current Capital: 60.101,21 €
Legal Aspects
Obligation to fill in Financial Statements: YES
Chamber census: YES (2006)
Listed on a Stock Exchange: NO
B.O.R.M.E.(Official Companies Registry
Gazette) 
Other Proceedings published
|
PROCEEDINGS |
DATE |
NOTICE NUM. |
TRADE REG. |
|
Registration of accounts (2007) Individual |
03/11/2008 |
1038979 |
Madrid |
|
Registration of accounts (2006) Individual |
17/03/2008 |
101269 |
Madrid |
|
Registration of accounts (2005) Individual |
13/11/2006 |
865823 |
Madrid |
|
Registration of accounts (2004) Individual |
24/03/2006 |
87355 |
Madrid |
|
Registration of accounts (2003) Individual |
05/12/2005 |
1008935 |
Madrid |
Press articles

15/12/1997 EL PAIS (INFORMATION ON LEGAL ANNOUNCE)
EN LA JUNTA GENERAL CELEBRADA EL 10/12/97 SE ACORDO TRASLADAR EL
DOMICILIO SOCIAL A LA C/ CEMENTO, 5 DE TORREJON DE ARDOZ (MADRID).
10/04/1997 ABC (INFORMATION ON LEGAL ANNOUNCE)
LA JUNTA GRAL. DE ESTA SDAD., CELEBRADA EL 01/04/97, ACORDO SU CAMBIO DE
DOMICILIO SOCIAL DE LA C/ ZABALETA, 12, DE MADRID A LA C/ SOTO HIDALGO, 2, DEL
MISMO MUNICIPIO.
FINANCIAL INFORMATION
The information on the last account contained in this report is
extracted from the Mercantile Register file of the legal address of the Company
and dated 12/12/2006.
BALANCE SHEET
Assets
Figures given in €
|
|
31/12/2003 (12) |
31/12/2004 (12) |
31/12/2005 (12) |
|
A) DUE FROM SHAREHOLDERS FOR UNCALLED CAPITAL |
|
|
|
|
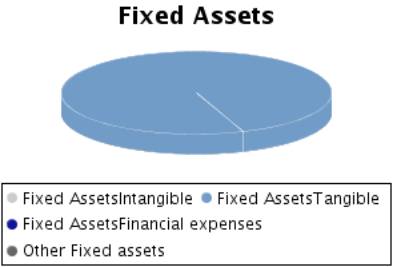
B) FIXED ASSETS |
42.672,43 |
53.889,64 |
134.733,57 |
|
I. Incorporation costs |
|
|
|
|
II. Intangible fixed assets |
|
|
|
|
III. Tangible fixed assets |
42.672,43 |
53.889,64 |
134.733,57 |
|
IV. Financial fixed assets |
|
|
|
|
V.Owners equity |
|
|
|
|
VI.Long term trade liabilities |
|
|
|
|
C) DEFERRED EXPENSES |
|
|
|
|
D) CURRENT ASSETS |
502.691,85 |
629.564,71 |
556.838,35 |
|
I. Shareholders by required outlays |
|
|
|
|
II. Stocks |
|
17.893,21 |
|
|
III. Debtors |
463.653,00 |
583.214,69 |
536.997,09 |
|
IV. Temporary financial investment |
224,78 |
224,78 |
224,78 |
|
V. Short-term own shares |
|
|
|
|
VI. Treasury |
38.814,07 |
28.232,03 |
19.616,48 |
|
VII. Periodification adjustments |
|
|
|
|
ASSETS (A + B + C + D) |
545.364,28 |
683.454,35 |
691.571,92 |
Assets composition

Liabilities
Figures given in €
|
|
31/12/2003 (12) |
31/12/2004 (12) |
31/12/2005 (12) |
|
A) SHAREHOLDERS EQUITY |
97.872,65 |
110.614,81 |
112.275,02 |
|
I. Share capital |
60.101,21 |
60.101,21 |
60.101,21 |
|
II. Issue bonus |
|
|
|
|
III.Revaluation reserve |
|
|
|
|
IV.Reserves |
10.801,81 |
37.771,44 |
37.771,44 |
|
Capital adjustments in Euros |
|
|
|
|
Sundry reserves |
10.801,81 |
37.771,44 |
37.771,44 |
|
V.Results from previous years |
|
|
|
|
VI.Profit and Losses |
26.969,63 |
12.742,16 |
14.402,37 |
|
VII.Dividend paid during the year |
|
|
|
|
VIII.Own shares for capital reduction |
|
|
|
|
B) DEFERRED INCOME |
|
|
|
|
C) PROVISIONS FOR LIABILITIES AND EXPENSES |
30.597,80 |
|
|
|
D) LONG TERM LIABILITIES |
|
|
|
|
E) SHORT TERM LIABILITIES |
416.893,83 |
572.839,54 |
517.044,37 |
|
F) SHORT TERM PROVISIONS FOR LIABILITIES AND
EXPENSES |
|
|
62.252,53 |
|
LIABILITIES (A + B + C + D + E + F) |
545.364,28 |
683.454,35 |
691.571,92 |
Liabilities Composition


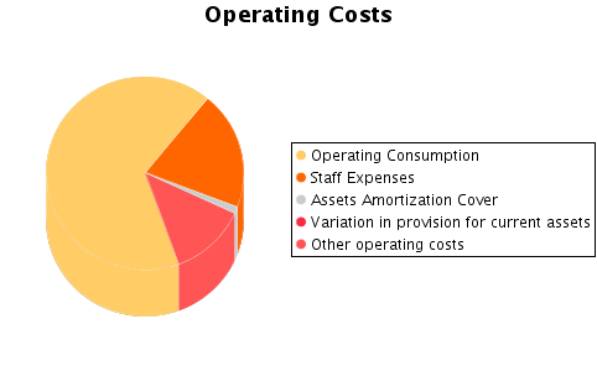
PROFIT AND LOSS ACCOUNT
Itams of the Profit and Loss Account
Figures given in €
|
|
31/12/2003 (12) |
31/12/2004 (12) |
31/12/2005 (12) |
|
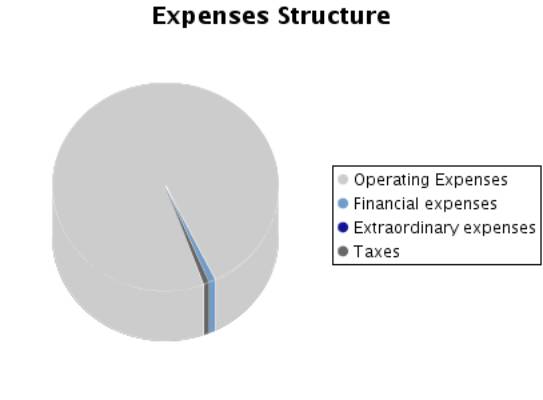
A) EXPENSES (A.1 a A.15) |
758.042,63 |
861.795,47 |
791.628,13 |
|
A.1.Operating costs |
506.532,47 |
584.529,89 |
517.840,90 |
|
A.2. Labour cost |
176.247,90 |
163.440,75 |
153.118,44 |
|
Wages |
134.652,00 |
124.436,86 |
116.114,05 |
|
Social security expenses |
41.595,90 |
39.003,89 |
37.004,39 |
|
A.3. Assets depreciation |
10.144,68 |
10.000,00 |
9.850,00 |
|
A.4. Variation in provision for current assets |
|
|
|
|
A.5. Other operating costs |
49.638,92 |
92.147,63 |
97.594,41 |
|
A.I. OPERATING RESULT (B.1-A.1-A.2-A.3-A.4-A.5) |
42.413,25 |
24.419,36 |
27.475,34 |
|
A.6.Financial expenses and similar |
3.920,25 |
6.216,27 |
6.965,25 |
|
Debts with related companies |
|
|
|
|
Debts with associated companies |
|
|
|
|
Other companies debts By debts with third parties and similar expenses |
3.920,25 |
6.216,27 |
6.965,25 |
|
Losses from financial investments |
|
|
|
|
A.7. Variation in financial investment provision |
|
|
|
|
A.8.Negative exchange difference |
|
|
|
|
A.II.POSITIVE FINANCIAL RESULTS
(B.2+B.3-A.6-A.7-A.8) |
|
|
|
|
A.III.PROFIT FROM ORDINARY ACTIVITIES
(A.I+A.II-B.I-B.II) |
38.493,00 |
18.203,09 |
20.511,50 |
|
A.9. Variation in provision in fixed assets |
|
|
|
|
A.10. Losses in fixed assets |
|
|
|
|
A.11. Losses from own shares and bonds |
|
|
|
|
A.12. Extraordinary charges |
|
|
|
|
A.13.Other exercises’ expenses and losses |
|
|
|
|
A.IV.POSITIVE EXTRAORDINARY RESULT
(B.4+B.5+B.6+B.7+B.8-A.9-A.10-A.11-A.12-A.13) |
35,04 |
|
150,00 |
|
A.V.PROFIT BEFORE TAXES (A.III+A.IV-B.III-B.IV) |
38.528,04 |
18.203,09 |
20.661,50 |
|
A.14.Corporate Taxes |
11.558,41 |
5.460,93 |
6.172,44 |
|
A.15. Other taxes |
|
|
86,69 |
|
A.VI.EXERCISE RESULT (PROFIT) (A.V-A.14-A.15) |
26.969,63 |
12.742,16 |
14.402,37 |
|
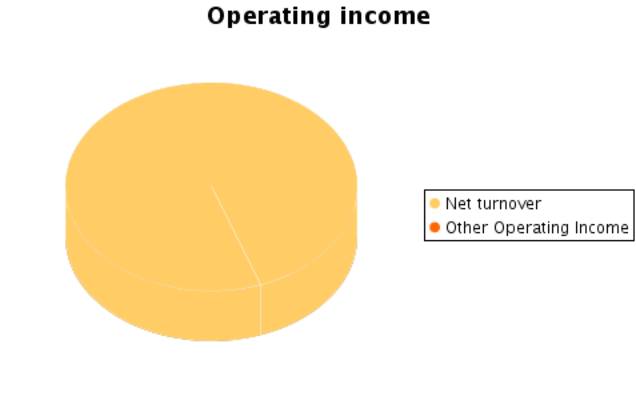
B) INCOMES (B.1 a B.8) |
785.012,26 |
874.537,63 |
806.030,50 |
|
B.1.Operating income |
784.977,22 |
874.537,63 |
805.879,09 |
|
Turnover |
784.977,22 |
874.537,63 |
805.879,09 |
|
Other operating income |
|
|
|
|
B.I.OPERATING LOSSES (A.1+A.2+A.3+A.4+A.5-B.1) |
|
|
|
|
B.2.Financial Income |
|
|
1,41 |
|
From affiliated companies |
|
|
|
|
From associated companies |
|
|
|
|
Other |
|
|
1,41 |
|
Gains from investments |
|
|
|
|
B.3. Positive change difference |
|
|
|
|
B.II. NEGATIVE FINANCIAL RESULTS
(A.6+A.7+A.8-B.2-B.3) |
3.920,25 |
6.216,27 |
6.963,84 |
|
B.III.LOSSES FROM ORDINARY ACTIVITIES
(B.I+B.II-A.I-A.II) |
|
|
|
|
B.4.B.9. Gains from disposal of fixed assets |
|
|
|
|
B.5.Gains from dealing in own shares |
|
|
|
|
B.6. Paid in surplus |
|
|
|
|
B.7. Extraordinary income |
35,04 |
|
150,00 |
|
B.8.Other year’s income and profits |
|
|
|
|
B.IV.NEGATIVE EXTRAORDINARY LOSSES
(A.9+A.10+A.11+A.12+A.13-B.4-B.5-B.6-B.7-B.8) |
|
|
|
|
B.V.LOSS BEFORE TAXES (B.III+B.IV-A.III-A.IV) |
|
|
|
|
B.VI.EXERCISE RESULTS (LOSS) (B.V+A.14+A.15) |
|
|
|
Composition of the Profit and
Loss Account

FINANCIAL BALANCE
Here the Main Capital Amounts of the company and the Revolving Fund
Evolution are analysed.
Financial Balance Table
Figures given in €
|
|
31/12/2003 (12) |
% |
31/12/2004 (12) |
% |
31/12/2005 (12) |
% |
|
A) DUE FROM SHAREHOLDERS FOR UNCALLED CAPITAL |
|
|
|
|
|
|
|
B) FIXED ASSETS |
42.672,43 |
7,82 |
53.889,64 |
7,88 |
134.733,57 |
19,48 |
|
C) DEFERRED EXPENSES |
|
|
|
|
|
|
|
D) CURRENT ASSETS |
502.691,85 |
92,18 |
629.564,71 |
92,12 |
556.838,35 |
80,52 |
|
ASSETS (A + B + C + D) |
545.364,28 |
|
683.454,35 |
|
691.571,92 |
|
|
|
||||||
|
A) SHAREHOLDERS EQUITY |
97.872,65 |
17,95 |
110.614,81 |
16,18 |
112.275,02 |
16,23 |
|
B) DEFERRED INCOME |
|
|
|
|
|
|
|
C) PROVISIONS FOR LIABILITIES AND EXPENSES |
30.597,80 |
5,61 |
|
|
|
|
|
D) LONG TERM LIABILITIES |
|
|
|
|
|
|
|
E) SHORT TERM LIABILITIES |
416.893,83 |
76,44 |
572.839,54 |
83,82 |
517.044,37 |
74,76 |
|
F) SHORT TERM PROVISIONS FOR LIABILITIES AND EXPENSES |
|
|
|
|
62.252,53 |
9,00 |
|
LIABILITIES (A + B + C + D + E + F) |
545.364,28 |
|
683.454,35 |
|
691.571,92 |
|
Financial Balance Composition


Comments on Financial Balance
In the 2003, the assets of the company were formed in 7,82% of Fixed
Assets and in 92,18% of Current Assets.This assets were financed in 17,95% with
own capitals, and in 5,61% with long term debt and in 76,44% with current
liabilities.
The result of this financial structure is a positive turnover fund of
85.798,02 Euros, which is equivalent to 15,73% proportion of the
company’s total assets.
In the 2004, the assets of the company were formed in 7,88% of Fixed
Assets and in 92,12% of Current Assets.This assets were financed in 16,18% with
own capitals and in 83,82% with current liabilities.
The result of this financial structure is a positive turnover fund of
56.725,17 Euros, which is equivalent to 8,30% proportion of the company’s
total assets.
This measure has diminished with respect to the previous exercise in
33,89% having also diminished its proportion with respect to the total assets
of the company.
In the 2005, the assets of the company were formed in 19,48% of Fixed
Assets and in 80,52% of Current Assets.This assets were financed in 16,23% with
own capitals and in 83,77% with current liabilities.
The result of this financial structure is a negative turnover fund of
-22.458,55 Euros, which is equivalent to -3,25% proportion of the company’s
total assets.
This measure has diminished with respect to the previous exercise in
139,59% having also diminished its proportion with respect to the total assets
of the company.
RATIOS
Main Ratios
|
|
31/12/2003 (12) |
31/12/2004 (12) |
31/12/2005 (12) |
|
STRUCTURAL RATIOS |
|
|
|
|
Management fund |
85.798,02 |
56.725,17 |
-22.458,55 |
|
Indebtedness (%) |
82,05 |
83,82 |
83,76 |
|
External Funds on Net Worth |
4,57 |
5,18 |
5,16 |
|
GENERAL ACTIVITY RATIO |
|
|
|
|
Turnover Increase (%) |
-2,87 |
11,41 |
-7,85 |
|
Added value growth (%) |
17,99 |
-13,52 |
-3,75 |
|
Cash Flow |
37.114,31 |
22.742,16 |
24.252,37 |
|
Labour Productivity |
1,30 |
1,21 |
1,24 |
|
Assets turnover |
1,44 |
1,28 |
1,16 |
|
Breakdown Point |
665.407,95 |
800.899,43 |
729.008,03 |
|
Security Margin of the Breakdown Point (%) |
15,23 |
8,42 |
9,54 |
|
ACTIVITY RATIOS |
|
|
|
|
Average Collection Period |
213 |
240 |
240 |
|
Inventory Turnover Period |
|
7 |
|
|
SOLVENCY RATIOS |
|
|
|
|
Payback Capacity |
0,08 |
0,04 |
0,04 |
|
Assets Guarantee |
1,22 |
1,19 |
1,19 |
|
Short Term Debts Proportion (%) |
93,16 |
100,00 |
100,00 |
|
Interest Coverage |
9,46 |
3,66 |
3,46 |
|
LIQUIDITY RATIOS |
|
|
|
|
Current Ratio |
1,21 |
1,10 |
0,96 |
|
Immediate liquidity |
0,09 |
0,05 |
0,03 |
|
Sales on Current Assets |
562 |
500 |
521 |
Results Analysis Ratios
|
|
31/12/2003 (12) |
31/12/2004 (12) |
31/12/2005 (12) |
|
Economic profitability (%) |
7,78 |
3,57 |
3,97 |
|
Operating Profitability (%) |
5,40 |
2,79 |
3,41 |
|
Equity gearing |
5,06 |
4,61 |
4,60 |
|
Financial profitability (%) |
27,56 |
11,52 |
12,83 |
|
General Profitability (%) |
3,44 |
1,46 |
1,79 |
Comments on the Results Analysis
Ratios
The economic profitability in the year2004 achieved a 3,57% positive
level, due to a 2,79% economic margin and to an assets turnover of1,28%.
The economic profitability in the year has reduced from 7,78% up to
3,57% of2004, even if it remains positive. This fall is due to the decrease in
operating profitability, that has passe from 5,40% to 2,79%, as assets turnover
whose index has passed from 1,44 to 1,28%.
Financial profitability on 2004 achieved a 11,52%.
The company’s financial structure has instigated its economic
profitability with an indebtedness level of 4,61.
The general profitability on 2004 achieved a 1,46%.
The economic profitability in the year2005 achieved a 3,97% positive
level, due to a 3,41% economic margin and to an assets turnover of1,16%.
The economic profitability in the year has increased from 3,57% up to
3,97%. This growth is due to the economic margin increase, from 2,79% to the
current 3,41% in spite of the assets turnover drop, which have decreased from
1,28 to 1,16%.
Financial profitability on 2005 achieved a 12,83%.
The company’s financial structure has instigated its economic
profitability with an indebtedness level of 4,60.
The general profitability on 2005 achieved a 1,79%.
SECTORIAL ANÁLYSIS
Large Capital Amounts and Financial Balance
Figures given in %
|
|
COMPANY (2005) |
SECTOR |
DIFFERENCE |
DIFFERENCE RELATIVE |
|
|
|
|
|
|
ASSETS |
|
|
|
|
|
|
|
|
|
|
A) DUE FROM SHAREHOLDERS FOR UNCALLED CAPITAL |
|
0,05 |
|
|
|
|
|
|
|
|
B) FIXED ASSETS |
19,48 |
34,01 |
-14,53 |
-42,73 |
|
|
|
|
|
|
C) DEFERRED EXPENSES |
|
0,54 |
|
|
|
|
|
|
|
|
D) CURRENT ASSETS |
80,52 |
65,39 |
15,13 |
23,14 |
|
|
|
|
|
|
ASSETS (A + B + C + D) |
100 |
100 |
|
|
|
|
|
|
|
|
|
|
|
|
|
|
|
|
|
|
|
|
COMPANY (2005) |
SECTOR |
DIFFERENCE |
DIFFERENCE RELATIVE |
|
|
|
|
|
|
LIABILITIES |
|
|
|
|
|
|
|
|
|
|
A) SHAREHOLDERS EQUITY |
16,23 |
34,97 |
-18,74 |
-53,59 |
|
|
|
|
|
|
B) DEFERRED INCOME |
|
0,59 |
|
|
|
|
|
|
|
|
C) PROVISIONS FOR LIABILITIES AND EXPENSES |
|
0,22 |
|
|
|
|
|
|
|
|
D) LONG TERM LIABILITIES |
|
15,24 |
|
|
|
|
|
|
|
|
E) SHORT TERM LIABILITIES |
74,76 |
48,88 |
25,88 |
52,95 |
|
|
|
|
|
|
F) SHORT TERM PROVISIONS FOR LIABILITIES AND EXPENSES |
9,00 |
0,10 |
8,90 |
9.178,35 |
|
|
|
|
|
|
LIABILITIES (A + B + C + D + E + F) |
100 |
100 |
|
|
|
|
|
|
|
Sectorial Financial Balance
Comparison


Comments to the Sectorial
Analysis
In the 2005, the assets of the company were formed in 19,48% of fixed
assets and in 80,52Current Assets % In the sector, the proportion of fixed
assets was of 34,61%, 43,72% superior, and the proportion of current assets was
of 65,39%, 23,14% inferior.
The assets were financed in the company in 16,23% with own capitals and
in 83,77% with current liabilities In the sector, the self financing
represented 35,56%, 54,36% superior. On the other hand the long term debts
represented in the sector an average of 48,98% financing, with a relative
difference of 71,04% in favour of the company
The result of this company’s financial structure is a turnover fund that
represents -3,25% of the total assets; in the sector, this same proportion is
16,41%, therefore, we can say that the company’s turnover fund is 119,80%
smaller than the sector one.
Analytical Account of Results
Figures given in %
|
|
COMPANY (2005) |
SECTOR |
DIFFERENCE |
DIFFERENCE RELATIVE |
|
Turnover |
100,00 |
99,50 |
0,50 |
0,50 |
|
Other operating income |
|
0,50 |
|
|
|
Production Value |
100,00 |
100,00 |
0,00 |
0,00 |
|
Operating expenses |
64,26 |
52,20 |
12,06 |
23,10 |
|
Other operation expenses |
12,11 |
10,88 |
1,23 |
11,27 |
|
Added value |
23,63 |
36,92 |
-13,29 |
-35,99 |
|
Labour cost |
19,00 |
29,36 |
-10,36 |
-35,28 |
|
Gross Economic Result |
4,63 |
7,56 |
-2,93 |
-38,75 |
|
Assets depreciation |
1,22 |
2,74 |
-1,52 |
-55,46 |
|
Variation in provision for current assets and bad debt losses |
|
0,18 |
|
|
|
Net Economic Result |
3,41 |
4,64 |
-1,23 |
-26,59 |
|
Financial income |
0,00 |
0,18 |
-0,18 |
-100,00 |
|
Financial Charges |
0,86 |
1,25 |
-0,39 |
-31,31 |
|
Variation in financial investment provision |
|
0,00 |
|
|
|
Ordinary Activities Result |
2,55 |
3,58 |
-1,03 |
-28,71 |
|
Extraordinary income |
0,02 |
0,57 |
-0,55 |
-96,47 |
|
Extraordinary charges |
|
0,20 |
|
|
|
Variation in provision in fixed assets |
|
0,01 |
|
|
|
Results before Taxes |
2,56 |
3,94 |
-1,38 |
-35,04 |
|
Corporate taxes |
0,78 |
1,13 |
-0,35 |
-31,10 |
|
Net Result |
1,79 |
2,81 |
-1,02 |
-36,28 |
|
Assets depreciation |
1,22 |
2,74 |
-1,52 |
-55,46 |
|
Change of Provisions |
|
0,18 |
|
|
|
Net Self-Financing |
3,01 |
5,73 |
-2,72 |
-47,43 |
Main Ratios
|
|
COMPANY (2005) |
PTILE25 |
PTILE50 |
PTILE75 |
|
STRUCTURAL RATIOS |
|
|
|
|
|
Management fund |
-22.458,55 |
-2,72 |
32,29 |
114,81 |
|
Indebtedness (%) |
83,76 |
52,80 |
71,46 |
84,16 |
|
External Funds on Net Worth |
5,16 |
1,12 |
2,50 |
5,31 |
|
GENERAL ACTIVITY RATIO |
|
|
|
|
|
Turnover Increase (%) |
-7,85 |
-7,55 |
4,85 |
18,68 |
|
Added value growth (%) |
-3,75 |
-4,54 |
5,70 |
17,67 |
|
Cash Flow |
24.252,37 |
9,46 |
22,10 |
51,26 |
|
Labour Productivity |
1,24 |
1,12 |
1,21 |
1,34 |
|
Assets turnover |
1,16 |
1,08 |
1,54 |
2,11 |
|
Breakdown Point |
729.008,03 |
241.850,92 |
459.734,01 |
887.764,48 |
|
Security Margin of the Breakdown Point (%) |
9,54 |
3,54 |
7,27 |
12,42 |
|
ACTIVITY RATIOS |
|
|
|
|
|
Average Collection Period |
240 |
40 |
75 |
116 |
|
SOLVENCY RATIOS |
|
|
|
|
|
Payback Capacity |
0,04 |
0,06 |
0,10 |
0,19 |
|
Assets Guarantee |
1,19 |
1,18 |
1,39 |
1,89 |
|
Short Term Debts Proportion (%) |
100,00 |
68,21 |
89,38 |
100,00 |
|
Interest Coverage |
3,46 |
1,94 |
5,00 |
14,83 |
|
LIQUIDITY RATIOS |
|
|
|
|
|
Current Ratio |
0,96 |
0,98 |
1,24 |
1,79 |
|
Immediate liquidity |
0,03 |
0,04 |
0,16 |
0,43 |
|
Sales on Current Assets |
521 |
597 |
832 |
1.160 |
Results Analysis Ratios
|
|
COMPANY (2005) |
PTILE25 |
PTILE50 |
PTILE75 |
|
Economic profitability (%) |
3,97 |
2,61 |
5,06 |
9,10 |
|
Operating Profitability (%) |
3,41 |
1,69 |
3,41 |
5,80 |
|
Equity gearing |
4,60 |
1,48 |
2,30 |
4,02 |
|
Financial profitability (%) |
12,83 |
4,35 |
9,82 |
17,73 |
|
General Profitability (%) |
1,79 |
0,70 |
1,61 |
3,33 |
NOTES
Here is our provisional report, until we receive the last balance sheet for
this company for 2007. The telephone included in your enquriy 91/67646363,is
not correct.
ADDITIONAL INFORMATION
This company was last displayed on 11/11/2008, 33 times in the last quarter and 124 times in total.
FOREIGN EXCHANGE
RATES
|
Currency |
Unit
|
Indian Rupees |
|
US Dollar |
1 |
Rs.49.68 |
|
UK Pound |
1 |
Rs.74.64 |
|
Euro |
1 |
Rs.62.58 |
RATING
EXPLANATIONS
|
RATING |
STATUS |
PROPOSED CREDIT LINE |
|
|
>86 |
Aaa |
Possesses an extremely sound financial base with the strongest
capability for timely payment of interest and principal sums |
Unlimited |
|
71-85 |
Aa |
Possesses adequate working capital. No caution needed for credit
transaction. It has above average (strong) capability for payment of interest
and principal sums |
Large |
|
56-70 |
A |
Financial & operational base are regarded healthy. General
unfavourable factors will not cause fatal effect. Satisfactory capability for
payment of interest and principal sums |
Fairly Large |
|
41-55 |
Ba |
Overall operation is considered normal. Capable to meet normal
commitments. |
Satisfactory |
|
26-40 |
B |
Unfavourable & favourable factors carry similar weight in credit consideration.
Capability to overcome financial difficulties seems comparatively below
average. |
Small |
|
11-25 |
Ca |
Adverse factors are apparent. Repayment of interest and principal sums
in default or expected to be in default upon maturity |
Limited with
full security |
|
<10 |
C |
Absolute credit risk exists. Caution needed to be exercised |
Credit not
recommended |
|
NR |
In view of the lack of information, we have no basis upon which to
recommend credit dealings |
No Rating |
|
This score serves as a reference to assess SC’s credit risk
and to set the amount of credit to be extended. It is calculated from a
composite of weighted scores obtained from each of the major sections of this
report. The assessed factors and their relative weights (as indicated through
%) are as follows:
Financial
condition (40%) Ownership
background (20%) Payment
record (10%)
Credit history
(10%) Market trend
(10%) Operational
size (10%)