![]()
MIRA INFORM REPORT
|
Report Date : |
17.11.2008 |
IDENTIFICATION DETAILS
|
Name : |
E D F MAN ESPANA S.A. |
|
|
|
|
Registered Office : |
|
|
|
|
|
Country : |
|
|
|
|
|
Financials (as on) : |
31.10.2006 |
|
|
|
|
Date of Incorporation : |
|
|
|
|
|
Legal Form : |
Joint Stock Company |
|
|
|
|
Line of Business : |
RATING & COMMENTS
|
MIRA’s Rating : |
B |
|
RATING |
STATUS |
PROPOSED CREDIT LINE |
|
|
26-40 |
B |
Unfavourable & favourable factors carry similar weight in credit consideration.
Capability to overcome financial difficulties seems comparatively below
average. |
Small |
|
Maximum Credit Limit : |
€ 199.998,80 |
|
|
|
|
Status : |
Moderate |
|
|
|
|
Payment Behaviour : |
Usually Correct |
|
|
|
|
Litigation : |
Clear |
Name
E D F MAN ESPANA S.A.
TAX NUMBER: A78276565
EXECUTIVE SUMMARY
Identification
Current Business Name: E D F MAN ESPANA S.A.
Other names: NO
Current Address: STREET SAGASTA, 27, CP 28004 MADRID
Branches: 1
Telephone number: 914485162 Fax: 914485862
URL: www.edfman.es
Commercial Risk
Credit Appraisal: 199.998,80 €
RAI: NO
Legal
Actions: NO
Financial Information
Latest Balance sheet sales (2006): 44.664.000,00 € (MERCANTILE REGISTER)
Result: 597.000 €
Total Assets: 10.036.000 €
Social Capital: 120.000,00 €
Employees: 12
Commercial Information
Constitution Date: 09/04/1986
Business activity: Wholesale of other foods products
NACE Code: 5139
International Operations: Imports and
Exports
Corporate Structure
President:
Parent Company:
Participations: 2
Other Complementary Information
Latest proceeding published in BORME: 01/09/2008 Re-elections
Latest press article: 30/05/2007 GACETA NEG (INFORMATION
ON LEGAL ANNOUNCE)
Bank Entities: Yes
COMMERCIAL RISK
Credit Appraisal
Maximum Credit
(from 0 a
6,000,000 €)
Favourable to 199.998,80 €
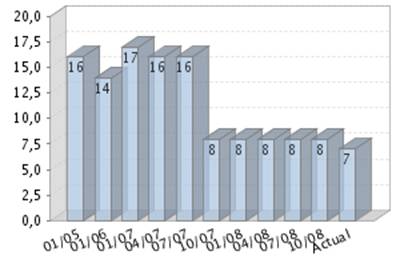
Rating Evolution
Financial Situation
Fiscal year2006
|
Treasury |
Limited |
|
Indebtedness |
Average |
|
Profitability |
Average |
|
Balance |
Very Degraded |
Performance
|
Legal Actions |
None or Negligible |
|
Business
Trajectory |
Excellent |
RAI 
COMPANY NOT REGISTERED IN THE R.A.I.
This company is not registered in the Disputed Bills register (R.A.I.)
INCIDENTS
Summary
LEGAL ACTIONS: No legal incidences registered
CLAIM FILED AGAINST THE ADMINISTRATION: No administrative
claims registered
AFFECTED BY: No significant element.
FINANCIAL ELEMENTS AND SECTORIAL
COMPARATIVE
FINANCIAL ELEMENTS
Figures given in thousands €
|
|
2004 (12) |
2005 (12) |
2006 (12) |
% ASSETS |
|
BALANCE SHEET ANALYSIS |
|
|
|
|
|
OWN FUNDS |
2.179,00 |
2.378,00 |
2.280,00 |
22,72 |
|
DEBT |
5.829,00 |
6.826,00 |
7.756,00 |
77,28 |
|
FIXED ASSETS |
364,00 |
353,00 |
3.387,00 |
33,75 |
|
TOTAL ASSETS |
8.008,00 |
9.204,00 |
10.036,00 |
|
|
|
|
|
|
|
|
|
2004 (12) |
2005 (12) |
2006 (12) |
% SALES |
|
PROFIT AND LOSS ACCOUNT ANALYSIS |
|
|
|
|
|
SALES |
53.562,00 |
54.149,00 |
44.664,00 |
|
|
ADDED VALUE |
1.856,00 |
2.026,00 |
2.267,00 |
5,08 |
|
EBITDA |
983,00 |
1.059,00 |
1.134,00 |
2,54 |
|
EBIT |
875,00 |
943,00 |
1.018,00 |
2,28 |
|
NET RESULT |
496,00 |
695,00 |
597,00 |
1,34 |
Balance Sheets Items Analysis

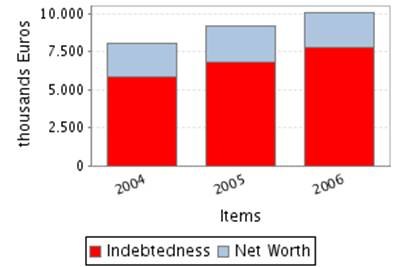
Balance Sheet Comments
Total assets of the company grew 14,94% between 2004 and 2005.
In spite of the assets’ growth, the fixed assets decreased 3,02%.
This growth has been mainly financed with a debt increase of 17,10%.
Nevertheless the net worth increased 9,13%.
Total assets of the company grew 9,04% between 2005 and 2006.
This growth is a consequence of the fixed assets increase of 859,49%.
This growth has been financed with an indebtedness increase of
13,62%.Moreover, net worth has been reduced in 4,12%, which explains a part of
the indebtedness increase. .
Profit and Loss Account Analysis


Profit and Loss Account Comments
The company’s sales figure grew 1,10% between 2004 and 2005.
The company’s EBIT grew 7,77% between 2004 and 2005.
This evolution implies an increase in the company’s operating
profitability.
The result of these variations is a decrease of the company’s Economic
Profitability of 6,23% in the analysed period, being this profitability of
10,25% in the year 2005.
The company’s Net Result grew 40,12% between 2004 and 2005.
This evolution, compared to the EBIT’s performance, implies that the
financial and extraordinary activities have had a positive effect in the
company’s Financial Profitability.
The result of these variations is an increase of the company’s Economic
Profitability of 28,40% in the analysed period, being equal to 29,23% in the
year 2005.
The company’s sales figure decreased in 17,52% between 2005 and 2006.
The company’s EBIT grew 7,95% between 2005 and 2006.
This evolution implies an increase in the company’s operating
profitability.
The result of these variations is a decrease of the company’s Economic
Profitability of 1,00% in the analysed period, being this profitability of
10,14% in the year 2006.
The company’s Net Result decreased in 14,10% between 2005 and 2006.
This evolution, compared to the EBIT’s performance, implies that the
financial and extraordinary activities have had a negative effect in the
company’s Financial Profitability.
The result of these variations is a reduction of the company’s
profitability of 10,41% in the analysed period, being equal to 26,18% in the
year 2006.
ANNUAL FINANCIAL REPORT
ADDITIONAL DATA
Source: annual financial report 2006
Results Distribution
Figures given in €
|
DISTRIBUTION
BASE |
DISTRIBUTION TO |
||
|
Profit and Loss |
596.739,21 |
Retained earnings |
0,00 |
|
Carry Over |
0,00 |
Voluntary Reserve |
596.739,21 |
|
Voluntary reserves |
0,00 |
Prior years losses |
0,00 |
|
Reserves |
0,00 |
Carry Over |
0,00 |
|
Other concepts |
0,00 |
Other funds |
0,00 |
|
Total of Amounts to be distributed |
596.739,21 |
Dividends |
0,00 |
|
|
|
Other Applications |
0,00 |
Auditing
Auditors’ opinion: FAVOURABLE
Auditor: ERNST & YOUNG S.L.
COMPARATIVE SECTOR ANALYSIS
Values table
Figures expressed in %
|
|
COMPANY (2006) |
SECTOR |
DIFFERENCE |
DIFFERENCE RELATIVE |
|
BALANCE SHEET ANALYSIS: % on the total
assets |
|
|
|
|
|
OWN FUNDS |
22,72 |
34,60 |
-11,88 |
-34,33 |
|
DEBT |
77,28 |
65,40 |
11,88 |
18,16 |
|
FIXED ASSETS |
33,75 |
42,33 |
-8,58 |
-20,27 |
|
|
|
|
|
|
|
|
COMPANY (2006) |
SECTOR |
DIFFERENCE |
DIFFERENCE RELATIVE |
|
PROFIT AND LOSS ACCOUNT ANALYSIS: % on the total
operating income |
|
|
|
|
|
SALES |
99,06 |
96,25 |
2,81 |
2,92 |
|
ADDED VALUE |
5,03 |
9,78 |
-4,75 |
-48,56 |
|
EBIT |
2,26 |
3,07 |
-0,81 |
-26,46 |
|
NET RESULT |
1,32 |
2,24 |
-0,92 |
-40,89 |
Sector Composition
Compared sector (NACE): 513
Number of companies: 186
Size (Sales Figure) : > 40.000.000,00 Euros
Comments on the sectorial
comparative
Compared to its sector the assets of the companies show an inferior proportion
of fixed assets. Specifically the difference with the sector average is -8,58%
, which means a relative difference of -20,27% .
In liabilities composition the company appeals on a wider scale to self
financing, being the proportion of net worth of 11,88% inferior, which means a
relative difference of 34,33% 11,88% more than the sector, which means a
difference of 18,16% .
The proportion that the sales mean to the company’s total ordinary
income is 99,06%, 2,81% higher than in the sector, which means a relative
difference of 2,92% .
The company’s EBIT was positive and was 2,26% with regard to the total
ordinary income, 0,81% less than the sector, which means a relative difference
of 26,46% .
The company’s capacity to generate operating income is equal to that of
the sector as its ratio EBIT/Sales is also equal.
The company’s net result was positive and equal to 1,32% with regard to
the total ordinary income, 0,92% less than the sector, which means a relative
difference of 40,89% .
The financial and extraordinary results and the tax impact have had a
negative impact on the Net result in the company with a worse behaviour than in
the sector; as a consequence, the company shows a worse Net Result/EBIT ratio
(REBEmpresa vs. REBSector).
ADDRESSES
Current Legal Seat Address:
STREET SAGASTA, 27
28004
|
STREET |
POSTAL CODE |
TOWN |
PROVINCE |
|
STREET ENTENÇA 95 |
08015 |
|
|
1 branches registered
CORPORATE STRUCTURE
ADMINISTRATIVE LINKS
Main Board members,
Directors and Auditor ![]()
|
POSITION |
SURNAMES AND
NAME |
APPOINTMENT DATE |
|
|
PRESIDENT |
MUGUIRO SARTORIUS RAFAEL |
22/11/2007 |
|
|
VICEPRESIDENT |
ALVAREZ ALONSO JOSE LUIS |
19/02/1998 |
|
|
CHIEF OFFICER |
ALSTRUP HANS ERIK |
19/02/1998 |
|
|
CHIEF OFFICER |
DOMINGUEZ PANIZO FRANCISCO RAMON |
22/11/2007 |
|
|
CHIEF OFFICER |
MUNOZ ALVAREZ DE |
22/11/2007 |
|
|
CHIEF OFFICER |
LAING JOHN BERNARD GORDON |
22/11/2007 |
|
|
AUDITOR |
APPOINTMENT DATE |
||
|
ERNST & YOUNG SL |
01/09/2008 |
||
Functional Managers
|
POSITION |
SURNAMES AND
NAME |
|
General Manager |
MUGUIRO
SARTORIUS RAFAEL |
|
Financial
Manager |
DOMINGUEZ PANISO
FRANCISCO RAMON |
|
IT Manager |
|
FINANCIAL LINKS
|
|
BUSINESS NAME |
CIF / COUNTRY |
% |
SOURCE |
DATA INF. |
|
|
E D & F MAN SUGAR LTD |
|
99,99 |
OWN SOURCES |
19/02/2008 |
You can obtain business information of a foreign companies at the
pageD&B INTERNATIONAL
Participations
|
|
BUSINESS NAME |
CIF / COUNTRY |
% |
SOURCE |
DATA INF. |
|
|
GLOBAL SUGAR SERVICES SL. |
B83570788 |
100,00 |
TRADE REG. |
31/10/2006 |
|
|
EUROSUGAR IBERICA S.L. |
B83764670 |
Indet. |
TRADE REG. |
31/10/2006 |
Company with solvency rating below 7
CREDIT INFORMATION
Constitution Date: 09/04/1986
Business activity
Code: 1612900
Activity: Wholesale of other foods products
NACE Code: 5139
NACE Activity: Non-specialized wholesale of food, beverages and
tobacco
Business: IMPORTACION, EXPORTACION, COMPRA-VENTA, ALMACENAJE
Y COMERCIALIZACION DE PRODUCTOS AGRARIOS Y AGROPECUARIOS, ASI COMO DE OTROS
PRODUCTOS DERIVADOS O CONEXOS CON LOS ANTERIORES, LAS ACTIVIDADES Y OPERACIONES
NECESARIAS PN
Employees
Number of total employees: 12 (2008)
Number of fixed employees: 100,00%
Number of temporary employees: 0,00%
Employees evolution

COMMERCIAL OPERATIONS
PURCHASES
Payments (estimated):
Import Percentage: 100%
Imports from: Suecia, Finlandia y Francia
SUPPLIERS
|
BUSINESS NAME |
INTERNATIONAL |
|
ED& MAN
SUGAR LTD |
NO |
|
ED&F MAN
SUGAR LTD |
YES |
|
AGMAN HOLDINGS
LTD |
YES |
|
AGMAN HOLDINGS
LTD |
NO |
|
EDF MAN ALCOHOLS
LTD |
NO |
|
EDF MAN SUGAR
LTD |
YES |
|
EDF MAN LTD |
NO |
7 proveedores
SALES
Collection (estimated):
On a credit basis: 100%
Export Percentage: 100%
Exports to: Oriente Medio y Norte de
CLIENTS
|
BUSINESS NAME |
INTERNATIONAL |
|
ED& F MAN SUGAR
LIMITED |
YES |
|
ED&F MAN
SUGAR ALCOHOLS LTD |
YES |
|
IBERICA DE
MELAZAS,S.A |
NO |
|
|
NO |
|
ED&F MAN
SUGAR INC |
YES |
|
SAFIC ALCAN
COMMODITIES ESPAÑA |
NO |
|
EDF MAN SUGAR
INC. |
YES |
|
ED&F MAN
SUGAR LTD |
YES |
|
IBERICA DE MELAZAS
SA |
NO |
|
EDF MAN SUGAR
LTD |
NO |
11 clientes
Banks
|
ENTITY |
BRANCH |
ADDRESS |
TOWN OR CITY |
PROVINCE |
|
BANCO DE SABADELL, S.A. |
5240 |
C SERRANO, 71 |
|
|
1 bank entities registered
LEGAL STRUCTURE
Constitution Data
Register Date: 09/04/1986
Current Legal Form: JOINT STOCK COMPANY
Current Capital: 120.000,00 €
Legal Aspects
Obligation to fill in Financial Statements: YES
Chamber census: YES (2006)
Listed on a Stock Exchange: NO
B.O.R.M.E.(Official Companies
Registry Gazette)
Registered Proceedings
|
PROCEEDINGS |
DATE |
NOTICE NUM. |
TRADE REG. |
|
Re-elections |
01/09/2008 |
415177 |
|
|
Resignations |
22/11/2007 |
579849 |
|
|
Appointments |
22/11/2007 |
579849 |
|
|
Fusion by absorption |
01/08/2007 |
404233 |
|
Other Proceedings published
|
PROCEEDINGS |
DATE |
NOTICE NUM. |
TRADE REG. |
|
Fusion by absorption project |
19/05/2008 |
150404 |
|
Press articles
30/05/2007 GACETA NEG (INFORMATION ON LEGAL ANNOUNCE)
EN LAS JUNTAS GRALES. Y UNIVERSALES DE SOCIOS DE ED&F MAN ESPAÑA SA
(SDAD. ABSORBENTE) Y SAFIC ALCAN COMMODITIES ESPAÑA SL (SDAD. ABSORBIDA),
CELEBRADAS EL 28/04/07, SE ACORDO LA FUSION POR ABSORCION DE AMBAS EMPRESAS.
FINANCIAL INFORMATION
The information on the last account contained in this report is
extracted from the Mercantile Register file of the legal address of the Company
and dated 22/08/2007.
BALANCE SHEET
Assets
Figures given in thousands €
|
|
31/10/2004 (12) |
31/10/2005 (12) |
31/10/2006 (12) |
|
A) DUE FROM SHAREHOLDERS FOR UNCALLED CAPITAL |
|
|
|
|
B) FIXED ASSETS |
364,00 |
353,00 |
3.387,00 |
|
I. Incorporation costs |
|
|
|
|
II. Intangible fixed assets |
|
33,00 |
27,00 |
|
R & D expenses |
|
|
|
|
Concessions, patents, licences , trademarks |
|
|
|
|
Goodwill |
|
|
|
|
Acquired rights from finance leases |
|
|
|
|
Software |
|
39,00 |
45,00 |
|
Leasing |
|
|
|
|
Cash advance |
|
|
|
|
Provisions |
|
|
|
|
Depreciation |
|
-6,00 |
-18,00 |
|
III. Tangible fixed assets |
355,00 |
305,00 |
212,00 |
|
Property, plant and equipment |
|
|
|
|
Machinery, equipment and other |
|
|
|
|
Other property plant and equipment |
334,00 |
341,00 |
343,00 |
|
Prepaid expenses on fixed assets |
|
|
|
|
Other assets |
274,00 |
280,00 |
289,00 |
|
Provisions |
|
|
|
|
Depreciation |
-253,00 |
-316,00 |
-420,00 |
|
IV. Financial fixed assets |
9,00 |
15,00 |
3.148,00 |
|
Shares in affiliated companies |
|
|
3.135,00 |
|
Receivables in affiliated companies |
|
|
|
|
Shares in associated companies |
|
|
|
|
Loans to associated companies |
|
|
|
|
Securities |
|
|
1,00 |
|
Other loans |
|
|
|
|
Long term deposits and guarantees |
9,00 |
15,00 |
16,00 |
|
Provisions |
|
|
-4,00 |
|
Taxes receivable |
|
|
|
|
V.Owners equity |
|
|
|
|
VI.Long term trade liabilities |
|
|
|
|
C) DEFERRED EXPENSES |
7,00 |
|
|
|
D) CURRENT ASSETS |
7.637,00 |
8.851,00 |
6.649,00 |
|
I. Shareholders by required outlays |
|
|
|
|
II. Stocks |
701,00 |
2.182,00 |
260,00 |
|
Goods available for sale |
701,00 |
2.182,00 |
260,00 |
|
Raw material inventory |
|
|
|
|
Work in Progress |
|
|
|
|
Finished goods |
|
|
|
|
Subproducts and recycled materials |
|
|
|
|
Cash advance |
|
|
|
|
Provisions |
|
|
|
|
III. Debtors |
6.060,00 |
4.720,00 |
3.073,00 |
|
Clients |
5.948,00 |
4.596,00 |
2.931,00 |
|
Amounts owned by affiliated companies |
16,00 |
17,00 |
15,00 |
|
Amounts owned by associated companies |
|
|
|
|
Other debts |
96,00 |
91,00 |
110,00 |
|
Staff Expenses |
|
|
17,00 |
|
Government |
|
16,00 |
|
|
Provisions |
|
|
|
|
IV. Temporary financial investment |
754,00 |
1.823,00 |
3.108,00 |
|
Shares in affiliated companies |
|
|
|
|
Receivables in affiliated companies |
754,00 |
1.823,00 |
3.108,00 |
|
Shares in associated companies |
|
|
|
|
Loans to associated companies |
|
|
|
|
Short term investment |
|
|
|
|
Other loans |
|
|
|
|
Short Term Deposit and guarantees |
|
|
|
|
Provisions |
|
|
|
|
V. Short-term own shares |
|
|
|
|
VI. Treasury |
122,00 |
126,00 |
208,00 |
|
VII. Periodification adjustments |
|
|
|
|
ASSETS (A + B + C + D) |
8.008,00 |
9.204,00 |
10.036,00 |
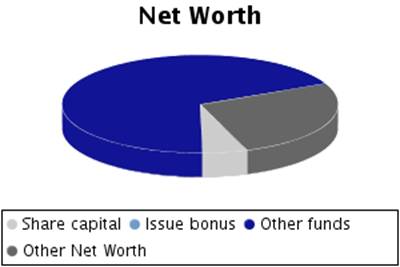
Assets composition


Liabilities
Figures given in thousands €
|
|
31/10/2004 (12) |
31/10/2005 (12) |
31/10/2006 (12) |
|
A) SHAREHOLDERS EQUITY |
2.179,00 |
2.378,00 |
2.280,00 |
|
I. Share capital |
120,00 |
120,00 |
120,00 |
|
II. Issue bonus |
|
|
|
|
III.Revaluation reserve |
|
|
|
|
IV.Reserves |
1.563,00 |
1.563,00 |
1.563,00 |
|
Retained earnings |
24,00 |
24,00 |
24,00 |
|
Sinking fund from owner equity |
|
|
|
|
Reserve for the parent company capital |
|
|
|
|
Statutory reserve |
|
|
|
|
Other funds |
1.539,00 |
1.539,00 |
1.539,00 |
|
Capital adjustments in Euros |
|
|
|
|
V.Results from previous years |
|
|
|
|
Carry Over |
|
|
|
|
Prior years losses |
|
|
|
|
Loans from partners for losses compensation |
|
|
|
|
VI.Profit and Losses |
496,00 |
695,00 |
597,00 |
|
VII.Dividend paid during the year |
|
|
|
|
VIII.Own shares for capital reduction |
|
|
|
|
B) DEFERRED INCOME |
|
|
|
|
Capital grants |
|
|
|
|
Positive change difference |
|
|
|
|
Other deferred income |
|
|
|
|
Fiscal deferred income |
|
|
|
|
C) PROVISIONS FOR LIABILITIES AND EXPENSES |
|
|
|
|
Provision for pensions plans |
|
|
|
|
Provision for taxes |
|
|
|
|
Other provisions |
|
|
|
|
Reversion fund |
|
|
|
|
D) LONG TERM LIABILITIES |
|
|
3,00 |
|
I.Negotiable bonds and other negotiable values |
|
|
|
|
Non convertible securities |
|
|
|
|
Convertible securities |
|
|
|
|
Other convertible debentures |
|
|
|
|
II.Debt with bank entities |
|
|
|
|
Long term bank loans |
|
|
|
|
Leasing |
|
|
|
|
III.Debts with associated and affiliated
companies |
|
|
|
|
With affiliated companies |
|
|
|
|
Associated companies |
|
|
|
|
IV. Other creditors |
|
|
3,00 |
|
Bills payable |
|
|
|
|
Other debts |
|
|
|
|
Long term deposit and guaranties |
|
|
3,00 |
|
Taxes receivable |
|
|
|
|
V. Deferred debts on shares |
|
|
|
|
From affiliated companies |
|
|
|
|
From associated companies |
|
|
|
|
Other companies |
|
|
|
|
VI. Long term debt with creditor |
|
|
|
|
E) SHORT TERM LIABILITIES |
5.829,00 |
6.826,00 |
7.753,00 |
|
I.Negotiable bonds and other negotiable values |
|
|
|
|
Non convertible securities |
|
|
|
|
Convertible securities |
|
|
|
|
Other convertible debentures |
|
|
|
|
Interests from bonds |
|
|
|
|
II.Debt with bank entities |
|
|
|
|
Loans and other debts |
|
|
|
|
Debt interest |
|
|
|
|
Leasing |
|
|
|
|
III. Short term debts with associated and
affiliated companies |
183,00 |
1.780,00 |
3.898,00 |
|
With affiliated companies |
183,00 |
1.780,00 |
3.898,00 |
|
Associated companies |
|
|
|
|
IV. Commercial creditors |
5.235,00 |
4.547,00 |
3.322,00 |
|
Accounts payable |
|
|
38,00 |
|
Expenses |
5.235,00 |
4.547,00 |
3.284,00 |
|
Bills payable |
|
|
|
|
V. Other non-commercial debt |
411,00 |
499,00 |
533,00 |
|
Government |
159,00 |
141,00 |
175,00 |
|
Bills payable |
|
|
|
|
Other debts |
|
|
|
|
Accounts receivable |
252,00 |
358,00 |
358,00 |
|
Short term deposits and guarantees |
|
|
|
|
VI. Provisions for current assets |
|
|
|
|
VII. Periodification adjustments |
|
|
|
|
F) SHORT TERM PROVISIONS FOR LIABILITIES AND
EXPENSES |
|
|
|
|
LIABILITIES (A + B + C + D + E + F) |
8.008,00 |
9.204,00 |
10.036,00 |
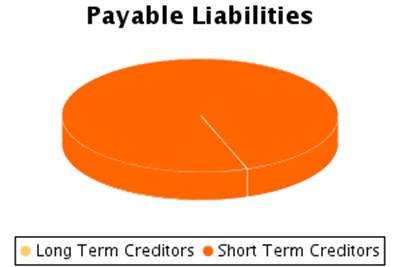
Liabilities Composition

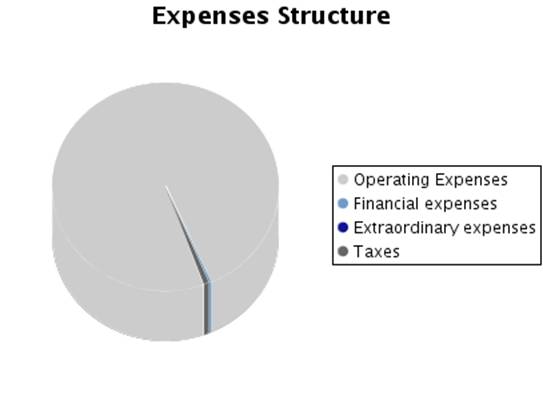
PROFIT AND LOSS ACCOUNT
Itams of the Profit
and Loss Account
Figures given in thousands €
|
|
31/10/2004 (12) |
31/10/2005 (12) |
31/10/2006 (12) |
|
A) EXPENSES (A.1 a A.16) |
53.387,00 |
53.871,00 |
44.554,00 |
|
A.1.Reduction in stocks of finished goods and
work in progress |
|
|
|
|
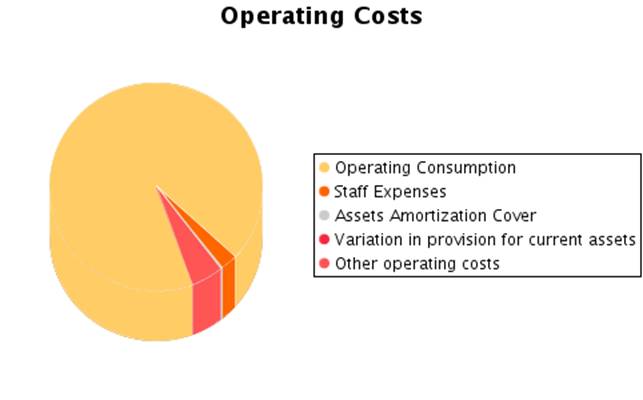
A.2.Supplies |
50.138,00 |
50.034,00 |
40.672,00 |
|
Material consumed |
49.434,00 |
49.238,00 |
38.458,00 |
|
Raw materials consumed |
|
|
|
|
Other expenses |
704,00 |
796,00 |
2.214,00 |
|
A.3. Labour cost |
873,00 |
967,00 |
1.133,00 |
|
Wages |
731,00 |
809,00 |
933,00 |
|
Social security expenses |
142,00 |
158,00 |
200,00 |
|
A.4. Assets depreciation |
108,00 |
116,00 |
116,00 |
|
A.5.Variance in the traffic provisions |
|
|
|
|
Variance in provision for inventory |
|
|
|
|
Variance in provision for bad debts |
|
|
|
|
Variance in provision for other current assets |
|
|
|
|
A.6. Other operating costs |
1.847,00 |
2.368,00 |
2.149,00 |
|
External costs |
1.847,00 |
2.368,00 |
2.149,00 |
|
Taxes |
|
|
|
|
Other day to day expenses |
|
|
|
|
Allowance to reversion fund |
|
|
|
|
A.I.OPERATING RESULT
(B.1+B.2+B.3+B.4-A.1-A.2-A.3-A.4-A.5-A.6) |
875,00 |
943,00 |
1.018,00 |
|
A.7.Financial expenses and similar |
|
|
146,00 |
|
Debts with related companies |
|
|
146,00 |
|
Debts with associated companies |
|
|
|
|
Other companies debts By debts with third parties and similar expenses |
|
|
|
|
Losses from financial investments |
|
|
|
|
A.8. Variation in financial investment provision |
|
|
|
|
A.9.Negative exchange difference |
140,00 |
|
2,00 |
|
A.II.POSITIVE FINANCIAL RESULTS
(B.5+B.6+B.7+B.8-A.7-A.8-A.9) |
|
123,00 |
|
|
A.III.PROFIT FROM ORDINARY ACTIVITIES
(A.I+A.II-B.I-B.II) |
771,00 |
1.066,00 |
933,00 |
|
A.10. Variation in provision in fixed assets |
|
|
|
|
A.11. Losses in fixed assets |
3,00 |
|
|
|
A.12. Losses from own shares and bonds |
|
|
|
|
A.13. Extraordinary charges |
|
|
|
|
A.14.Other exercises’ expenses and losses |
|
|
|
|
A.IV.POSITIVE EXTRAORDINARY RESULT
(B.9+B.10+B.11+B.12+B.13-A.10-A.11-A.12-A.13-A.14) |
3,00 |
15,00 |
|
|
A.V.PROFIT BEFORE TAXES (A.III+A.IV-B.III-B.IV) |
774,00 |
1.081,00 |
933,00 |
|
A.15.Corporate Taxes |
278,00 |
386,00 |
336,00 |
|
A.16. Other taxes |
|
|
|
|
A.VI.EXERCISE RESULT (PROFIT) (A.V-A.14-A.15) |
496,00 |
695,00 |
597,00 |
|
B) INCOMES (B.1 a B13) |
53.883,00 |
54.566,00 |
45.151,00 |
|
B.1. Turnover |
53.562,00 |
54.149,00 |
44.664,00 |
|
Sales |
53.061,00 |
53.729,00 |
44.327,00 |
|
Services provided |
501,00 |
420,00 |
337,00 |
|
Refunds and sale reminders |
|
|
|
|
B.2.Increase in inventory of finished goods and
works in progress |
|
|
|
|
B.3.Expenses capitalized |
|
|
|
|
B.4. Other operating income |
279,00 |
279,00 |
424,00 |
|
Other incomes |
279,00 |
279,00 |
424,00 |
|
Grants |
|
|
|
|
Excess in provision for liabilities and charges |
|
|
|
|
B.I.OPERATING LOSSES
(A.1+A.2+A.3+A.4+A.5+A.6-B.1-B.2-B.3-B.4) |
|
|
|
|
B.5.Incomes from share participations |
|
|
|
|
From affiliated companies |
|
|
|
|
From associated companies |
|
|
|
|
From other companies |
|
|
|
|
B.6.Income from other securities and credits to
fixed assets |
|
|
|
|
From affiliated companies |
|
|
|
|
From associated companies |
|
|
|
|
Other companies |
|
|
|
|
B.7.Other interests and similar |
36,00 |
27,00 |
63,00 |
|
From affiliated companies |
16,00 |
21,00 |
56,00 |
|
From associated companies |
|
|
|
|
Other Interests |
20,00 |
6,00 |
7,00 |
|
Profits from investments |
|
|
|
|
B.8. Positive change difference |
|
96,00 |
|
|
B.II. NEGATIVE FINANCIAL RESULTS
(A.7+A.8+A.9-B.5-B.6-B.7-B.8) |
104,00 |
|
85,00 |
|
B.III.LOSSES FROM ORDINARY ACTIVITIES
(B.I+B.II-A.I-A.II) |
|
|
|
|
B.9.B.9. Gains from disposal of fixed assets |
6,00 |
15,00 |
|
|
B.10.Gains from dealing in own shares |
|
|
|
|
B.11. Paid in surplus |
|
|
|
|
B.12. Extraordinary income |
|
|
|
|
B.13.Other year’s income and profits |
|
|
|
|
B.IV.NEGATIVE EXTRAORDINARY LOSSES (A.10+A.11+A.12+A.13+A.14-B.9-B.10-B.11-B.12-B.13) |
|
|
|
|
B.V.LOSS BEFORE TAXES (B.III+B.IV-A.III-A.IV) |
|
|
|
|
B.VI.EXERCISE RESULTS (LOSS) (B.V+A.14+A.15) |
|
|
|
Composition of the Profit and
Loss Account

FINANCIAL BALANCE
Here the Main Capital Amounts of the company and the Revolving Fund
Evolution are analysed.
Financial Balance
Table
Figures given in thousands €
|
|
31/10/2004 (12) |
% |
31/10/2005 (12) |
% |
31/10/2006 (12) |
% |
|
A) DUE FROM SHAREHOLDERS FOR UNCALLED CAPITAL |
|
|
|
|
|
|
|
B) FIXED ASSETS |
364,00 |
4,55 |
353,00 |
3,84 |
3.387,00 |
33,75 |
|
C) DEFERRED EXPENSES |
7,00 |
0,09 |
|
|
|
|
|
D) CURRENT ASSETS |
7.637,00 |
95,37 |
8.851,00 |
96,16 |
6.649,00 |
66,25 |
|
ASSETS (A + B + C + D) |
8.008,00 |
|
9.204,00 |
|
10.036,00 |
|
|
|
||||||
|
A) SHAREHOLDERS EQUITY |
2.179,00 |
27,21 |
2.378,00 |
25,84 |
2.280,00 |
22,72 |
|
B) DEFERRED INCOME |
|
|
|
|
|
|
|
C) PROVISIONS FOR LIABILITIES AND EXPENSES |
|
|
|
|
|
|
|
D) LONG TERM LIABILITIES |
|
|
|
|
3,00 |
0,03 |
|
E) SHORT TERM LIABILITIES |
5.829,00 |
72,79 |
6.826,00 |
74,16 |
7.753,00 |
77,25 |
|
F) SHORT TERM PROVISIONS FOR LIABILITIES AND EXPENSES |
|
|
|
|
|
|
|
LIABILITIES (A + B + C + D + E + F) |
8.008,00 |
|
9.204,00 |
|
10.036,00 |
|
Financial Balance Composition
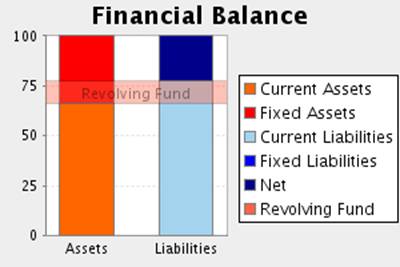

Comments on Financial Balance
In the 2004, the assets of the company were formed in 4,63% of Fixed
Assets and in 95,37% of Current Assets. This assets were financed in 27,21%
with own capitals and in 72,79% with current liabilities.
The result of this financial structure is a positive turnover fund of
1.808,00 Euros, which is equivalent to 22,58% proportion of the company’s
total assets.
In the 2005, the assets of the company were formed in 3,84% of Fixed
Assets and in 96,16% of Current Assets. This assets were financed in 25,84%
with own capitals and in 74,16% with current liabilities.
The result of this financial structure is a positive turnover fund of
2.025,00 Euros, which is equivalent to 22,00% proportion of the company’s
total assets.
This measure has increased with respect to the previous exercise in
12,00% having, however, diminished its proportion with respect to the total
assets of the company.
In the 2006, the assets of the company were formed in 33,75% of Fixed
Assets and in 66,25% of Current Assets. This assets were financed in 22,72%
with own capitals, and in 0,03% with long term debt and in 77,25% with current
liabilities.
The result of this financial structure is a negative turnover fund of
-1.104,00 thousands Euros, which is equivalent to -11,00% proportion of
the company’s total assets.
This measure has diminished with respect to the previous exercise in
154,52% having also diminished its proportion with respect to the total assets
of the company.
RATIOS
Main Ratios
|
|
31/10/2004 (12) |
31/10/2005 (12) |
31/10/2006 (12) |
|
STRUCTURAL RATIOS |
|
|
|
|
Management fund |
1.808,00 |
2.025,00 |
-1.104,00 |
|
Management Fund Requirement |
932,00 |
76,00 |
-4.420,00 |
|
Indebtedness (%) |
72,79 |
74,16 |
77,28 |
|
External Funds on Net Worth |
2,68 |
2,87 |
3,40 |
|
GENERAL ACTIVITY RATIO |
|
|
|
|
Turnover Increase (%) |
1,43 |
1,10 |
-17,52 |
|
Added value growth (%) |
-22,57 |
9,16 |
11,90 |
|
Cash Flow |
604,00 |
811,00 |
713,00 |
|
Labour Productivity |
2,13 |
2,10 |
2,00 |
|
Assets turnover |
6,69 |
5,88 |
4,45 |
|
Breakdown Point |
41.118,65 |
42.747,16 |
34.694,07 |
|
Security Margin of the Breakdown Point (%) |
23,63 |
21,46 |
23,05 |
|
ACTIVITY RATIOS |
|
|
|
|
Average Payment Period |
38 |
33 |
29 |
|
Average Collection Period |
41 |
31 |
25 |
|
Inventory Turnover Period |
5 |
15 |
2 |
|
SOLVENCY RATIOS |
|
|
|
|
Payback Capacity |
0,10 |
0,12 |
0,09 |
|
Assets Guarantee |
1,37 |
1,35 |
1,29 |
|
Short Term Debts Proportion (%) |
100,00 |
100,00 |
99,96 |
|
Interest Coverage |
|
|
4,45 |
|
LIQUIDITY RATIOS |
|
|
|
|
Current Ratio |
1,31 |
1,30 |
0,86 |
|
Immediate liquidity |
0,15 |
0,29 |
0,43 |
|
Treasury |
876,00 |
1.949,00 |
3.316,00 |
|
Sales on Current Assets |
2.525 |
2.202 |
2.418 |
Results Analysis Ratios
|
|
31/10/2004 (12) |
31/10/2005 (12) |
31/10/2006 (12) |
|
Economic profitability (%) |
10,93 |
10,25 |
10,14 |
|
Operating Profitability (%) |
1,63 |
1,74 |
2,28 |
|
Equity gearing |
3,24 |
4,38 |
4,03 |
|
Financial profitability (%) |
22,76 |
29,23 |
26,18 |
|
General Profitability (%) |
0,93 |
1,28 |
1,34 |
Comments on the Results Analysis
Ratios
The economic profitability in the year2005 achieved a 10,25% positive
level, due to a 1,74% economic margin and to an assets turnover of5,88%.
The economic profitability in the year has reduced from 10,93% up to
10,25% of2005, even if it remains positive. The decrease in assets turnover
from 6,69% to the current level of 5,88has provoked this drop, which has not
been compensated by the parallel increase of the economic margin from 1,74% to
1,63%.
Financial profitability on 2005 achieved a 29,23%.
The company’s financial structure has instigated its economic
profitability with an indebtedness level of 4,38.
The general profitability on 2005 achieved a 1,28%.
The economic profitability in the year2006 achieved a 10,14% positive
level, due to a 2,28% economic margin and to an assets turnover of4,45%.
The economic profitability in the year has reduced from 10,25% up to
10,14% of2006, even if it remains positive. The decrease in assets turnover
from 5,88% to the current level of 4,45has provoked this drop, which has not
been compensated by the parallel increase of the economic margin from 2,28% to
1,74%.
Financial profitability on 2006 achieved a 26,18%.
The company’s financial structure has instigated its economic
profitability with an indebtedness level of 4,03.
The general profitability on 2006 achieved a 1,34%.
SECTORIAL ANÁLYSIS
Large Capital Amounts
and Financial Balance
Figures given in %
|
|
COMPANY (2006) |
SECTOR |
DIFFERENCE |
DIFFERENCE RELATIVE |
|
ASSETS |
|
|
|
|
|
A) DUE FROM SHAREHOLDERS FOR UNCALLED CAPITAL |
|
0,04 |
|
|
|
B) FIXED ASSETS |
33,75 |
42,33 |
-8,58 |
-20,27 |
|
C) DEFERRED EXPENSES |
|
0,12 |
|
|
|
D) CURRENT ASSETS |
66,25 |
57,51 |
8,74 |
15,19 |
|
ASSETS (A + B + C + D) |
100 |
100 |
|
|
|
|
|
|
|
|
|
|
COMPANY (2006) |
SECTOR |
DIFFERENCE |
DIFFERENCE RELATIVE |
|
LIABILITIES |
|
|
|
|
|
A) SHAREHOLDERS EQUITY |
22,72 |
33,32 |
-10,60 |
-31,82 |
|
B) DEFERRED INCOME |
|
1,27 |
|
|
|
C) PROVISIONS FOR LIABILITIES AND EXPENSES |
|
3,38 |
|
|
|
D) LONG TERM LIABILITIES |
0,03 |
12,34 |
-12,31 |
-99,76 |
|
E) SHORT TERM LIABILITIES |
77,25 |
49,66 |
27,59 |
55,56 |
|
F) SHORT TERM PROVISIONS FOR LIABILITIES AND EXPENSES |
|
0,02 |
|
|
|
LIABILITIES (A + B + C + D + E + F) |
100 |
100 |
|
|
Sectorial Financial Balance
Comparison

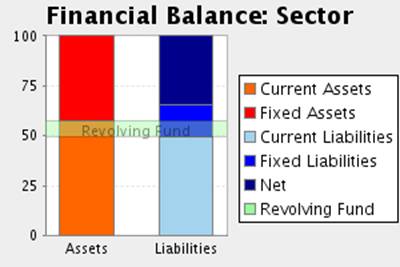
Comments to the Sectorial
Analysis
In the 2006, the assets of the company were formed in 33,75% of fixed
assets and in 66,25Current Assets % In the sector, the proportion of fixed
assets was of 42,49%, 20,56% superior, and the proportion of current assets was
of 57,51%, 15,19% inferior.
The assets were financed in the company in 22,72% with own capitals , in
0,03% with fixed liabilities and in 77,25% with current liabilities In the
sector, the self financing represented 34,60%, 34,33% superior. On the other
hand the long term debts represented in the sector an average of 15,73%
financing, with a relative difference of 99,81% favourable to the sectorAnd,
short term liabilities represented in the sector an average of 49,68%
financing, with a relative difference of 55,50% in favour of the company
The result of this company’s financial structure is a turnover fund that
represents -11,00% of the total assets; in the sector, this same proportion is
7,83%, therefore, we can say that the company’s turnover fund is 240,41%
smaller than the sector one.
Analytical Account of Results
Figures given in %
|
|
COMPANY (2006) |
SECTOR |
DIFFERENCE |
DIFFERENCE RELATIVE |
|
Turnover |
99,06 |
96,25 |
2,81 |
2,92 |
|
Other operating income |
0,94 |
3,75 |
-2,81 |
-74,93 |
|
Production Value |
100,00 |
100,00 |
0,00 |
0,00 |
|
Operating expenses |
90,21 |
80,55 |
9,66 |
11,99 |
|
Other operation expenses |
4,77 |
9,67 |
-4,90 |
-50,68 |
|
Added value |
5,03 |
9,78 |
-4,74 |
-48,54 |
|
Labour cost |
2,51 |
5,44 |
-2,93 |
-53,87 |
|
Gross Economic Result |
2,52 |
4,33 |
-1,81 |
-41,86 |
|
Assets depreciation |
0,26 |
1,17 |
-0,91 |
-77,74 |
|
Variation in provision for current assets and bad debt losses |
|
0,10 |
|
|
|
Net Economic Result |
2,26 |
3,07 |
-0,81 |
-26,38 |
|
Financial income |
0,14 |
1,04 |
-0,90 |
-86,60 |
|
Financial Charges |
0,33 |
1,00 |
-0,67 |
-67,16 |
|
Variation in financial investment provision |
|
0,00 |
|
|
|
Ordinary Activities Result |
2,07 |
3,10 |
-1,04 |
-33,33 |
|
Extraordinary income |
|
0,68 |
|
|
|
Extraordinary charges |
|
0,35 |
|
|
|
Variation in provision in fixed assets |
|
0,42 |
|
|
|
Results before Taxes |
2,07 |
3,01 |
-0,94 |
-31,30 |
|
Corporate taxes |
0,75 |
0,77 |
-0,02 |
-2,98 |
|
Net Result |
1,32 |
2,24 |
-0,92 |
-41,07 |
|
Assets depreciation |
0,26 |
1,17 |
-0,91 |
-77,74 |
|
Change of Provisions |
|
0,52 |
|
|
|
Net Self-Financing |
1,58 |
3,93 |
-2,35 |
-59,76 |
Main Ratios
|
|
COMPANY (2006) |
PTILE25 |
PTILE50 |
PTILE75 |
|
STRUCTURAL RATIOS |
|
|
|
|
|
Management fund |
-1.104,00 |
435,18 |
3.034,53 |
7.303,30 |
|
Management Fund Requirement |
-4.420,00 |
-9.844,88 |
-3.721,62 |
383,19 |
|
Indebtedness (%) |
77,28 |
57,46 |
70,63 |
81,32 |
|
External Funds on Net Worth |
3,40 |
1,35 |
2,40 |
4,35 |
|
GENERAL ACTIVITY RATIO |
|
|
|
|
|
Turnover Increase (%) |
-17,52 |
-0,32 |
5,54 |
12,19 |
|
Added value growth (%) |
11,90 |
-5,61 |
5,85 |
14,97 |
|
Cash Flow |
713,00 |
739,00 |
1.539,10 |
3.629,85 |
|
Labour Productivity |
2,00 |
1,37 |
1,67 |
2,39 |
|
Assets turnover |
4,45 |
1,64 |
2,23 |
3,28 |
|
Breakdown Point |
34.694,07 |
40.488.346,67 |
50.095.352,26 |
98.949.873,68 |
|
Security Margin of the Breakdown Point (%) |
23,05 |
5,53 |
12,82 |
24,59 |
|
ACTIVITY RATIOS |
|
|
|
|
|
Average Payment Period |
29 |
30 |
49 |
80 |
|
Average Collection Period |
25 |
41 |
63 |
96 |
|
Inventory Turnover Period |
2 |
9 |
23 |
53 |
|
SOLVENCY RATIOS |
|
|
|
|
|
Payback Capacity |
0,09 |
0,04 |
0,08 |
0,16 |
|
Assets Guarantee |
1,29 |
1,23 |
1,42 |
1,72 |
|
Short Term Debts Proportion (%) |
99,96 |
78,18 |
92,59 |
98,74 |
|
Interest Coverage |
4,45 |
1,06 |
2,94 |
10,58 |
|
LIQUIDITY RATIOS |
|
|
|
|
|
Current Ratio |
0,86 |
1,02 |
1,20 |
1,45 |
|
Immediate liquidity |
0,43 |
0,03 |
0,11 |
0,30 |
|
Treasury |
3.316,00 |
-6.543,69 |
-1.062,03 |
2.624,03 |
|
Sales on Current Assets |
2.418 |
820 |
1.169 |
1.755 |
Results Analysis Ratios
|
|
COMPANY (2006) |
PTILE25 |
PTILE50 |
PTILE75 |
|
Economic profitability (%) |
10,14 |
1,71 |
3,78 |
7,84 |
|
Operating Profitability (%) |
2,28 |
0,78 |
1,65 |
3,28 |
|
Equity gearing |
4,03 |
1,77 |
2,78 |
4,06 |
|
Financial profitability (%) |
26,18 |
4,99 |
9,71 |
17,33 |
|
General Profitability (%) |
1,34 |
0,53 |
1,13 |
2,60 |
NOTES
ABOUT
YOUR REQUEST:
-The
address included in your enquiry belongs to a branch.
-Here is our final report. Eventhough this company is obliged to
file its balance sheet in the Mercantile Register, no official
balance sheet is available for 2007.
ADDITIONAL INFORMATION
This company was last displayed on 06/11/2008, 90 times in the last quarter and 476 times in total.
FOREIGN EXCHANGE RATES
|
Currency |
Unit
|
Indian Rupees |
|
US Dollar |
1 |
Rs.50.52 |
|
|
1 |
Rs.75.54 |
|
Euro |
1 |
Rs.63.12 |
RATING EXPLANATIONS
|
RATING |
STATUS |
PROPOSED CREDIT LINE |
|
|
>86 |
Aaa |
Possesses an extremely sound financial base with the strongest capability
for timely payment of interest and principal sums |
Unlimited |
|
71-85 |
Aa |
Possesses adequate working capital. No caution needed for credit
transaction. It has above average (strong) capability for payment of interest
and principal sums |
Large |
|
56-70 |
A |
Financial & operational base are regarded healthy. General
unfavourable factors will not cause fatal effect. Satisfactory capability for
payment of interest and principal sums |
Fairly Large |
|
41-55 |
Ba |
Overall operation is considered normal. Capable to meet normal
commitments. |
Satisfactory |
|
26-40 |
B |
Unfavourable & favourable factors carry similar weight in credit
consideration. Capability to overcome financial difficulties seems
comparatively below average. |
Small |
|
11-25 |
Ca |
Adverse factors are apparent. Repayment of interest and principal sums
in default or expected to be in default upon maturity |
Limited with
full security |
|
<10 |
C |
Absolute credit risk exists. Caution needed to be exercised |
Credit not
recommended |
|
NR |
In view of the lack of information, we have no basis upon which to
recommend credit dealings |
No Rating |
|
This score serves as a reference to assess SC’s credit risk
and to set the amount of credit to be extended. It is calculated from a
composite of weighted scores obtained from each of the major sections of this
report. The assessed factors and their relative weights (as indicated through
%) are as follows:
Financial
condition (40%) Ownership
background (20%) Payment
record (10%)
Credit history
(10%) Market trend
(10%) Operational
size (10%)