![]()
MIRA
INFORM REPORT
|
Report Date : |
25.11.2008 |
IDENTIFICATION DETAILS
|
Name : |
EXTRACTOS VEGETALES SA ”EVESA” |
|
|
|
|
Registered Office : |
|
|
|
|
|
Country : |
|
|
|
|
|
Financials (as on) : |
30.04.2006 |
|
|
|
|
Date of Incorporation : |
|
|
|
|
|
Legal Form : |
Joint Stock Company |
|
|
|
|
Line of Business : |
RATING & COMMENTS
|
MIRA’s Rating : |
Ba |
|
RATING |
STATUS |
PROPOSED CREDIT LINE |
|
|
41-55 |
Ba |
Overall operation is considered normal. Capable to meet normal
commitments. |
Satisfactory |
|
Maximum Credit Limit : |
211.556,26 € |
|
|
|
|
Status : |
Satisfactory |
|
|
|
|
Payment Behaviour : |
Regular |
|
|
|
|
Litigation : |
Clear |
FINANCIAL
REPORT
EXTRACTOS VEGETALES SA ”EVESA”
TAX NUMBER: A28270510
EXECUTIVE SUMMARY
Identification
Current Business Name: EXTRACTOS
VEGETALES SA
Commercial Name: EVESA
Commercial Name: EVESA
Other names: NO
Current Address: STREET MONTERA, 5 (PLT 2
B), CP 28013 MADRID
Branches: 2
Telephone number : 956698070 Fax: 956698006
URL : www.evesa.com Corporate e-mail: evesa@evesa.com
Commercial Risk
Credit Appraisal: 211.556,26 €
RAI: NO
Legal Actions: NO
Financial
Information
Latest Balance sheet sales (2006): 12.355.854,09 € (MERCANTILE REGISTER)
Result: 647.097,28 €
Total Assets:
9.161.661,1 €
Social Capital: 576.960,00 €
Employees: 45
Commercial Information
Constitution Date: 19/10/1971
Business activity: Mfg. of fruit & vegetable juice
NACE Code: 1532
International Operations: Imports and Exports
Corporate Structure
Sole Administrator:
Parent Company:
Other Complementary Information
Latest proceeding published in BORME: 13/03/2008 Change
of statutes
Latest press article: 19/11/2007 ABC (INFORMATION
ON LEGAL ANNOUNCE)
Bank Entities: Yes
COMMERCIAL RISK
Credit Appraisal
Maximum Credit
(from 0 a 6,000,000 €)
Favourable to 211.556,26 €
Rating Evolution
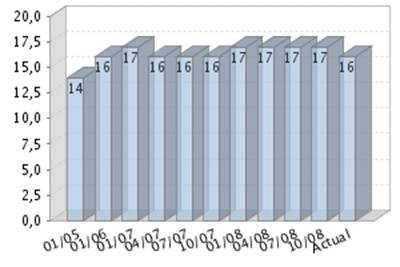
Financial Situation
Fiscal year2006
|
Treasury |
Excellent |
|
Indebtedness |
Weak |
|
Profitability |
Sufficient |
|
Balance |
Excellent |
Performance
|
Legal Actions |
None or Negligible |
|
Business
Trajectory |
Excellent |
COMPANY NOT REGISTERED IN THE R.A.I.
This company is not registered in the Disputed Bills register (R.A.I.)
INCIDENTS

Summary
LEGAL ACTIONS: No legal incidences
registered
CLAIM FILED AGAINST THE ADMINISTRATION: No administrative
claims registered
AFFECTED BY: No significant
element.
FINANCIAL ELEMENTS AND SECTORIAL COMPARATIVE
FINANCIAL ELEMENTS
Figures given in €
|
|
2004 (12) |
2005 (4) |
2006 (12) |
% ASSETS |
|
|
|
|
|
|
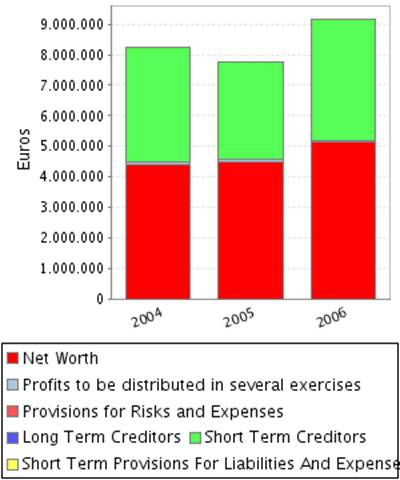
BALANCE SHEET
ANALYSIS |
|
|
|
|
|
|
|
|
|
|
OWN FUNDS |
4.500.721,59 |
4.576.658,79 |
5.178.462,36 |
56,52 |
|
|
|
|
|
|
DEBT |
3.761.661,17 |
3.196.248,21 |
3.983.198,74 |
43,48 |
|
|
|
|
|
|
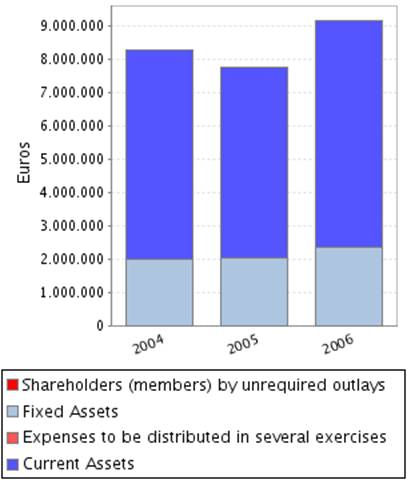
FIXED ASSETS |
2.010.632,34 |
2.031.594,87 |
2.363.385,25 |
25,80 |
|
|
|
|
|
|
TOTAL ASSETS |
8.262.382,76 |
7.772.907,00 |
9.161.661,10 |
|
|
|
|
|
|
|
|
2004 (12) |
2005 (4) |
2006 (12) |
% SALES |
|
|
|
|
|
|
PROFIT AND LOSS
ACCOUNT ANALYSIS |
|
|
|
|
|
|
|
|
|
|
SALES |
10.853.125,86 |
4.102.339,96 |
12.355.854,09 |
|
|
|
|
|
|
|
ADDED VALUE |
1.582.767,17 |
558.763,44 |
2.446.437,72 |
19,80 |
|
|
|
|
|
|
EBITDA |
661.226,86 |
203.444,45 |
1.329.071,63 |
10,76 |
|
|
|
|
|
|
EBIT |
252.225,67 |
72.810,65 |
987.338,53 |
7,99 |
|
|
|
|
|
|
NET RESULT |
133.260,11 |
91.035,10 |
647.097,28 |
5,24 |
|
|
|
|
|
ANNUAL FINANCIAL REPORT ADDITIONAL DATA
Source: annual financial report 2006
Results Distribution
Figures given in €
|
DISTRIBUTION
BASE |
DISTRIBUTION TO |
||
|
Profit and Loss |
647.097,28 |
Retained earnings |
0,00 |
|
Carry Over |
0,00 |
Voluntary Reserve |
647.097,28 |
|
Voluntary reserves |
0,00 |
Prior years losses |
0,00 |
|
Reserves |
0,00 |
Carry Over |
0,00 |
|
Other concepts |
0,00 |
Other funds |
0,00 |
|
Total of Amounts to be distributed |
647.097,28 |
Dividends |
0,00 |
|
|
|
Other Applications |
0,00 |
AUDITING
Auditors’ opinion: FAVOURABLE
Auditor: AUDITORES Y CONSULTORES
COMPARATIVE SECTOR ANALYSIS
Values table
Figures expressed in %
|
|
COMPANY (2006) |
SECTOR |
DIFFERENCE |
DIFFERENCE RELATIVE |
|
|
|
|
|
|
BALANCE SHEET
ANALYSIS: % on the total assets |
|
|
|
|
|
|
|
|
|
|
OWN FUNDS |
56,52 |
41,84 |
14,69 |
35,11 |
|
|
|
|
|
|
DEBT |
43,48 |
58,16 |
-14,69 |
-25,25 |
|
|
|
|
|
|
FIXED ASSETS |
25,80 |
42,10 |
-16,30 |
-38,72 |
|
|
|
|
|
|
|
|
|
|
|
|
|
|
|
|
|
|
COMPANY (2006) |
SECTOR |
DIFFERENCE |
DIFFERENCE RELATIVE |
|
|
|
|
|
|
PROFIT AND LOSS
ACCOUNT ANALYSIS: % on the total operating income |
|
|
|
|
|
|
|
|
|
|
SALES |
99,48 |
99,11 |
0,36 |
0,37 |
|
|
|
|
|
|
ADDED VALUE |
19,70 |
20,13 |
-0,43 |
-2,15 |
|
|
|
|
|
|
EBIT |
7,95 |
3,41 |
4,54 |
133,04 |
|
|
|
|
|
|
NET RESULT |
5,21 |
2,51 |
2,70 |
107,40 |
|
|
|
|
|
SECTOR COMPOSITION
Compared sector (NACE): 153
Number of companies: 73
Size (Sales Figure) : 7.000.000,00 -
40.000.000,00 Euros
Comments on the sectorial comparative
Compared to its
sector the assets of the companies show an inferior proportion of fixed assets.
Specifically the difference with the sector average is -16,30% , which means a
relative difference of -38,72% .
In liabilities
composition the company appeals on a wider scale to self financing, being the
proportion of net worth of 14,69% superior, which means a relative difference
of 35,11% . As a consequence, external financing sources are less used by the
company in 14,69% less than the sector, which means a difference of 25,25% .
The proportion
that the sales mean to the company’s total ordinary income is 99,48%, 0,36%
higher than in the sector, which means a relative difference of 0,37% .
The company’s EBIT
was positive and was 7,95% with regard to the total ordinary income, 4,54%
higher than in the sector, which means a relative difference of 133,04% .
The company’s
capacity to generate operating income is higher than the one of the sector as
its ratio EBIT/Sales is higher (ES Company versus ES Sector).
The company’s net
result was positive and equal to 5,21% with regard to the total ordinary
income, 2,70% higher than in the sector, which means a relative difference of
107,40% .
The financial and extraordinary results and
the tax impact have had a negative impact on the Net result in the company with
a worse behaviour than in the sector; as a consequence, the company shows a
worse Net Result/EBIT ratio (REBEmpresa vs. REBSector).
ADDRESSES
Current Legal Seat Address:
STREET MONTERA, 5 (PLT 2 B)
28013
Previous Seat Address:
PERIOD CANALEJAS, 6 - 4,
28014
Characteristics of the current address
Type of premises: store
Local Situation: main
|
STREET |
POSTAL CODE |
TOWN |
PROVINCE |
|
APARTADO DE CORREOS 103 |
11300 |
|
Cádiz |
|
POLIGONO |
11300 |
|
Cádiz |
2 branches registered
CORPORATE STRUCTURE
ADMINISTRATIVE LINKS
Main Board members, Directors and Auditor ![]()
|
POSITION |
SURNAMES AND
NAME |
APPOINTMENT DATE |
|
|
SOLE
ADMINISTRATOR |
INVERSIONES NARBONA S L |
19/12/2006 |
|
|
AUDITOR |
APPOINTMENT DATE |
||
|
AUDITORES Y CONSULTORES S L |
23/02/1999 |
||
FUNCTIONAL MANAGERS
|
POSITION |
SURNAMES AND
NAME |
|
Commercial Manager |
FERNANDEZ ANTONIO |
FINANCIAL LINKS
|
|
BUSINESS NAME |
CIF / COUNTRY |
% |
SOURCE |
DATA INF. |
|
|
INVERSIONES NARBONA SL. |
B91264036 |
100,00 |
OWN SOURCES |
24/11/2008 |
CREDIT INFORMATION
Constitution Date: 19/10/1971
BUSINESS ACTIVITY
Activity: Mfg. of fruit & vegetable juice
NACE Code: 1532
NACE Activity: Manufacture of fruit
and vegetable juice
Business: INVESTIGACION Y DESARROLLO DE NUEVOS
PRODUCTOS, NUEVOS PROCESOS, ASI COMO MEJORA TECNOLOGICA SUSTANCIAL DE PRODUCTOS
Y PROCESOS, PARA USO PROPIO. COMERCIALIZACION DE PRODUCTOS AROMATICOS,
NATURALES Y SINTETICOS
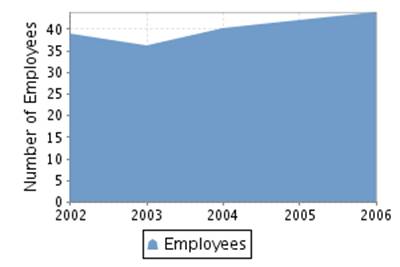
Employees
Number of total employees: 45 (2008)
Number of fixed employees: 100,00%
Number of temporary employees: 0,00%
Employees evolution
COMMERCIAL OPERATIONS
SUPPLIERS
|
BUSINESS NAME |
INTERNATIONAL |
|
DESTILACIONES BORDAS
CHINCHURRETA SA |
NO |
|
INVERSIONES
NARBONA |
NO |
|
SOCIEDAD ANONIMA
DE PLANTAS |
NO |
3 proveedores
CLIENTS
|
BUSINESS NAME |
INTERNATIONAL |
|
SOCIEDAD ANONIMA
DE PLANTAS |
NO |
|
DESTILACIONES
BORDAS CHINCHURRETA SA |
NO |
2 clientes
|
ENTITY |
BRANCH |
ADDRESS |
TOWN OR CITY |
PROVINCE |
|
BANCO BILBAO VIZCAYA ARGENTARIA, S.A. |
0220 |
VIRGEN |
|
Cádiz |
|
|
|
|
|
|
|
|
9478 |
MARQUES CASA
ARIZON, 3 DPL. |
JEREZ DE LA FRONTERA |
Cádiz |
|
BANCO SANTANDER, S.A. |
|
|
LINEA DE LA |
|
4 bank entities registered
BRANDS, SIGNS AND COMMERCIAL NAMES ![]()
ANAGRAM: EVESA
LEGAL STRUCTURE
Constitution Data
Register Date: 19/10/1971
Current Legal Form: JOINT STOCK
COMPANY
Current Capital: 576.960,00 €
LEGAL ASPECTS
Obligation to fill in Financial Statements: YES
Chamber census: YES (2006)
Listed on a Stock Exchange: NO
B.O.R.M.E.(OFFICIAL COMPANIES REGISTRY GAZETTE) ![]()
Registered Proceedings
|
PROCEEDINGS |
DATE |
NOTICE NUM. |
TRADE REG. |
|
Change of statutes |
13/03/2008 |
142548 |
|
|
Change of address |
13/03/2008 |
142548 |
|
|
Declaration of individual ownership |
14/02/2007 |
89289 |
|
|
Appointments |
19/12/2006 |
604528 |
|
Other Proceedings published
|
PROCEEDINGS |
DATE |
NOTICE NUM. |
TRADE REG. |
|
Registration of accounts (2006) Individual |
03/01/2007 |
3409 |
|
Press articles
19/11/2007 ABC (INFORMATION ON LEGAL ANNOUNCE)
LA JUNTA GRAL. EXTRAORDINARIA DE ACCIONISTAS DE ESTA SDAD., CELEBRADA EL
DIA 29/10/07, HA ACORDADO TRASLADAR EL DOMICILIO SOCIAL DE LA CIA. DENTRO DEL
TERMINO MUNICIPAL DE MADRID DE LA PLAZA DE CANALEJAS, N. 6, PLANTA 4, A LA C/
MONTERA, N. 5, PLANTA 2-B, CP 28013.
27/12/1993 CINCO DIAS (INFORMATION ON LEGAL ANNOUNCE)
LA JUNTA GRAL. DE SOCIOS DE ESTA CIA. EN REUNION CELEBRADA EL DIA 22 DE
MAYO DE 1992 ACORDO MODIFICAR EL OBJETO SOCIAL, QUE PASA A SER EL SIGUIENTE: LA
PRODUCCION DE EXTRACTOS VEGETALES Y DERIVADOS AGRICOLAS, ASI
FINANCIAL INFORMATION
The information on the last account contained in this report is
extracted from the Mercantile Register file of the legal address of the Company
and dated 17/09/2007.
BALANCE SHEET
Assets
Figures given in €
|
|
31/12/2004 (12) |
30/04/2005 (4) |
30/04/2006 (12) |
|
A) DUE FROM SHAREHOLDERS FOR UNCALLED CAPITAL |
|
|
|
|
B) FIXED ASSETS |
2.010.632,34 |
2.031.594,87 |
2.363.385,25 |
|
I. Incorporation costs |
24.259,84 |
18.868,84 |
2.695,60 |
|
II. Intangible fixed assets |
|
|
|
|
R & D expenses |
790.778,47 |
817.231,12 |
882.153,13 |
|
Concessions, patents, licences , trademarks |
|
|
|
|
Goodwill |
|
|
|
|
Acquired rights from finance leases |
|
|
|
|
Software |
|
|
|
|
Leasing |
|
|
|
|
Cash advance |
|
|
|
|
Provisions |
|
|
|
|
Depreciation |
-790.778,47 |
-817.231,12 |
-882.153,13 |
|
III. Tangible fixed assets |
1.632.158,96 |
1.658.512,49 |
2.006.476,11 |
|
Property, plant and equipment |
1.566.724,99 |
1.568.072,09 |
1.569.487,09 |
|
Machinery, equipment and other |
4.608.196,83 |
4.635.030,49 |
5.341.676,30 |
|
Other property plant and equipment |
149.702,43 |
154.255,70 |
158.839,26 |
|
Prepaid expenses on fixed assets |
106.200,00 |
167.120,00 |
|
|
Other assets |
312.179,74 |
319.025,61 |
381.505,71 |
|
Provisions |
|
|
|
|
Depreciation |
-5.110.845,03 |
-5.184.991,40 |
-5.445.032,25 |
|
IV. Financial fixed assets |
8.544,51 |
8.544,51 |
8.544,51 |
|
Shares in affiliated companies |
5.582,20 |
5.582,20 |
5.582,20 |
|
Receivables in affiliated companies |
|
|
|
|
Shares in associated companies |
|
|
|
|
Loans to associated companies |
|
|
|
|
Securities |
|
|
|
|
Other loans |
|
|
|
|
Long term deposits and guarantees |
2.962,31 |
2.962,31 |
2.962,31 |
|
Provisions |
|
|
|
|
Taxes receivable |
|
|
|
|
V.Owners equity |
345.669,03 |
345.669,03 |
345.669,03 |
|
VI.Long term trade liabilities |
|
|
|
|
C) DEFERRED EXPENSES |
|
|
|
|
D) CURRENT ASSETS |
6.251.750,42 |
5.741.312,13 |
6.798.275,85 |
|
I. Shareholders by required outlays |
|
|
|
|
II. Stocks |
2.394.364,35 |
2.269.714,22 |
3.060.460,24 |
|
Goods available for sale |
532.683,16 |
304.508,80 |
226.623,59 |
|
Raw material inventory |
497.269,30 |
243.632,37 |
528.945,02 |
|
Work in Progress |
|
|
|
|
Finished goods |
958.037,34 |
626.406,13 |
650.038,12 |
|
Subproducts and recycled materials |
|
|
|
|
Cash advance |
406.374,55 |
1.095.166,92 |
1.654.853,51 |
|
Provisions |
|
|
|
|
III. Debtors |
3.062.979,01 |
3.233.020,43 |
3.274.607,67 |
|
Clients |
2.968.833,92 |
3.424.108,18 |
3.453.292,41 |
|
Amounts owned by affiliated companies |
149.516,79 |
113.607,31 |
285.876,42 |
|
Amounts owned by associated companies |
|
|
|
|
Other debts |
308.531,65 |
16.055,55 |
15.786,56 |
|
Staff Expenses |
214,71 |
400,00 |
680,00 |
|
Government |
254.833,42 |
322.444,65 |
163.164,54 |
|
Provisions |
-618.951,48 |
-643.595,26 |
-644.192,26 |
|
IV. Temporary financial investment |
459.558,00 |
|
|
|
Shares in affiliated companies |
|
|
|
|
Receivables in affiliated companies |
|
|
|
|
Shares in associated companies |
|
|
|
|
Loans to associated companies |
|
|
|
|
Short term investment |
|
|
|
|
Other loans |
459.558,00 |
|
|
|
Short Term Deposit and guarantees |
|
|
|
|
Provisions |
|
|
|
|
V. Short-term own shares |
|
|
|
|
VI. Treasury |
334.849,06 |
238.577,48 |
463.207,94 |
|
VII. Periodification adjustments |
|
|
|
|
ASSETS (A + B + C + D) |
8.262.382,76 |
7.772.907,00 |
9.161.661,10 |
Assets composition

Liabilities
Figures given in €
|
|
31/12/2004 (12) |
30/04/2005 (4) |
30/04/2006 (12) |
|
A) SHAREHOLDERS EQUITY |
4.384.976,35 |
4.476.011,45 |
5.123.108,73 |
|
I. Share capital |
576.960,00 |
576.960,00 |
576.960,00 |
|
II. Issue bonus |
|
|
|
|
III.Revaluation reserve |
|
|
|
|
IV.Reserves |
3.674.756,24 |
3.808.016,35 |
3.899.051,45 |
|
Retained earnings |
123.484,19 |
123.484,19 |
123.484,19 |
|
Sinking fund from owner equity |
345.669,03 |
345.669,03 |
345.669,03 |
|
Reserve for the parent company capital |
|
|
|
|
Statutory reserve |
|
|
|
|
Other funds |
3.205.603,02 |
3.338.863,13 |
3.429.898,23 |
|
Capital adjustments in Euros |
|
|
|
|
V.Results from previous years |
|
|
|
|
Carry Over |
|
|
|
|
Prior years losses |
|
|
|
|
Loans from
partners for losses compensation |
|
|
|
|
VI.Profit and Losses |
133.260,11 |
91.035,10 |
647.097,28 |
|
VII.Dividend paid during the year |
|
|
|
|
VIII.Own shares for capital reduction |
|
|
|
|
B) DEFERRED INCOME |
115.745,24 |
100.647,34 |
55.353,63 |
|
Capital grants |
115.745,24 |
100.647,34 |
55.353,63 |
|
Positive change difference |
|
|
|
|
Other deferred income |
|
|
|
|
Fiscal deferred income |
|
|
|
|
C) PROVISIONS FOR LIABILITIES AND EXPENSES |
|
|
|
|
Provision for pensions plans |
|
|
|
|
Provision for taxes |
|
|
|
|
Other provisions |
|
|
|
|
Reversion fund |
|
|
|
|
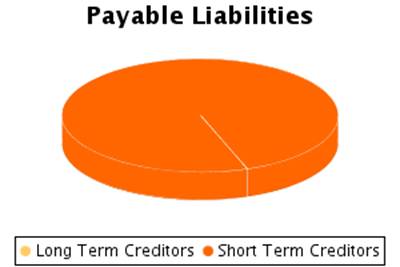
D) LONG TERM LIABILITIES |
|
|
|
|
I.Negotiable bonds
and other negotiable values |
|
|
|
|
Non convertible securities |
|
|
|
|
Convertible securities |
|
|
|
|
Other convertible debentures |
|
|
|
|
II.Debt with bank entities |
|
|
|
|
Long term bank loans |
|
|
|
|
Leasing |
|
|
|
|
III.Debts with associated and affiliated
companies |
|
|
|
|
With affiliated companies |
|
|
|
|
Associated companies |
|
|
|
|
IV. Other creditors |
|
|
|
|
Bills payable |
|
|
|
|
Other debts |
|
|
|
|
Long term deposit and guaranties |
|
|
|
|
Taxes receivable |
|
|
|
|
V. Deferred debts on shares |
|
|
|
|
From affiliated companies |
|
|
|
|
From associated companies |
|
|
|
|
Other companies |
|
|
|
|
VI. Long term debt with creditor |
|
|
|
|
E) SHORT TERM LIABILITIES |
3.761.661,17 |
3.196.248,21 |
3.983.198,74 |
|
I.Negotiable bonds and other negotiable values |
|
|
|
|
Non convertible securities |
|
|
|
|
Convertible securities |
|
|
|
|
Other convertible debentures |
|
|
|
|
Interests from bonds |
|
|
|
|
II.Debt with bank entities |
2.432.803,09 |
2.137.396,73 |
2.269.326,32 |
|
Loans and other debts |
2.428.445,15 |
2.130.269,21 |
2.263.126,32 |
|
Debt interest |
4.357,94 |
7.127,52 |
6.200,00 |
|
Leasing |
|
|
|
|
III. Short term debts with associated and
affiliated companies |
51.667,02 |
30.157,41 |
194.133,09 |
|
With affiliated companies |
51.667,02 |
30.157,41 |
194.133,09 |
|
Associated companies |
|
|
|
|
IV. Commercial creditors |
1.151.388,38 |
899.325,63 |
1.085.751,09 |
|
Accounts payable |
|
|
|
|
Expenses |
1.151.388,38 |
899.325,63 |
1.085.351,08 |
|
Bills payable |
|
|
400,01 |
|
V. Other non-commercial debt |
125.802,68 |
129.368,44 |
433.988,24 |
|
Government |
59.651,54 |
70.717,28 |
64.851,95 |
|
Bills payable |
|
|
|
|
Other debts |
20.723,30 |
|
311.978,97 |
|
Accounts receivable |
45.427,84 |
58.651,16 |
57.157,32 |
|
Short term deposits and guarantees |
|
|
|
|
VI. Provisions for current assets |
|
|
|
|
VII. Periodification adjustments |
|
|
|
|
F) SHORT TERM PROVISIONS FOR LIABILITIES AND
EXPENSES |
|
|
|
|
LIABILITIES (A + B + C + D + E + F) |
8.262.382,76 |
7.772.907,00 |
9.161.661,10 |
Liabilities
Composition
PROFIT AND LOSS ACCOUNT
Itams of the Profit and Loss Account
Figures given in €
|
|
31/12/2004 (12) |
30/04/2005 (4) |
30/04/2006 (12) |
|
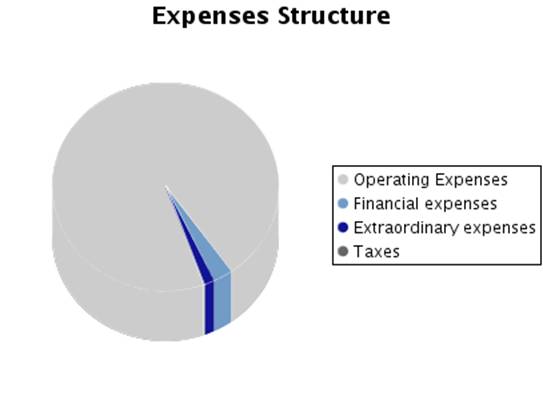
A) EXPENSES (A.1 a A.16) |
11.002.001,46 |
4.127.951,40 |
11.973.324,16 |
|
A.1.Reduction in stocks of finished goods and
work in progress |
1.600.564,53 |
331.631,21 |
|
|
A.2.Supplies |
6.082.925,78 |
2.708.859,45 |
8.051.120,53 |
|
Material consumed |
587.253,08 |
318.540,99 |
896.849,13 |
|
Raw materials consumed |
5.495.672,70 |
2.390.318,46 |
7.154.271,40 |
|
Other expenses |
|
|
|
|
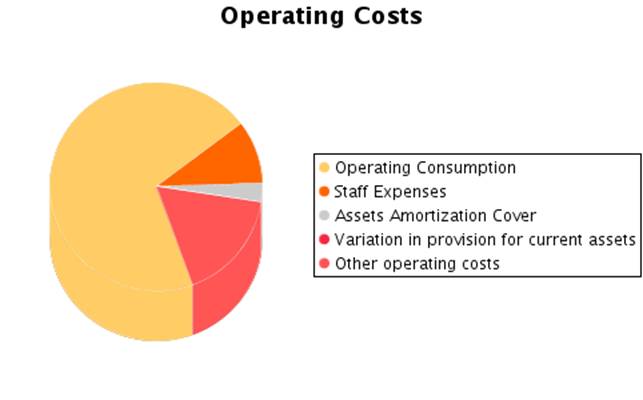
A.3. Labour cost |
921.540,31 |
355.318,99 |
1.117.366,09 |
|
Wages |
724.445,64 |
278.833,64 |
883.307,41 |
|
Social security expenses |
197.094,67 |
76.485,35 |
234.058,68 |
|
A.4. Assets depreciation |
409.001,19 |
105.990,02 |
341.136,10 |
|
A.5.Variance in the traffic provisions |
|
24.643,78 |
597,00 |
|
Variance in provision for inventory |
|
|
|
|
Variance in provision for bad debts |
|
24.643,78 |
597,00 |
|
Variance in provision for other current assets |
|
|
|
|
A.6. Other operating costs |
1.662.511,72 |
529.538,51 |
1.946.849,84 |
|
External costs |
1.643.002,56 |
523.105,34 |
1.920.327,39 |
|
Taxes |
19.509,16 |
6.433,17 |
26.522,45 |
|
Other day to day expenses |
|
|
|
|
Allowance to reversion fund |
|
|
|
|
A.I.OPERATING
RESULT (B.1+B.2+B.3+B.4-A.1-A.2-A.3-A.4-A.5-A.6) |
252.225,67 |
72.810,65 |
987.338,53 |
|
A.7.Financial expenses and similar |
87.732,16 |
22.651,06 |
67.706,15 |
|
Debts with related companies |
|
|
|
|
Debts with associated companies |
|
|
|
|
Other companies debts By debts with third parties and similar expenses |
87.732,16 |
22.651,06 |
67.706,15 |
|
Losses from financial investments |
|
|
|
|
A.8. Variation in financial investment provision |
|
|
|
|
A.9.Negative exchange difference |
211.585,61 |
29.553,26 |
261.450,89 |
|
A.II.POSITIVE
FINANCIAL RESULTS (B.5+B.6+B.7+B.8-A.7-A.8-A.9) |
|
22.891,67 |
|
|
A.III.PROFIT FROM
ORDINARY ACTIVITIES (A.I+A.II-B.I-B.II) |
57.232,95 |
95.702,32 |
788.901,13 |
|
A.10. Variation
in provision in fixed assets |
|
|
|
|
A.11. Losses in
fixed assets |
|
|
|
|
A.12. Losses
from own shares and bonds |
|
|
|
|
A.13. Extraordinary
charges |
|
|
|
|
A.14.Other
exercises’ expenses and losses |
|
|
179.956,64 |
|
A.IV.POSITIVE
EXTRAORDINARY RESULT (B.9+B.10+B.11+B.12+B.13-A.10-A.11-A.12-A.13-A.14) |
102.167,32 |
15.097,90 |
|
|
A.V.PROFIT BEFORE
TAXES (A.III+A.IV-B.III-B.IV) |
159.400,27 |
110.800,22 |
654.238,20 |
|
A.15.Corporate
Taxes |
26.140,16 |
19.765,12 |
7.140,92 |
|
A.16. Other
taxes |
|
|
|
|
A.VI.EXERCISE
RESULT (PROFIT) (A.V-A.14-A.15) |
133.260,11 |
91.035,10 |
647.097,28 |
|
B) INCOMES (B.1
a B13) |
11.135.261,57 |
4.218.986,50 |
12.620.421,44 |
|
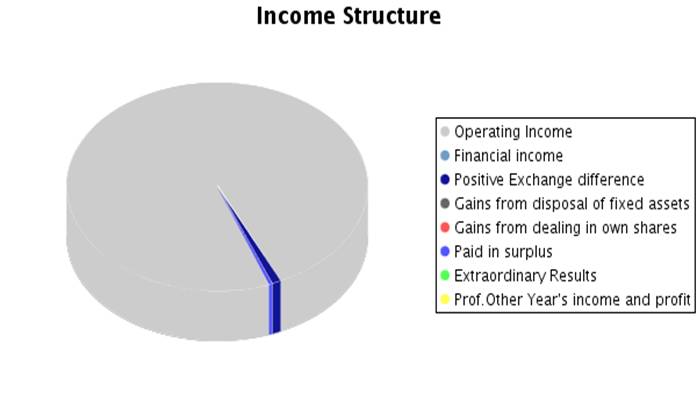
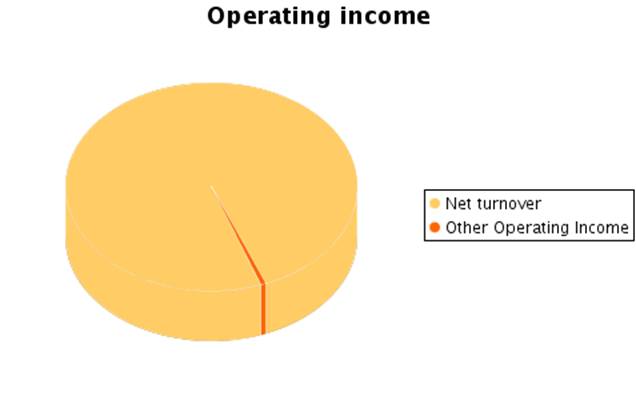
B.1. Turnover |
10.853.125,86 |
4.102.339,96 |
12.355.854,09 |
|
Sales |
11.001.196,84 |
4.153.793,46 |
12.624.688,86 |
|
Services
provided |
20.588,05 |
1.207,00 |
5.890,44 |
|
Refunds and sale
reminders |
-168.659,03 |
-52.660,50 |
-274.725,21 |
|
B.2.Increase in
inventory of finished goods and works in progress |
|
|
23.631,99 |
|
B.3.Expenses
capitalized |
74.819,17 |
26.452,65 |
64.922,01 |
|
B.4. Other
operating income |
824,17 |
|
|
|
Other incomes |
|
|
|
|
Grants |
824,17 |
|
|
|
Excess in
provision for liabilities and charges |
|
|
|
|
B.I.OPERATING
LOSSES (A.1+A.2+A.3+A.4+A.5+A.6-B.1-B.2-B.3-B.4) |
|
|
|
|
B.5.Incomes from share participations |
|
|
|
|
From affiliated companies |
|
|
|
|
From associated companies |
|
|
|
|
From other companies |
|
|
|
|
B.6.Income from other securities and credits to
fixed assets |
|
|
|
|
From affiliated companies |
|
|
|
|
From associated companies |
|
|
|
|
Other companies |
|
|
|
|
B.7.Other interests and similar |
210,78 |
797,13 |
1.016,45 |
|
From affiliated companies |
|
|
|
|
From associated companies |
|
|
|
|
Other Interests |
210,78 |
797,13 |
1.016,45 |
|
Profits from investments |
|
|
|
|
B.8. Positive change difference |
104.114,27 |
74.298,86 |
129.703,19 |
|
B.II. NEGATIVE FINANCIAL RESULTS
(A.7+A.8+A.9-B.5-B.6-B.7-B.8) |
194.992,72 |
|
198.437,40 |
|
B.III.LOSSES
FROM ORDINARY ACTIVITIES (B.I+B.II-A.I-A.II) |
|
|
|
|
B.9.B.9. Gains from disposal of fixed assets |
|
|
|
|
B.10.Gains from dealing in own shares |
|
|
|
|
B.11. Paid in surplus |
85.425,48 |
15.097,90 |
45.293,71 |
|
B.12. Extraordinary income |
16.741,84 |
|
|
|
B.13.Other year’s income and profits |
|
|
|
|
B.IV.NEGATIVE
EXTRAORDINARY LOSSES (A.10+A.11+A.12+A.13+A.14-B.9-B.10-B.11-B.12-B.13) |
|
|
134.662,93 |
|
B.V.LOSS BEFORE TAXES (B.III+B.IV-A.III-A.IV) |
|
|
|
|
B.VI.EXERCISE RESULTS (LOSS) (B.V+A.14+A.15) |
|
|
|
Composition of the
Profit and Loss Account
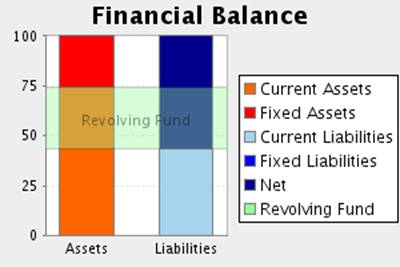
FINANCIAL BALANCE
Here the Main Capital Amounts of the company and the Revolving Fund
Evolution are analysed.
Financial Balance Table
Figures given in €
|
|
31/12/2004 (12) |
% |
30/04/2005 (4) |
% |
30/04/2006 (12) |
% |
|
A) DUE FROM
SHAREHOLDERS FOR UNCALLED CAPITAL |
|
|
|
|
|
|
|
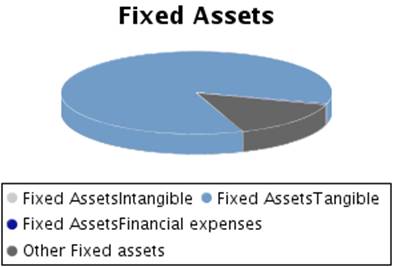
B) FIXED ASSETS |
2.010.632,34 |
24,33 |
2.031.594,87 |
26,14 |
2.363.385,25 |
25,80 |
|
C) DEFERRED
EXPENSES |
|
|
|
|
|
|
|
D) CURRENT
ASSETS |
6.251.750,42 |
75,67 |
5.741.312,13 |
73,86 |
6.798.275,85 |
74,20 |
|
ASSETS (A + B +
C + D) |
8.262.382,76 |
|
7.772.907,00 |
|
9.161.661,10 |
|
|
|
||||||
|
A) SHAREHOLDERS
EQUITY |
4.384.976,35 |
53,07 |
4.476.011,45 |
57,58 |
5.123.108,73 |
55,92 |
|
B) DEFERRED
INCOME |
115.745,24 |
1,40 |
100.647,34 |
1,29 |
55.353,63 |
0,60 |
|
|
|
|
|
|
|
|
|
C) PROVISIONS
FOR LIABILITIES AND EXPENSES |
|
|
|
|
|
|
|
D) LONG TERM
LIABILITIES |
|
|
|
|
|
|
|
E) SHORT TERM
LIABILITIES |
3.761.661,17 |
45,53 |
3.196.248,21 |
41,12 |
3.983.198,74 |
43,48 |
|
F) SHORT TERM
PROVISIONS FOR LIABILITIES AND EXPENSES |
|
|
|
|
|
|
|
LIABILITIES (A +
B + C + D + E + F) |
8.262.382,76 |
|
7.772.907,00 |
|
9.161.661,10 |
|
Financial Balance
Composition
Comments on Financial Balance
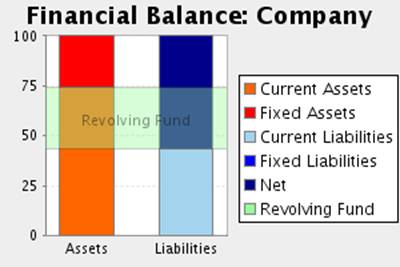
In the 2004, the assets of the company were formed in 24,33% of Fixed
Assets and in 75,67% of Current Assets.This assets were financed in 54,47% with
own capitals and in 45,53% with current liabilities.
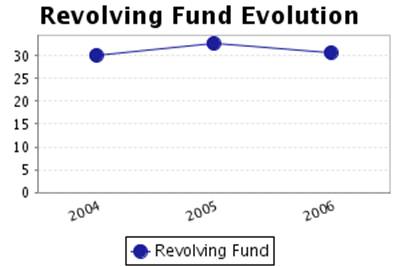
The result of this financial structure is a positive turnover fund of
2.490.089,25 Euros, which is equivalent to 30,14% proportion of the
company’s total assets.
In the 2005, the assets of the company were formed in 26,14% of Fixed
Assets and in 73,86% of Current Assets.This assets were financed in 58,88% with
own capitals and in 41,12% with current liabilities.
The result of this financial structure is a positive turnover fund of
2.545.063,92 Euros, which is equivalent to 32,74% proportion of the
company’s total assets.
In the 2006, the assets of the company were formed in 25,80% of Fixed
Assets and in 74,20% of Current Assets.This assets were financed in 56,52% with
own capitals and in 43,48% with current liabilities.
The result of this financial structure is a positive turnover fund of
2.815.077,11 Euros, which is equivalent to 30,73% proportion of the
company’s total assets.
RATIOS
Main Ratios
|
|
31/12/2004 (12) |
30/04/2005 (4) |
30/04/2006 (12) |
|
STRUCTURAL RATIOS |
|
|
|
|
Management fund |
2.490.089,25 |
2.545.063,92 |
2.815.077,11 |
|
Management Fund Requirement |
4.128.485,28 |
4.443.883,17 |
4.621.195,49 |
|
Indebtedness (%) |
45,53 |
41,12 |
43,48 |
|
External Funds on Net Worth |
0,84 |
0,70 |
0,77 |
|
GENERAL ACTIVITY RATIO |
|
|
|
|
Turnover Increase (%) |
24,75 |
|
|
|
Added value growth (%) |
-11,33 |
|
|
|
Cash Flow |
542.261,30 |
221.668,90 |
988.830,38 |
|
Labour Productivity |
1,72 |
1,57 |
2,19 |
|
Assets turnover |
1,31 |
0,53 |
1,35 |
|
Breakdown Point |
10.079.376,52 |
3.852.564,06 |
9.629.356,09 |
|
Security Margin of the Breakdown Point (%) |
7,77 |
6,69 |
22,47 |
|
ACTIVITY RATIOS |
|
|
|
|
Average Payment Period |
54 |
106 |
49 |
|
Average Collection Period |
102 |
284 |
95 |
|
Inventory Turnover Period |
79 |
199 |
89 |
|
SOLVENCY RATIOS |
|
|
|
|
Payback Capacity |
0,14 |
0,07 |
0,25 |
|
Assets Guarantee |
2,19 |
2,43 |
2,30 |
|
Short Term Debts Proportion (%) |
100,00 |
100,00 |
100,00 |
|
Interest Coverage |
3,83 |
5,80 |
11,66 |
|
LIQUIDITY RATIOS |
|
|
|
|
Current Ratio |
1,66 |
1,80 |
1,71 |
|
Immediate liquidity |
0,21 |
0,08 |
0,12 |
|
Treasury |
-1.638.396,03 |
-1.898.819,25 |
-1.806.118,38 |
|
Sales on Current Assets |
625 |
257 |
654 |
RESULTS ANALYSIS
RATIOS
|
|
31/12/2004 (12) |
30/04/2005 (4) |
30/04/2006 (12) |
|
Economic profitability (%) |
3,05 |
0,94 |
10,78 |
|
Operating Profitability (%) |
2,32 |
1,78 |
7,99 |
|
Equity gearing |
0,42 |
2,23 |
1,41 |
|
Financial profitability (%) |
2,96 |
1,99 |
12,50 |
|
General Profitability (%) |
1,23 |
2,22 |
5,24 |
SECTORIAL ANÁLYSIS
Large Capital Amounts and Financial Balance
Figures given in %
|
|
COMPANY (2006) |
SECTOR |
DIFFERENCE |
DIFFERENCE RELATIVE |
|
|
|
|
|
|
ASSETS |
|
|
|
|
|
|
|
|
|
|
A) DUE FROM
SHAREHOLDERS FOR UNCALLED CAPITAL |
|
0,02 |
|
|
|
|
|
|
|
|
B) FIXED ASSETS |
25,80 |
42,10 |
-16,30 |
-38,71 |
|
|
|
|
|
|
C) DEFERRED
EXPENSES |
|
0,16 |
|
|
|
|
|
|
|
|
D) CURRENT ASSETS |
74,20 |
57,73 |
16,47 |
28,52 |
|
|
|
|
|
|
ASSETS (A + B + C + D) |
100 |
100 |
|
|
|
|
|
|
|
|
|
|
|
|
|
|
|
|
|
|
|
|
COMPANY (2006) |
SECTOR |
DIFFERENCE |
DIFFERENCE RELATIVE |
|
|
|
|
|
|
LIABILITIES |
|
|
|
|
|
|
|
|
|
|
A) SHAREHOLDERS
EQUITY |
55,92 |
38,10 |
17,82 |
46,78 |
|
|
|
|
|
|
B) DEFERRED
INCOME |
0,60 |
3,74 |
-3,14 |
-83,95 |
|
|
|
|
|
|
C) PROVISIONS
FOR LIABILITIES AND EXPENSES |
|
0,18 |
|
|
|
|
|
|
|
|
D) LONG TERM
LIABILITIES |
|
11,20 |
|
|
|
|
|
|
|
|
E) SHORT TERM
LIABILITIES |
43,48 |
46,78 |
-3,30 |
-7,05 |
|
|
|
|
|
|
F) SHORT TERM
PROVISIONS FOR LIABILITIES AND EXPENSES |
|
0,00 |
|
|
|
|
|
|
|
|
LIABILITIES (A +
B + C + D + E + F) |
100 |
100 |
|
|
|
|
|
|
|
Sectorial Financial
Balance Comparison
Comments to the Sectorial Analysis
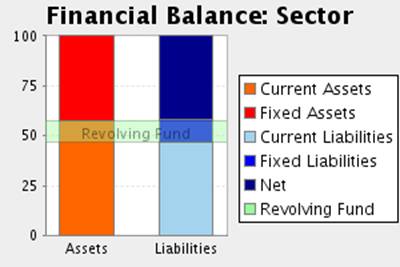
In the 2006, the assets of the company were formed in 25,80% of fixed assets
and in 74,20Current Assets % In the sector, the proportion of fixed assets was
of 42,27%, 38,96% superior, and the proportion of current assets was of 57,73%,
28,52% inferior.
The assets were financed in the company in 56,52% with own capitals and
in 43,48% with current liabilities In the sector, the self financing
represented 41,84%, 35,10% inferior. On the other hand the long term debts
represented in the sector an average of 46,78% financing, with a relative
difference of 7,05% favourable to the sector
The result of this company’s financial structure is a turnover fund that
represents 30,73% of the total assets; in the sector, this same proportion is
10,95%, therefore, we can say that the company’s turnover fund is 180,54%
higher than the one in of the sector.
Analytical Account of Results
Figures given in %
|
|
COMPANY (2006) |
SECTOR |
DIFFERENCE |
DIFFERENCE RELATIVE |
|
Turnover |
99,48 |
99,11 |
0,37 |
0,37 |
|
Other operating income |
0,52 |
0,89 |
-0,37 |
-41,38 |
|
Production Value |
100,00 |
100,00 |
0,00 |
0,00 |
|
Operating expenses |
64,63 |
63,29 |
1,34 |
2,12 |
|
Other operation expenses |
15,67 |
16,58 |
-0,91 |
-5,50 |
|
Added value |
19,70 |
20,13 |
-0,43 |
-2,14 |
|
Labour cost |
9,00 |
12,47 |
-3,47 |
-27,80 |
|
Gross Economic Result |
10,70 |
7,66 |
3,04 |
39,61 |
|
Assets depreciation |
2,75 |
4,23 |
-1,48 |
-35,02 |
|
Variation in provision for current assets and bad debt losses |
0,00 |
0,02 |
-0,02 |
-100,00 |
|
Net Economic Result |
7,95 |
3,41 |
4,54 |
133,07 |
|
Financial income |
1,05 |
0,49 |
0,56 |
116,05 |
|
Financial Charges |
2,65 |
1,57 |
1,08 |
68,79 |
|
Variation in financial investment provision |
|
0,04 |
|
|
|
Ordinary
Activities Result |
6,35 |
2,29 |
4,06 |
177,53 |
|
Extraordinary income |
0,36 |
1,58 |
-1,22 |
-77,17 |
|
Extraordinary charges |
1,45 |
0,45 |
1,00 |
221,51 |
|
Variation in provision in fixed assets |
|
-0,02 |
|
|
|
Results before Taxes |
5,27 |
3,43 |
1,84 |
53,51 |
|
Corporate taxes |
0,06 |
0,92 |
-0,86 |
-93,48 |
|
Net Result |
5,21 |
2,51 |
2,70 |
107,40 |
|
Assets depreciation |
2,75 |
4,23 |
-1,48 |
-35,02 |
|
Change of Provisions |
0,00 |
0,04 |
-0,04 |
-100,00 |
|
Net Self-Financing |
7,96 |
6,79 |
1,17 |
17,30 |
Main Ratios
|
|
COMPANY (2006) |
PTILE25 |
PTILE50 |
PTILE75 |
|
STRUCTURAL RATIOS |
|
|
|
|
|
Management fund |
2.815.077,11 |
220,14 |
1.184,34 |
3.730,64 |
|
Management Fund Requirement |
4.621.195,49 |
-4.177,43 |
-1.937,72 |
222,16 |
|
Indebtedness (%) |
43,48 |
44,60 |
60,02 |
72,47 |
|
External Funds on Net Worth |
0,77 |
0,80 |
1,50 |
2,63 |
|
GENERAL ACTIVITY
RATIO |
|
|
|
|
|
Cash Flow |
988.830,38 |
459,18 |
851,52 |
1.503,65 |
|
Labour Productivity |
2,19 |
1,38 |
1,58 |
2,00 |
|
Assets turnover |
1,35 |
0,72 |
1,04 |
1,32 |
|
Breakdown Point |
9.629.356,09 |
8.607.486,06 |
12.156.305,75 |
17.543.288,90 |
|
Security Margin
of the Breakdown Point (%) |
22,47 |
4,59 |
9,68 |
15,31 |
|
ACTIVITY RATIOS |
|
|
|
|
|
Average Payment Period |
49 |
72 |
107 |
155 |
|
Average Collection Period |
95 |
72 |
99 |
119 |
|
Inventory Turnover Period |
89 |
44 |
101 |
157 |
|
SOLVENCY RATIOS |
|
|
|
|
|
Payback Capacity |
0,25 |
0,06 |
0,10 |
0,18 |
|
Assets Guarantee |
2,30 |
1,38 |
1,66 |
2,18 |
|
Short Term Debts Proportion (%) |
100,00 |
76,60 |
88,24 |
93,73 |
|
Interest Coverage |
11,66 |
1,72 |
3,58 |
8,26 |
|
LIQUIDITY RATIOS |
|
|
|
|
|
Current Ratio |
1,71 |
1,02 |
1,20 |
1,59 |
|
Immediate liquidity |
0,12 |
0,01 |
0,04 |
0,11 |
|
Treasury |
-1.806.118,38 |
-3.803,73 |
-2.550,90 |
-599,43 |
|
Sales on Current Assets |
654 |
443 |
615 |
777 |
Results Analysis
Ratios
|
|
COMPANY (2006) |
PTILE25 |
PTILE50 |
PTILE75 |
|
Economic profitability (%) |
10,78 |
1,49 |
3,13 |
6,78 |
|
Operating Profitability (%) |
7,99 |
1,62 |
3,29 |
6,15 |
|
Equity gearing |
1,41 |
1,20 |
1,76 |
2,31 |
|
Financial profitability (%) |
12,50 |
2,73 |
6,12 |
12,13 |
|
General Profitability (%) |
5,24 |
0,87 |
2,04 |
4,29 |
NOTES
In answer to your request of a Financial
Report on the above-mentioned company,
we inform you that the requested product cannot be processed as the necessary
accounts haven’t been published yet.
Last Accounts published in Borme are those from the exercise: 2006.
FOREIGN EXCHANGE RATES
|
Currency |
Unit
|
Indian Rupees |
|
US Dollar |
1 |
Rs.49.97 |
|
|
1 |
Rs.75.45 |
|
Euro |
1 |
Rs.64.21 |
RATING EXPLANATIONS
|
RATING |
STATUS |
PROPOSED CREDIT LINE |
|
|
>86 |
Aaa |
Possesses an extremely sound financial base with the strongest
capability for timely payment of interest and principal sums |
Unlimited |
|
71-85 |
Aa |
Possesses adequate working capital. No caution needed for credit transaction.
It has above average (strong) capability for payment of interest and
principal sums |
Large |
|
56-70 |
A |
Financial & operational base are regarded healthy. General unfavourable
factors will not cause fatal effect. Satisfactory capability for payment of
interest and principal sums |
Fairly Large |
|
41-55 |
Ba |
Overall operation is considered normal. Capable to meet normal
commitments. |
Satisfactory |
|
26-40 |
B |
Unfavourable & favourable factors carry similar weight in credit
consideration. Capability to overcome financial difficulties seems
comparatively below average. |
Small |
|
11-25 |
Ca |
Adverse factors are apparent. Repayment of interest and principal sums
in default or expected to be in default upon maturity |
Limited with
full security |
|
<10 |
C |
Absolute credit risk exists. Caution needed to be exercised |
Credit not
recommended |
|
NR |
In view of the lack of information, we have no basis upon which to
recommend credit dealings |
No Rating |
|
This score serves as a reference to assess SC’s credit risk
and to set the amount of credit to be extended. It is calculated from a composite
of weighted scores obtained from each of the major sections of this report. The
assessed factors and their relative weights (as indicated through %) are as
follows:
Financial
condition (40%) Ownership
background (20%) Payment
record (10%)
Credit history
(10%) Market trend
(10%) Operational
size (10%)