![]()
MIRA
INFORM REPORT
|
Report Date : |
03.10.2008 |
IDENTIFICATION
DETAILS
|
Name : |
YAMBO IMPORT S.L. |
|
|
|
|
Registered Office : |
Paseo Del
Faro, 71, Cp 20008, Donostia-San Sebastian Guipúzcoa |
|
|
|
|
Country : |
Spain |
|
|
|
|
Financials (as on) : |
31.12.2007 |
|
|
|
|
Date of Incorporation : |
|
|
|
|
|
Legal Form : |
Limited Liability Company |
|
|
|
|
Line of Business : |
RATING &
COMMENTS
|
MIRA’s Rating : |
Ba |
|
RATING |
STATUS |
PROPOSED CREDIT LINE |
|
|
41-55 |
Ba |
Overall operation is considered normal. Capable to meet normal
commitments. |
Satisfactory |
|
Maximum Credit Limit : |
261.999,21 € |
|
|
|
|
Status : |
Good |
|
|
|
|
Payment Behaviour : |
Regular |
|
|
|
|
Litigation : |
Clear |
FINANCIAL REPORT
YAMBO IMPORT S.L.
TAX NUMBER: B20431797
EXECUTIVE SUMMARY
Identification
Current Business Name: YAMBO IMPORT S.L.
Other names: NO
Current Address: PASEO DEL
FARO, 71, CP 20008, DONOSTIA-SAN SEBASTIAN GUIPÚZCOA
Telephone number: 943311130 Fax: 943311130
Corporate e-mail: yambo@yambo.e.telefonica.net
Commercial Risk
Credit Appraisal: 261.999,21 €
RAI: NO
Legal Actions: NO
Financial
Information
Latest Balance sheet sales (2007): 1.739.973,64 € (MERCANTILE REGISTER)
Result: 42.044,86 €
Total Assets: 722.267,32 €
Social Capital: 9.015,18 €
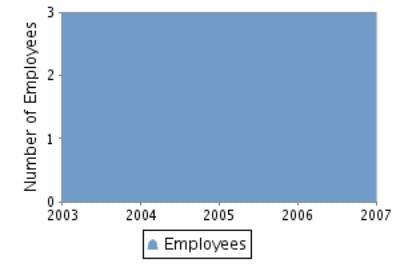
Employees: 3
Commercial Information
Constitution Date: 11/11/1992
Business activity: Wholesale of
clothing (outerwear)
NACE Code: 5142
International Operations: No business
relationships registered
Corporate Structure
Sole Administrator:
DE VILLAR DE
LOS SANTOS MARIA CRISTINA
Parent Company:
Other Complementary Information
Latest proceeding published in BORME: 14/07/2008 Registration
of accounts
Bank Entities: Yes
Credit Appraisal
Maximum Credit
(from 0 a 6,000,000 €)
Favourable to 261.999,21 €
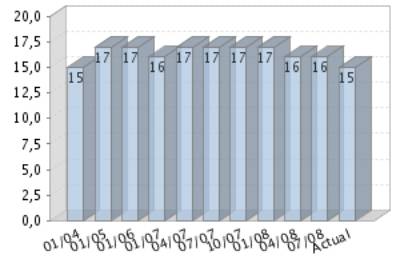
Rating Evolution
Financial Situation
Fiscal year2007
|
Treasury |
Excellent |
|
Indebtedness |
Nil |
|
Profitability |
Average |
|
Balance |
Excellent |
Performance
|
Legal Actions |
None or Negligible |
|
Business
Trajectory |
Excellent |
COMPANY NOT REGISTERED IN THE R.A.I.
This company is not registered in the Disputed Bills register (R.A.I.)
DATE AND TIME OF THE CONSULTATION: 26/09/2008
08:09:08
INCIDENTS

Summary
LEGAL ACTIONS: No legal incidences registered
CLAIM FILED AGAINST THE ADMINISTRATION: No administrative
claims registered
AFFECTED BY: No significant element.
FINANCIAL ELEMENTS AND SECTORIAL
COMPARATIVE
FINANCIAL ELEMENTS
Figures given in €
|
|
2005 (12) |
2006 (12) |
2007 (12) |
% ASSETS |
|
|
|
|
|
|
BALANCE SHEET
ANALYSIS |
|
|
|
|
|
|
|
|
|
|
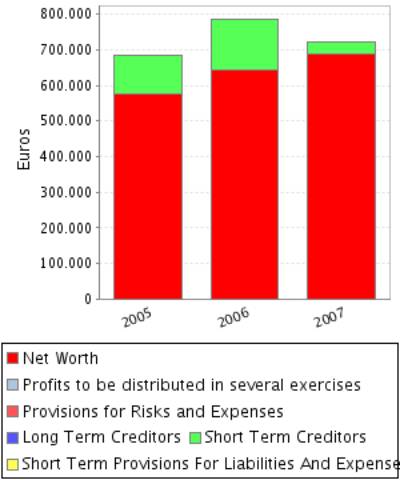
OWN FUNDS |
575.613,86 |
644.347,27 |
686.392,13 |
95,03 |
|
|
|
|
|
|
DEBT |
106.888,09 |
141.085,75 |
35.875,19 |
4,97 |
|
|
|
|
|
|
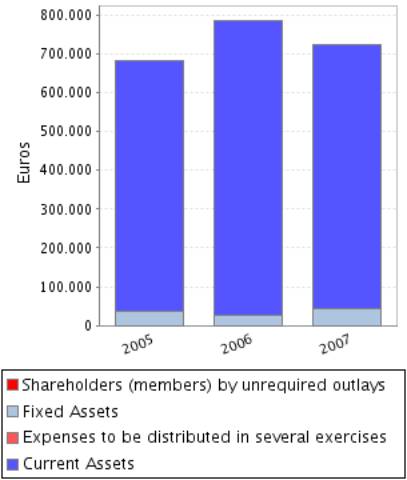
FIXED ASSETS |
37.916,27 |
27.786,90 |
43.374,27 |
6,01 |
|
|
|
|
|
|
TOTAL ASSETS |
682.501,95 |
785.433,02 |
722.267,32 |
|
|
|
|
|
|
|
|
|
|
|
|
|
|
|
|
|
|
|
2005 (12) |
2006 (12) |
2007 (12) |
% SALES |
|
|
|
|
|
|
PROFIT AND LOSS
ACCOUNT ANALYSIS |
|
|
|
|
|
|
|
|
|
|
SALES |
1.905.715,09 |
2.331.844,49 |
1.739.973,64 |
|
|
|
|
|
|
|
ADDED VALUE |
311.706,68 |
313.437,37 |
259.979,89 |
14,94 |
|
|
|
|
|
|
EBITDA |
126.745,50 |
128.318,87 |
73.373,01 |
4,22 |
|
|
|
|
|
|
EBIT |
104.942,49 |
112.180,05 |
62.561,38 |
3,60 |
|
|
|
|
|
|
NET RESULT |
63.599,78 |
68.733,41 |
42.044,86 |
2,42 |
|
|
|
|
|
Balance Sheets Items
Analysis
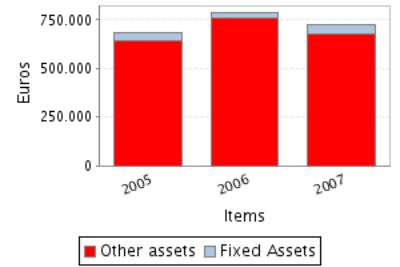
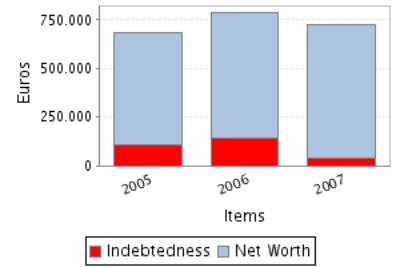
Balance Sheet Comments
Total assets of the company grew 15,08% between 2005 and 2006.
In spite of the assets’ growth, the fixed assets decreased 26,72%.
This growth has been mainly financed with a debt increase of 31,99%.
Nevertheless the net worth increased 11,94%.
Total assets of the company decreased in 8,04% between 2006 and 2007.
In spite of the decrease in the amount of total assets, fixed assets
grew 56,10%.
Assets reduction contrasts with net worth growth of 6,53%. Therefore,
the company’s indebtedness has reduced in 74,57%.
Profit and Loss Account Analysis
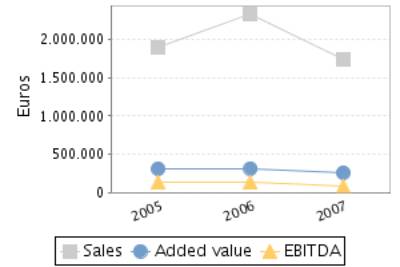

Profit and Loss Account Comments
The company’s sales figure grew 22,36% between 2005 and 2006.
The company’s EBIT grew 6,90% between 2005 and 2006.
This evolution implies a reduction in the company’s operating
profitability.
The result of these variations is a decrease of the company’s Economic
Profitability of 7,11% in the analysed period, being this profitability of
14,28% in the year 2006.
The company’s Net Result grew 8,07% between 2005 and 2006.
This evolution, compared to the EBIT’s performance, implies that the
financial and extraordinary activities have had a positive effect in the
company’s Financial Profitability.
The result of these variations is a reduction of the company’s
profitability of 3,46% in the analysed period, being equal to 10,67% in the
year 2006.
The company’s sales figure decreased in 25,38% between 2006 and 2007.
The company’s EBIT decreased in 44,23% between 2006 and 2007.
This evolution implies a reduction in the company’s operating
profitability.
The result of these variations is a decrease of the company’s Economic
Profitability of 39,35% in the analysed period, being this profitability of
8,66% in the year 2007.
The company’s Net Result decreased in 38,83% between 2006 and 2007.
This evolution, compared to the EBIT’s performance, implies that the
financial and extraordinary activities have had a positive effect in the
company’s Financial Profitability.
The result of these variations is a reduction of the company’s
profitability of 42,58% in the analysed period, being equal to 6,13% in the
year 2007.
ANNUAL FINANCIAL REPORT
ADDITIONAL DATA
Source: annual financial report 1999
Results Distribution
Figures given in €
|
DISTRIBUTION
BASE |
DISTRIBUTION TO |
||
|
Profit and Loss |
68.383,16 |
Retained earnings |
0,00 |
|
Carry Over |
0,00 |
Voluntary Reserve |
68.383,16 |
|
Voluntary reserves |
0,00 |
Prior years losses |
0,00 |
|
Reserves |
0,00 |
Carry Over |
0,00 |
|
Other concepts |
0,00 |
Other funds |
0,00 |
|
Total of Amounts to be distributed |
68.383,16 |
Dividends |
0,00 |
|
|
|
Other Applications |
0,00 |
COMPARATIVE SECTOR ANALYSIS
Values table
Figures expressed in %
|
|
COMPANY (2007) |
SECTOR |
DIFFERENCE |
DIFFERENCE RELATIVE |
|
|
|
|
|
|
BALANCE SHEET
ANALYSIS: % on the total assets |
|
|
|
|
|
|
|
|
|
|
OWN FUNDS |
95,03 |
37,47 |
57,56 |
153,60 |
|
|
|
|
|
|
DEBT |
4,97 |
62,53 |
-57,56 |
-92,06 |
|
|
|
|
|
|
FIXED ASSETS |
6,01 |
27,90 |
-21,90 |
-78,48 |
|
|
|
|
|
|
|
|
|
|
|
|
|
|
|
|
|
|
COMPANY (2007) |
SECTOR |
DIFFERENCE |
DIFFERENCE RELATIVE |
|
|
|
|
|
|
PROFIT AND LOSS
ACCOUNT ANALYSIS: % on the total operating income |
|
|
|
|
|
|
|
|
|
|
SALES |
100,00 |
98,82 |
1,18 |
1,20 |
|
|
|
|
|
|
ADDED VALUE |
14,94 |
20,05 |
-5,11 |
-25,48 |
|
|
|
|
|
|
EBIT |
3,60 |
3,61 |
-0,01 |
-0,40 |
|
|
|
|
|
|
NET RESULT |
2,42 |
2,18 |
0,24 |
10,90 |
|
|
|
|
|
Sector Composition
Compared sector (NACE): 514
Number of companies: 3917
Size (Sales Figure) : 0 - 2.800.000,00
Euros
Comments on the sectorial comparative
Compared to its sector the assets of the companies show an inferior
proportion of fixed assets. Specifically the difference with the sector average
is -21,90% , which means a relative difference of -78,48% .
In liabilities composition the company appeals on a wider scale to self
financing, being the proportion of net worth of 57,56% superior, which means a
relative difference of 153,60% . As a consequence, external financing sources
are less used by the company in 57,56% less than the sector, which means a difference
of 92,06% .
The proportion that the sales mean to the company’s total ordinary
income is 100,00%, 1,18% higher than in the sector, which means a relative
difference of 1,20% .
The company’s EBIT was positive and was 3,60% with regard to the total
ordinary income, 0,01% less than the sector, which means a relative difference
of 0,40% .
The company’s capacity to generate operating income is equal to that of
the sector as its ratio EBIT/Sales is also equal.
The company’s net result was positive and equal to 2,42% with regard to
the total ordinary income, 0,24% higher than in the sector, which means a
relative difference of 10,90% .
The financial and extraordinary results and the tax impact have had a
less negative impact on the Net result in the company than in the sector; as a
consequence, the company shows a better Net Result/EBIT ratio (REBEmpresa vs.
REBSector).
ADDRESSES
Current Legal Seat Address:
PASEO DEL FARO, 71
20008
DONOSTIA-SAN SEBASTIAN GUIPÚZCOA
Characteristics of the current address
Type of premises: office
Property: owned; with
no official confirmation
Local Situation: main
CORPORATE STRUCTURE
ADMINISTRATIVE LINKS
Main Board members, Directors and Auditor ![]()
|
POSITION |
SURNAMES AND
NAME |
APPOINTMENT DATE |
|
SOLE ADMINISTRATOR |
DE VILLAR DE LOS SANTOS MARIA CRISTINA |
18/05/1998 |
Functional Managers
|
POSITION |
SURNAMES AND
NAME |
|
General Manager |
VILLAR SANTOS MARIA CRISTINA |
|
Financial Manager |
DOMINGUEZ MACAYA NATALIA |
FINANCIAL LINKS
|
|
BUSINESS NAME |
CIF / COUNTRY |
% |
SOURCE |
DATA INF. |
|
|
VILLAR SANTOS
MARIA CRISTINA |
|
100,00 |
OWN SOURCES |
17/07/2008 |
CREDIT INFORMATION
Constitution Date: 11/11/1992
Activity: Wholesale of clothing (outerwear)
NACE Code: 5142
NACE Activity: Wholesale of
clothing and footwear
Business: COMERCIO AL POR MAYOR DEL SECTOR TEXTIL.
Activity description: COMERCIO AL POR MAYOR
Y MENOR DE PRENDAS DE VESTIR PARA SENORA
Number of total employees: 3 (2008)
Number of fixed employees: 100,00%
Number of temporary employees: 0,00%
Employees evolution
Banks 
|
ENTITY |
BRANCH |
ADDRESS |
TOWN OR CITY |
PROVINCE |
|
BANCO DE SABADELL, S.A. |
|
|
DONOSTIA SAN SEBASTIAN |
|
|
BANCO BILBAO VIZCAYA ARGENTARIA, S.A. |
|
|
SAN SEBASTIAN |
|
|
BANCO DE SABADELL, S.A. |
|
|
SAN SEBASTIAN |
|
|
BANKOA, S.A. |
|
|
SAN SEBASTIAN |
|
4 bank entities registered
LEGAL STRUCTURE
Constitution Data
Register Date: 11/11/1992
Register town: Guipúzcoa
Announcement number: 11657
Legal form: LIMITED LIABILITY
COMPANY
Social Capital: 9.015,18 €
Current Legal Form: LIMITED LIABILITY
COMPANY
Current Capital: 9.015,18 €
Legal Aspects
Obligation to fill in Financial
Statements: YES
Chamber census: YES (2005)
Listed on a Stock Exchange: NO
B.O.R.M.E.(Official Companies Registry Gazette) ![]()
Other Proceedings published
|
PROCEEDINGS |
DATE |
NOTICE NUM. |
TRADE REG. |
|
Registration of
accounts (2007) Individual |
14/07/2008 |
200317 |
Guipúzcoa |
|
Registration of
accounts (2006) Individual |
02/10/2007 |
704554 |
Guipúzcoa |
|
Registration of
accounts (2005) Individual |
19/10/2006 |
787016 |
Guipúzcoa |
|
Registration of
accounts (2004) Individual |
17/08/2005 |
224377 |
Guipúzcoa |
|
Registration of
accounts (2003) Individual |
16/09/2004 |
416866 |
Guipúzcoa |
FINANCIAL INFORMATION
The information on the last account contained in this report is
extracted from the Mercantile Register file of the legal address of the Company
and dated 20/08/2008.
BALANCE SHEET
Assets
Figures given in €
|
|
31/12/2005 (12) |
31/12/2006 (12) |
31/12/2007 (12) |
|
A) DUE FROM SHAREHOLDERS FOR UNCALLED CAPITAL |
|
|
|
|
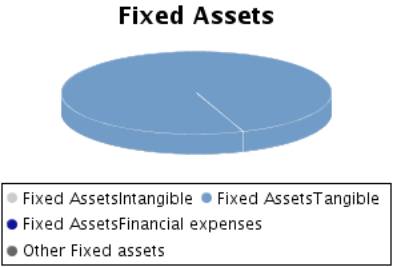
B) FIXED ASSETS |
37.916,27 |
27.786,90 |
43.374,27 |
|
I. Incorporation costs |
|
|
|
|
II. Intangible fixed assets |
|
|
|
|
III. Tangible fixed assets |
37.916,27 |
27.786,90 |
43.374,27 |
|
IV. Financial fixed assets |
|
|
|
|
V.Owners equity |
|
|
|
|
VI.Long term trade liabilities |
|
|
|
|
C) DEFERRED EXPENSES |
|
|
|
|
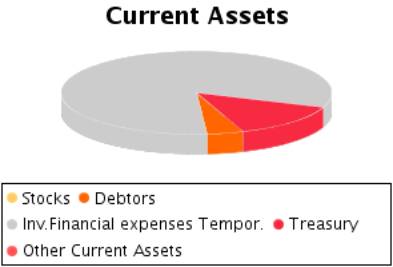
D) CURRENT ASSETS |
644.585,68 |
757.646,12 |
678.893,05 |
|
I. Shareholders by required outlays |
|
|
|
|
II. Stocks |
|
|
|
|
III. Debtors |
304.594,76 |
211.788,34 |
29.247,67 |
|
IV. Temporary financial investment |
323.687,65 |
470.627,47 |
556.000,00 |
|
V. Short-term own shares |
|
|
|
|
VI. Treasury |
16.303,27 |
75.230,31 |
93.645,38 |
|
VII. Periodification adjustments |
|
|
|
|
ASSETS (A + B + C + D) |
682.501,95 |
785.433,02 |
722.267,32 |
Assets composition
Liabilities
Figures given in €
|
|
31/12/2005 (12) |
31/12/2006 (12) |
31/12/2007 (12) |
|
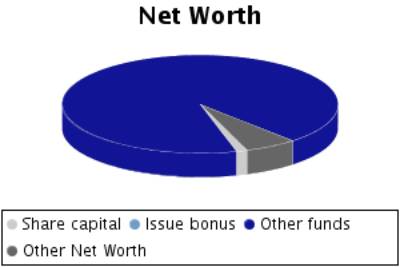
A) SHAREHOLDERS EQUITY |
575.613,86 |
644.347,27 |
686.392,13 |
|
I. Share capital |
9.015,18 |
9.015,18 |
9.015,18 |
|
II. Issue bonus |
|
|
|
|
III.Revaluation reserve |
|
|
|
|
IV.Reserves |
502.998,90 |
566.598,68 |
635.332,09 |
|
Capital adjustments in Euros |
|
|
|
|
Sundry reserves |
502.998,90 |
566.598,68 |
635.332,09 |
|
V.Results from previous years |
|
|
|
|
VI.Profit and Losses |
63.599,78 |
68.733,41 |
42.044,86 |
|
VII.Dividend paid during the year |
|
|
|
|
VIII.Own shares for capital reduction |
|
|
|
|
B) DEFERRED INCOME |
|
|
|
|
C) PROVISIONS FOR LIABILITIES AND EXPENSES |
|
|
|
|
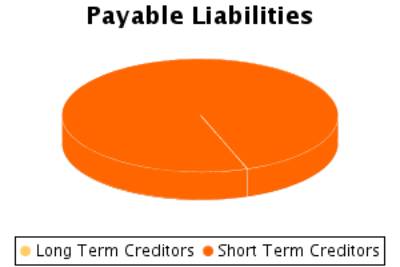
D) LONG TERM LIABILITIES |
|
|
|
|
E) SHORT TERM LIABILITIES |
106.888,09 |
141.085,75 |
35.875,19 |
|
F) SHORT TERM PROVISIONS FOR LIABILITIES AND
EXPENSES |
|
|
|
|
LIABILITIES (A + B + C + D + E + F) |
682.501,95 |
785.433,02 |
722.267,32 |
Liabilities
Composition
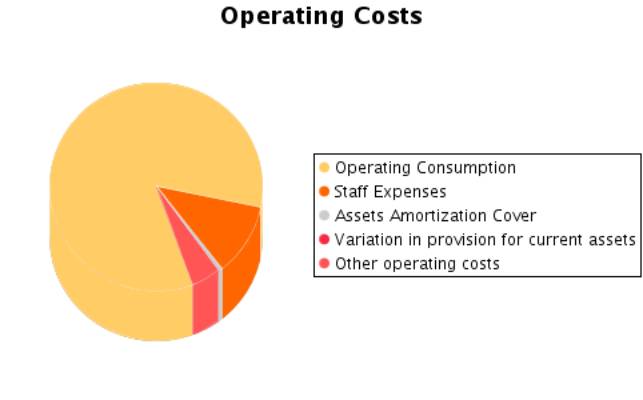
PROFIT AND LOSS ACCOUNT
Itams of the Profit and Loss Account
Figures given in €
|
|
31/12/2005 (12) |
31/12/2006 (12) |
31/12/2007 (12) |
|
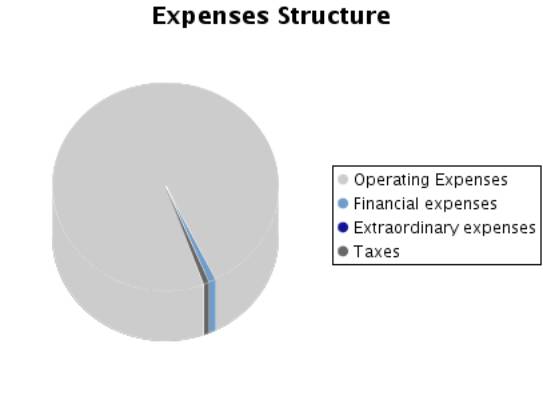
A) EXPENSES (A.1 a A.15) |
1.855.314,24 |
2.269.242,50 |
1.707.395,27 |
|
A.1.Operating costs |
1.455.997,15 |
1.851.241,05 |
1.405.207,45 |
|
A.2. Labour cost |
184.961,18 |
185.118,50 |
186.606,88 |
|
Wages |
171.659,78 |
171.909,50 |
172.648,54 |
|
Social security expenses |
13.301,40 |
13.209,00 |
13.958,34 |
|
A.3. Assets depreciation |
10.581,31 |
10.731,96 |
10.811,63 |
|
A.4. Variation in provision for current assets |
11.221,70 |
5.406,86 |
|
|
A.5. Other operating costs |
147.907,52 |
167.596,72 |
74.786,30 |
|
A.I. OPERATING RESULT (B.1-A.1-A.2-A.3-A.4-A.5) |
104.942,49 |
112.180,05 |
62.561,38 |
|
A.6.Financial expenses and similar |
17.435,27 |
19.737,17 |
16.551,84 |
|
Debts with related companies |
|
|
|
|
Debts with associated companies |
|
|
|
|
Other companies debts By debts with third parties and similar expenses |
17.435,27 |
19.737,17 |
16.551,84 |
|
Losses from financial investments |
|
|
|
|
A.7. Variation in financial investment provision |
|
|
|
|
A.8.Negative exchange difference |
|
|
|
|
A.II.POSITIVE FINANCIAL RESULTS
(B.2+B.3-A.6-A.7-A.8) |
|
|
|
|
A.III.PROFIT
FROM ORDINARY ACTIVITIES (A.I+A.II-B.I-B.II) |
90.809,89 |
98.143,65 |
55.476,03 |
|
A.9. Variation
in provision in fixed assets |
|
|
|
|
A.10. Losses in
fixed assets |
|
|
|
|
A.11. Losses from own shares and bonds |
|
|
|
|
A.12. Extraordinary charges |
|
|
199,82 |
|
A.13.Other exercises’ expenses and losses |
|
|
|
|
A.IV.POSITIVE EXTRAORDINARY RESULT
(B.4+B.5+B.6+B.7+B.8-A.9-A.10-A.11-A.12-A.13) |
|
|
|
|
A.V.PROFIT BEFORE TAXES (A.III+A.IV-B.III-B.IV) |
90.809,89 |
98.143,65 |
55.276,21 |
|
A.14.Corporate Taxes |
27.210,11 |
29.410,24 |
13.231,35 |
|
A.15. Other taxes |
|
|
|
|
A.VI.EXERCISE RESULT (PROFIT) (A.V-A.14-A.15) |
63.599,78 |
68.733,41 |
42.044,86 |
|
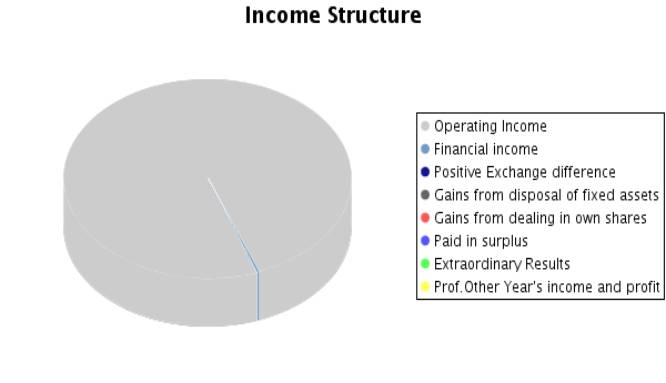
B) INCOMES (B.1 a B.8) |
1.918.914,02 |
2.337.975,91 |
1.749.440,13 |
|
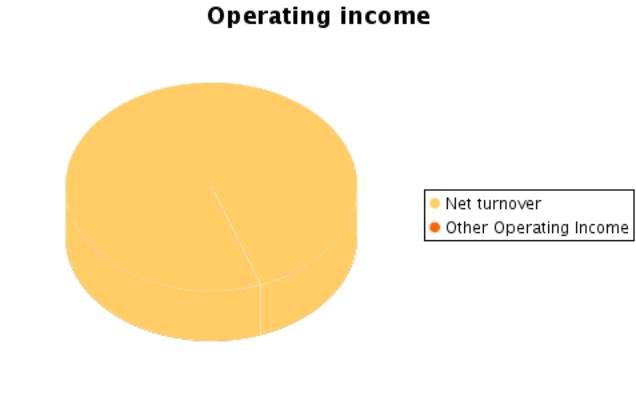
B.1.Operating income |
1.915.611,35 |
2.332.275,14 |
1.739.973,64 |
|
Turnover |
1.905.715,09 |
2.331.844,49 |
1.739.973,64 |
|
Other operating income |
9.896,26 |
430,65 |
|
|
B.I.OPERATING LOSSES (A.1+A.2+A.3+A.4+A.5-B.1) |
|
|
|
|
B.2.Financial Income |
3.302,67 |
5.256,94 |
9.466,07 |
|
From affiliated companies |
|
|
|
|
From associated companies |
|
|
|
|
Other |
3.302,67 |
5.256,94 |
9.466,07 |
|
Gains from investments |
|
|
|
|
B.3. Positive change difference |
|
443,83 |
0,42 |
|
B.II. NEGATIVE FINANCIAL RESULTS
(A.6+A.7+A.8-B.2-B.3) |
14.132,60 |
14.036,40 |
7.085,35 |
|
B.III.LOSSES FROM ORDINARY ACTIVITIES
(B.I+B.II-A.I-A.II) |
|
|
|
|
B.4.B.9. Gains from disposal of fixed assets |
|
|
|
|
B.5.Gains from dealing in own shares |
|
|
|
|
B.6. Paid in surplus |
|
|
|
|
B.7. Extraordinary income |
|
|
|
|
B.8.Other year’s income and profits |
|
|
|
|
B.IV.NEGATIVE EXTRAORDINARY LOSSES
(A.9+A.10+A.11+A.12+A.13-B.4-B.5-B.6-B.7-B.8) |
|
|
199,82 |
|
B.V.LOSS BEFORE TAXES (B.III+B.IV-A.III-A.IV) |
|
|
|
|
B.VI.EXERCISE RESULTS (LOSS) (B.V+A.14+A.15) |
|
|
|
Composition of the
Profit and Loss Account
FINANCIAL BALANCE
Here the Main Capital Amounts of the company and the Revolving Fund
Evolution are analysed.
Financial Balance Table
Figures given in €
|
|
31/12/2005 (12) |
% |
31/12/2006 (12) |
% |
31/12/2007 (12) |
% |
|
A) DUE FROM
SHAREHOLDERS FOR UNCALLED CAPITAL |
|
|
|
|
|
|
|
B) FIXED ASSETS |
37.916,27 |
5,56 |
27.786,90 |
3,54 |
43.374,27 |
6,01 |
|
C) DEFERRED
EXPENSES |
|
|
|
|
|
|
|
D) CURRENT
ASSETS |
644.585,68 |
94,44 |
757.646,12 |
96,46 |
678.893,05 |
93,99 |
|
ASSETS (A + B +
C + D) |
682.501,95 |
|
785.433,02 |
|
722.267,32 |
|
|
|
||||||
|
A) SHAREHOLDERS
EQUITY |
575.613,86 |
84,34 |
644.347,27 |
82,04 |
686.392,13 |
95,03 |
|
B) DEFERRED
INCOME |
|
|
|
|
|
|
|
C) PROVISIONS
FOR LIABILITIES AND EXPENSES |
|
|
|
|
|
|
|
D) LONG TERM
LIABILITIES |
|
|
|
|
|
|
|
E) SHORT TERM
LIABILITIES |
106.888,09 |
15,66 |
141.085,75 |
17,96 |
35.875,19 |
4,97 |
|
F) SHORT TERM
PROVISIONS FOR LIABILITIES AND EXPENSES |
|
|
|
|
|
|
|
LIABILITIES (A +
B + C + D + E + F) |
682.501,95 |
|
785.433,02 |
|
722.267,32 |
|
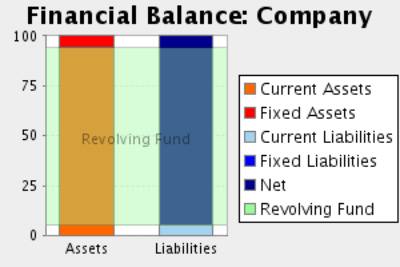
Financial Balance
Composition
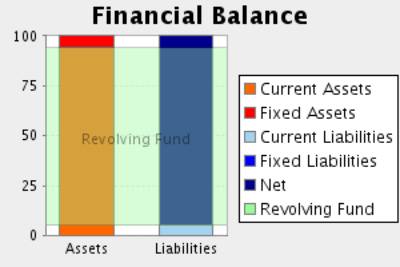
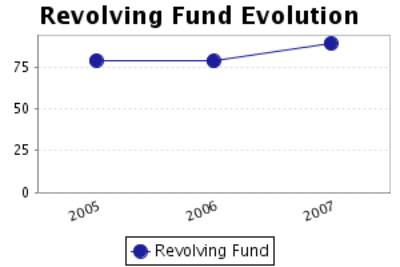
Comments on Financial Balance
In the 2005, the assets of the company were formed in 5,56% of Fixed
Assets and in 94,44% of Current Assets.This assets were financed in 84,34% with
own capitals and in 15,66% with current liabilities.
The result of this financial structure is a positive turnover fund of
537.697,59 Euros, which is equivalent to 78,78% proportion of the
company’s total assets.
In the 2006, the assets of the company were formed in 3,54% of Fixed
Assets and in 96,46% of Current Assets.This assets were financed in 82,04% with
own capitals and in 17,96% with current liabilities.
The result of this financial structure is a positive turnover fund of
616.560,37 Euros, which is equivalent to 78,50% proportion of the
company’s total assets.
This measure has increased with respect to the previous exercise in
14,67% having, however, diminished its proportion with respect to the total
assets of the company.
In the 2007, the assets of the company were formed in 6,01% of Fixed
Assets and in 93,99% of Current Assets.This assets were financed in 95,03% with
own capitals and in 4,97% with current liabilities.
The result of this financial structure is a positive turnover fund of
643.017,86 Euros, which is equivalent to 89,03% proportion of the
company’s total assets.
This measure has increased with respect to the previous exercise in
4,29% having also increased its proportion with respect to the total assets of
the company.
RATIOS
Main Ratios
|
|
31/12/2005 (12) |
31/12/2006 (12) |
31/12/2007 (12) |
|
STRUCTURAL RATIOS |
|
|
|
|
Management fund |
537.697,59 |
616.560,37 |
643.017,86 |
|
Indebtedness (%) |
15,66 |
17,96 |
4,97 |
|
External Funds on Net Worth |
0,19 |
0,22 |
0,05 |
|
GENERAL ACTIVITY RATIO |
|
|
|
|
Turnover Increase (%) |
-5,02 |
22,36 |
-25,38 |
|
Added value growth (%) |
27,83 |
0,56 |
-17,06 |
|
Cash Flow |
85.402,79 |
84.872,23 |
52.856,49 |
|
Labour Productivity |
1,68 |
1,69 |
1,39 |
|
Assets turnover |
2,79 |
2,97 |
2,41 |
|
Breakdown Point |
1.478.224,90 |
1.788.374,52 |
1.414.805,94 |
|
Security Margin of the Breakdown Point (%) |
22,83 |
23,32 |
18,69 |
|
ACTIVITY RATIOS |
|
|
|
|
Average Collection Period |
58 |
33 |
6 |
|
SOLVENCY RATIOS |
|
|
|
|
Payback Capacity |
0,80 |
0,60 |
1,47 |
|
Assets Guarantee |
6,38 |
5,57 |
20,13 |
|
Short Term Debts Proportion (%) |
100,00 |
100,00 |
100,00 |
|
Interest Coverage |
4,71 |
4,01 |
2,62 |
|
LIQUIDITY RATIOS |
|
|
|
|
Current Ratio |
6,03 |
5,37 |
18,92 |
|
Immediate liquidity |
3,18 |
3,87 |
18,11 |
|
Sales on Current Assets |
1.064 |
1.108 |
923 |
Results Analysis
Ratios
|
|
31/12/2005 (12) |
31/12/2006 (12) |
31/12/2007 (12) |
|
Economic profitability (%) |
15,38 |
14,28 |
8,66 |
|
Operating Profitability (%) |
5,51 |
4,81 |
3,60 |
|
Equity gearing |
1,03 |
1,07 |
0,93 |
|
Financial profitability (%) |
11,05 |
10,67 |
6,12 |
|
General Profitability (%) |
3,34 |
2,95 |
2,42 |
Comments on the
Results Analysis Ratios
The economic profitability in the year2006 achieved a 14,28% positive
level, due to a 4,81% economic margin and to an assets turnover of2,97%.
The economic profitability in the year has reduced from 15,38% up to
14,28% of2006, even if it remains positive. Assets turnover increase whose
index has passed from 2,79 to 2,97, could not compensate operating
profitability reduction from5,51% to the current level of 4,81%.
Financial profitability on 2006 achieved a 10,67%.
The company’s financial structure has instigated its economic
profitability with an indebtedness level of 1,07.
The general profitability on 2006 achieved a 2,95%.
The economic profitability in the year2007 achieved a 8,66% positive
level, due to a 3,60% economic margin and to an assets turnover of2,41%.
The economic profitability in the year has reduced from 14,28% up to
8,66% of2007, even if it remains positive. This fall is due to the decrease in
operating profitability, that has passe from 4,81% to 3,60%, as assets turnover
whose index has passed from 2,97 to 2,41%.
Financial profitability on 2007 achieved a 6,12%.
The company’s financial structure has limited its profitability with an
indebtedness level of 0,93.
The general profitability on 2007 achieved a 2,42%.
SECTORIAL ANÁLYSIS
Large Capital Amounts and Financial Balance
Figures given in %
|
|
COMPANY (2007) |
SECTOR |
DIFFERENCE |
DIFFERENCE RELATIVE |
|
|
|
|
|
|
ASSETS |
|
|
|
|
|
|
|
|
|
|
A) DUE FROM
SHAREHOLDERS FOR UNCALLED CAPITAL |
|
0,07 |
|
|
|
|
|
|
|
|
B) FIXED ASSETS |
6,01 |
27,90 |
-21,90 |
-78,46 |
|
|
|
|
|
|
C) DEFERRED
EXPENSES |
|
0,39 |
|
|
|
|
|
|
|
|
D) CURRENT
ASSETS |
93,99 |
71,63 |
22,36 |
31,21 |
|
|
|
|
|
|
ASSETS (A + B +
C + D) |
100 |
100 |
|
|
|
|
|
|
|
|
|
|
|
|
|
|
|
|
|
|
|
|
COMPANY (2007) |
SECTOR |
DIFFERENCE |
DIFFERENCE RELATIVE |
|
|
|
|
|
|
LIABILITIES |
|
|
|
|
|
|
|
|
|
|
A) SHAREHOLDERS
EQUITY |
95,03 |
37,11 |
57,92 |
156,10 |
|
|
|
|
|
|
B) DEFERRED INCOME |
|
0,37 |
|
|
|
|
|
|
|
|
C) PROVISIONS
FOR LIABILITIES AND EXPENSES |
|
0,10 |
|
|
|
|
|
|
|
|
D) LONG TERM
LIABILITIES |
|
13,57 |
|
|
|
|
|
|
|
|
E) SHORT TERM
LIABILITIES |
4,97 |
48,78 |
-43,81 |
-89,81 |
|
|
|
|
|
|
F) SHORT TERM
PROVISIONS FOR LIABILITIES AND EXPENSES |
|
0,08 |
|
|
|
|
|
|
|
|
LIABILITIES (A + B + C + D + E + F) |
100 |
100 |
|
|
|
|
|
|
|
Sectorial Financial
Balance Comparison
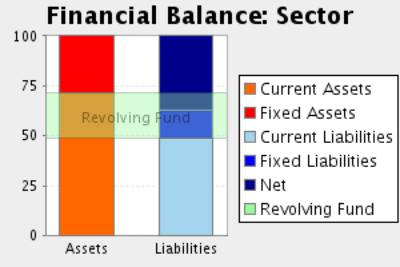
Comments to the Sectorial Analysis
In the 2007, the assets of the company were formed in 6,01% of fixed
assets and in 93,99Current Assets % In the sector, the proportion of fixed
assets was of 28,37%, 78,81% superior, and the proportion of current assets was
of 71,63%, 31,21% inferior.
The assets were financed in the company in 95,03% with own capitals and
in 4,97% with current liabilities In the sector, the self financing represented
37,47%, 153,60% inferior. On the other hand the long term debts represented in
the sector an average of 48,86% financing, with a relative difference of 89,83%
favourable to the sector
The result of this company’s financial structure is a turnover fund that
represents 89,03% of the total assets; in the sector, this same proportion is
22,78%, therefore, we can say that the company’s turnover fund is 290,89%
higher than the one in of the sector.
Analytical Account of Results
Figures given in %
|
|
COMPANY (2007) |
SECTOR |
DIFFERENCE |
DIFFERENCE RELATIVE |
|
Turnover |
100,00 |
98,82 |
1,18 |
1,20 |
|
Other operating income |
|
1,18 |
|
|
|
Production Value |
100,00 |
100,00 |
0,00 |
0,00 |
|
Operating expenses |
80,76 |
66,55 |
14,21 |
21,35 |
|
Other operation expenses |
4,30 |
13,40 |
-9,10 |
-67,90 |
|
Added value |
14,94 |
20,05 |
-5,11 |
-25,49 |
|
Labour cost |
10,72 |
14,67 |
-3,95 |
-26,94 |
|
Gross Economic Result |
4,22 |
5,38 |
-1,16 |
-21,52 |
|
Assets depreciation |
0,62 |
1,58 |
-0,96 |
-60,78 |
|
Variation in provision for current assets and bad debt losses |
|
0,18 |
|
|
|
Net Economic Result |
3,60 |
3,61 |
-0,01 |
-0,28 |
|
Financial income |
0,54 |
0,37 |
0,17 |
44,77 |
|
Financial Charges |
0,95 |
1,40 |
-0,45 |
-32,05 |
|
Variation in financial investment provision |
|
0,00 |
|
|
|
Ordinary
Activities Result |
3,19 |
2,58 |
0,61 |
23,45 |
|
Extraordinary income |
|
0,65 |
|
|
|
Extraordinary charges |
0,01 |
0,17 |
-0,16 |
-94,12 |
|
Variation in provision in fixed assets |
|
0,00 |
|
|
|
Results before Taxes |
3,18 |
3,06 |
0,12 |
3,82 |
|
Corporate taxes |
0,76 |
0,88 |
-0,12 |
-14,03 |
|
Net Result |
2,42 |
2,18 |
0,24 |
11,06 |
|
Assets depreciation |
0,62 |
1,58 |
-0,96 |
-60,78 |
|
Change of Provisions |
|
0,19 |
|
|
|
Net Self-Financing |
3,04 |
3,95 |
-0,91 |
-23,08 |
Main Ratios
|
|
COMPANY (2007) |
PTILE25 |
PTILE50 |
PTILE75 |
|
STRUCTURAL RATIOS |
|
|
|
|
|
Management fund |
643.017,86 |
14,07 |
79,92 |
213,78 |
|
Indebtedness (%) |
4,97 |
50,48 |
70,90 |
84,93 |
|
External Funds on Net Worth |
0,05 |
1,02 |
2,44 |
5,64 |
|
GENERAL ACTIVITY
RATIO |
|
|
|
|
|
Turnover
Increase (%) |
-25,38 |
-10,06 |
0,34 |
11,18 |
|
Added value
growth (%) |
-17,06 |
-8,16 |
3,00 |
16,20 |
|
Cash Flow |
52.856,49 |
7,65 |
20,38 |
47,02 |
|
Labour
Productivity |
1,39 |
1,14 |
1,30 |
1,61 |
|
Assets turnover |
2,41 |
0,97 |
1,47 |
2,10 |
|
Breakdown Point |
1.414.805,94 |
313.403,56 |
651.298,66 |
1.192.759,02 |
|
Security Margin
of the Breakdown Point (%) |
18,69 |
3,74 |
8,94 |
16,51 |
|
ACTIVITY RATIOS |
|
|
|
|
|
Average
Collection Period |
6 |
30 |
68 |
114 |
|
SOLVENCY RATIOS |
|
|
|
|
|
Payback Capacity |
1,47 |
0,03 |
0,07 |
0,14 |
|
Assets Guarantee |
20,13 |
1,17 |
1,40 |
1,97 |
|
Short Term Debts
Proportion (%) |
100,00 |
73,96 |
94,93 |
100,00 |
|
Interest Coverage |
2,62 |
0,77 |
2,79 |
9,67 |
|
LIQUIDITY RATIOS |
|
|
|
|
|
Current Ratio |
18,92 |
1,08 |
1,35 |
1,96 |
|
Immediate liquidity |
18,11 |
0,04 |
0,16 |
0,45 |
|
Sales on Current Assets |
923 |
475 |
703 |
1.011 |
Results Analysis
Ratios
|
|
COMPANY (2007) |
PTILE25 |
PTILE50 |
PTILE75 |
|
Economic profitability (%) |
8,66 |
1,76 |
4,09 |
7,79 |
|
Operating Profitability (%) |
3,60 |
1,22 |
2,84 |
5,52 |
|
Equity gearing |
0,93 |
1,33 |
2,23 |
4,21 |
|
Financial profitability (%) |
6,12 |
2,70 |
7,63 |
16,46 |
|
General Profitability (%) |
2,42 |
0,49 |
1,28 |
3,08 |
FOREIGN EXCHANGE
RATES
|
Currency |
Unit
|
Indian Rupees |
|
US Dollar |
1 |
Rs.46.88 |
|
UK Pound |
1 |
Rs.82.97 |
|
Euro |
1 |
Rs.64.99 |
RATING
EXPLANATIONS
|
RATING |
STATUS |
PROPOSED CREDIT LINE |
|
|
>86 |
Aaa |
Possesses an extremely sound financial base with the strongest
capability for timely payment of interest and principal sums |
Unlimited |
|
71-85 |
Aa |
Possesses adequate working capital. No caution needed for credit
transaction. It has above average (strong) capability for payment of interest
and principal sums |
Large |
|
56-70 |
A |
Financial & operational base are regarded healthy. General
unfavourable factors will not cause fatal effect. Satisfactory capability for
payment of interest and principal sums |
Fairly Large |
|
41-55 |
Ba |
Overall operation is considered normal. Capable to meet normal
commitments. |
Satisfactory |
|
26-40 |
B |
Unfavourable & favourable factors carry similar weight in credit consideration.
Capability to overcome financial difficulties seems comparatively below
average. |
Small |
|
11-25 |
Ca |
Adverse factors are apparent. Repayment of interest and principal sums
in default or expected to be in default upon maturity |
Limited with
full security |
|
<10 |
C |
Absolute credit risk exists. Caution needed to be exercised |
Credit not
recommended |
|
NR |
In view of the lack of information, we have no basis upon which to
recommend credit dealings |
No Rating |
|
This score serves as a reference to assess SC’s credit risk
and to set the amount of credit to be extended. It is calculated from a
composite of weighted scores obtained from each of the major sections of this
report. The assessed factors and their relative weights (as indicated through
%) are as follows:
Financial
condition (40%) Ownership
background (20%) Payment
record (10%)
Credit history
(10%) Market trend
(10%) Operational
size (10%)