![]()
MIRA
INFORM REPORT
|
Report Date : |
04.10.2008 |
IDENTIFICATION
DETAILS
|
Name : |
JUARISTI. COMERCIAL S.L. ”TSCO” |
|
|
|
|
Registered Office : |
Poligono Industrial Basarte-Par 2 20720 Azkoitia
Guipúzcoa |
|
|
|
|
Country : |
Spain |
|
|
|
|
Financials (as on) : |
31.12.2005 |
|
|
|
|
Date of Incorporation : |
|
|
|
|
|
Legal Form : |
Limited Liability Company |
|
|
|
|
Line of Business : |
Manufacturer of Machine Tools for Metals, Wood,
Cork, etc and Spare Parts |
RATING &
COMMENTS
|
MIRA’s Rating : |
A |
|
RATING |
STATUS |
PROPOSED CREDIT LINE |
|
|
56-70 |
A |
Financial & operational base are regarded healthy. General
unfavourable factors will not cause fatal effect. Satisfactory capability for
payment of interest and principal sums |
Fairly Large |
|
Maximum Credit Limit : |
556.465,09 € |
|
|
|
|
Status : |
Good |
|
|
|
|
Payment Behaviour : |
No Complaints |
|
|
|
|
Litigation : |
Clear |
name of the
company
JUARISTI. COMERCIAL S.L. ”TSCO”
TAX NUMBER: B20492542
EXECUTIVE SUMMARY
Identification
Current Business Name: JUARISTI T.S.
COMERCIAL S.L.
Commercial Name: AZKOITIA
Commercial Name: TSCO
Other names: YES
Current Address: POLIGONO INDUSTRIAL BASARTE-PAR
2, CP 20720, AZKOITIA GUIPÚZCOA
Branches: 1
Telephone number: 943851221 Fax: 943851355
URL: www.juaristi.com Corporate e-mail: tsco@juaristi.com
Commercial Risk
Credit Appraisal: 556.465,09 €
Legal Actions: NO
Financial Information
Latest sales known (2007): 19.634.765,19 €
(Estimated)
Latest Balance sheet sales (2005): 19.440.362,48 € (MERCANTILE REGISTER)
Result: 131.265,08 €
Total Assets: 10.435.752,19 €
Social Capital: 605.820,20 €
Employees: 90
Commercial Information
Constitution Date: 27/05/1994
Business activity: Mfg. of
machine tools for metals, wood, cork, etc and spare parts
NACE Code: 2900
International Operations: Imports and
Exports
Corporate Structure
Sole Administrator:
ARAMBARRI
ARIZMENDIARRIETA JOSE ANTONIO
Parent Company:
Other Complementary Information
Latest proceeding published in BORME: 20/02/2007 Registration
of accounts
Latest press article: 16/03/2007 ESTRATEGIA
EMPRESARIAL (FINANCIAL INFORMATION)
Bank Entities: Yes
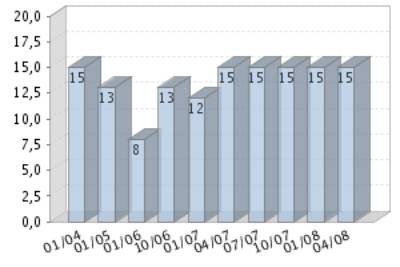
Rating Evolution
Financial Situation
Fiscal year2005
|
Treasury |
Good |
|
Indebtedness |
Important |
|
Profitability |
Null |
|
Balance |
Excellent |
Performance
|
Legal Actions |
None or Negligible |
|
Business
Trajectory |
Excellent |
Summary
LEGAL ACTIONS: No legal
incidences registered
CLAIM FILED AGAINST THE ADMINISTRATION: No administrative
claims registered
AFFECTED BY: No significant
element.
FINANCIAL ELEMENTS AND SECTORIAL
COMPARATIVE
FINANCIAL ELEMENTS
Figures given in €
|
|
2004 (12) |
2005 (12) |
2007 |
|
|
|
|
|
BALANCE SHEET ANALYSIS |
|
|
|
|
|
|
|
|
OWN FUNDS |
1.865.052,47 |
1.996.317,55 |
|
|
|
|
|
|
DEBT |
7.682.904,28 |
8.439.434,64 |
|
|
|
|
|
|
FIXED ASSETS |
1.055.193,77 |
985.602,04 |
|
|
|
|
|
|
TOTAL ASSETS |
9.547.956,75 |
10.435.752,19 |
|
|
|
|
|
|
|
2004 (12) |
2005 (12) |
2007 |
|
|
|
|
|
PROFIT AND LOSS ACCOUNT ANALYSIS |
|
|
|
|
|
|
|
|
SALES |
12.250.369,36 |
19.440.362,48 |
19.634.765,19 |
|
|
|
|
|
ADDED VALUE |
282.994,72 |
436.731,90 |
|
|
|
|
|
|
EBITDA |
282.994,72 |
436.731,90 |
|
|
|
|
|
|
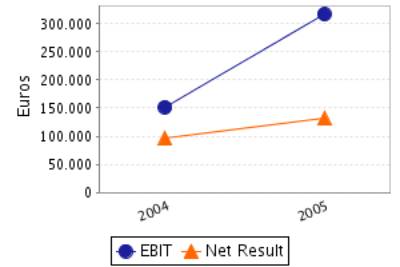
EBIT |
151.696,03 |
317.057,78 |
|
|
|
|
|
|
NET RESULT |
95.518,08 |
131.265,08 |
|
|
|
|
|
Balance Sheets Items
Analysis
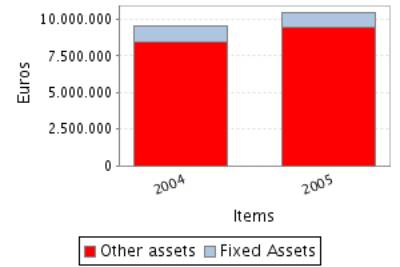
Balance Sheet
Comments
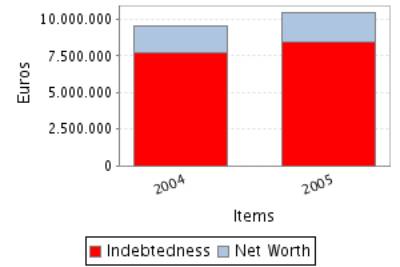
Total assets of the company grew 9,30% between 2004 and 2005.
In spite of the assets’ growth, the fixed assets decreased 6,60%.
This growth has been mainly financed with a debt increase of 9,85%.
Nevertheless the net worth increased 7,04%.
Profit and Loss Account Analysis
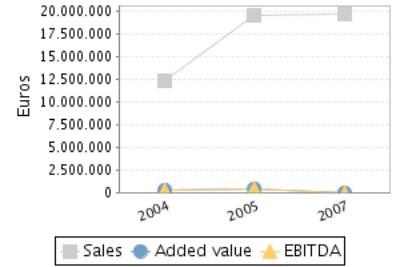
Profit and Loss
Account Comments
The company’s sales figure grew 58,69% between 2004 and 2005.
The company’s EBIT grew 109,01% between 2004 and 2005.
This evolution implies an increase in the company’s operating
profitability.
The result of these variations is an increase of the company’s Economic
Profitability of 91,23% in the analysed period, being this profitability of
3,04% in the year 2005.
The company’s Net Result grew 37,42% between 2004 and 2005.
This evolution, compared to the EBIT’s performance, implies that the financial
and extraordinary activities have had a negative effect in the company’s
Financial Profitability.
The result of these variations is an increase of the company’s Economic
Profitability of 28,39% in the analysed period, being equal to 6,58% in the year
2005.
ANNUAL FINANCIAL REPORT
ADDITIONAL DATA
Source: annual financial report 2005
Results Distribution
Figures given in €
|
DISTRIBUTION
BASE |
DISTRIBUTION TO |
||
|
Profit and Loss |
131.265,08 |
Retained earnings |
0,00 |
|
Carry Over |
0,00 |
Voluntary Reserve |
131.265,08 |
|
Voluntary reserves |
0,00 |
Prior years losses |
0,00 |
|
Reserves |
0,00 |
Carry Over |
0,00 |
|
Other concepts |
0,00 |
Other funds |
0,00 |
|
Total of Amounts to be distributed |
131.265,08 |
Dividends |
0,00 |
|
|
|
Other Applications |
0,00 |
Auditing
Auditors’ opinion: FAVOURABLE
Auditor: EUSKALTAX AUDIT
S.L
COMPARATIVE SECTOR ANALYSIS
Values table
Figures expressed in %
|
|
COMPANY (2005) |
SECTOR |
DIFFERENCE |
DIFFERENCE RELATIVE |
|
|
|
|
|
|
BALANCE SHEET ANALYSIS: % on the total
assets |
|
|
|
|
|
|
|
|
|
|
OWN FUNDS |
19,13 |
43,12 |
-23,99 |
-55,64 |
|
|
|
|
|
|
DEBT |
80,87 |
56,88 |
23,99 |
42,18 |
|
|
|
|
|
|
FIXED ASSETS |
9,44 |
28,80 |
-19,35 |
-67,20 |
|
|
|
|
|
|
|
|
|
|
|
|
|
|
|
|
|
|
COMPANY (2005) |
SECTOR |
DIFFERENCE |
DIFFERENCE RELATIVE |
|
|
|
|
|
|
PROFIT AND LOSS ACCOUNT ANALYSIS: % on the total
operating income |
|
|
|
|
|
|
|
|
|
|
SALES |
99,49 |
98,32 |
1,18 |
1,20 |
|
|
|
|
|
|
ADDED VALUE |
2,24 |
28,91 |
-26,68 |
-92,27 |
|
|
|
|
|
|
EBIT |
1,62 |
6,32 |
-4,70 |
-74,33 |
|
|
|
|
|
|
NET RESULT |
0,67 |
4,32 |
-3,65 |
-84,45 |
|
|
|
|
|
Sector Composition
Compared sector (NACE): 29
Number of companies: 329
Size (Sales Figure) : 7.000.000,00 -
40.000.000,00 Euros
Comments on the sectorial
comparative
Compared to its sector the assets of the companies show an inferior
proportion of fixed assets. Specifically the difference with the sector average
is -19,35% , which means a relative difference of -67,20% .
In liabilities composition the company appeals on a wider scale to self
financing, being the proportion of net worth of 23,99% inferior, which means a
relative difference of 55,64% 23,99% more than the sector, which means a
difference of 42,18% .
The proportion that the sales mean to the company’s total ordinary
income is 99,49%, 1,18% higher than in the sector, which means a relative
difference of 1,20% .
The company’s EBIT was positive and was 1,62% with regard to the total
ordinary income, 4,70% less than the sector, which means a relative difference
of 74,33% .
The company’s capacity to generate operating income is equal to that of
the sector as its ratio EBIT/Sales is also equal.
The company’s net result was positive and equal to 0,67% with regard to
the total ordinary income, 3,65% less than the sector, which means a relative
difference of 84,45% .
ADDRESSES
Current Legal Seat Address:
POLIGONO INDUSTRIAL BASARTE-PAR 2
20720 AZKOITIA GUIPÚZCOA
Previous Seat Address:
STREET KALE NAGUSIA, 53
20720
AZKOITIA GUIPÚZCOA
Characteristics of
the current address
Type of premises: factory, warehouse
Property: rented
Local Situation: secondary
Branches 
|
STREET |
POSTAL CODE |
TOWN |
PROVINCE |
|
STREET ESTRADA S/N |
20720 |
AZKOITIA |
Guipúzcoa |
1 branches registered
CORPORATE STRUCTURE
ADMINISTRATIVE LINKS
Main Board members,
Directors and Auditor ![]()
|
POSITION |
SURNAMES AND
NAME |
APPOINTMENT DATE |
|
|
SOLE ADMINISTRATOR |
ARAMBARRI ARIZMENDIARRIETA JOSE ANTONIO |
25/10/1999 |
|
|
AUDITOR |
APPOINTMENT DATE |
||
|
EUSKALTAX AUDIT SL |
31/01/2007 |
||
Functional Managers
|
POSITION |
SURNAMES AND
NAME |
|
General Manager |
ARIZNABARRETA CHURRUCA JAVIER |
|
Financial Manager |
ARAMBARRI APERRIBAY BEGONA |
|
Human Resources Manager |
BADIOLA ITURBE ANA |
|
Commercial Manager |
MENDEGUIA JESUS |
FINANCIAL LINKS
|
|
BUSINESS NAME |
CIF / COUNTRY |
% |
SOURCE |
DATA INF. |
|
|
AZKOZAR-BI S.L. |
B20599924 |
99,99 |
OWN SOURCES |
05/02/2008 |
CREDIT INFORMATION
Constitution Date: 27/05/1994
Foundation Date: 01/01/1941
Business activity 
Code: 1322000
Activity: Mfg. of machine tools for metals, wood, cork, etc
and spare parts
NACE Code: 2900
NACE Activity: Manufacture of machinery and equipment n.e.c.
Business: COMERCIALIZACION Y FABRICACION DE TODO TIPO DE
MAQUINA-HERRAMIENTA, ASI COMO ACCESORIOS, COMPONENTES, REPUESTOS Y DEMAS
PRODUCTOS RELACIONADOS CON LA MISMA.
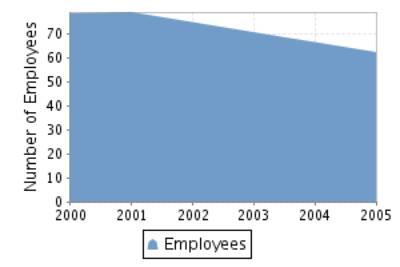
Employees 
Number of total employees: 90 (2008)
Number of fixed employees: 100,00%
Number of temporary employees: 0,00%
Employees evolution
COMMERCIAL OPERATIONS 
SUPPLIERS
|
BUSINESS NAME |
INTERNATIONAL |
|
ZARAZKO-BI SL |
NO |
1 proveedores
CLIENTS
|
BUSINESS NAME |
INTERNATIONAL |
|
PROINDEN SA |
NO |
|
AZKOZAR-BI SL |
NO |
2 clientes
Banks 
|
ENTITY |
BRANCH |
ADDRESS |
TOWN OR CITY |
PROVINCE |
|
BANCO SANTANDER, S.A. |
4637 |
CL MAYOR 56 APDO. 00000 |
AZKOITIA |
Guipúzcoa |
|
BANCO BILBAO VIZCAYA ARGENTARIA, S.A. |
0313 |
PLAZA OLATZ, 5 |
AZPEITIA |
Guipúzcoa |
|
BANCO DE VASCONIA, S.A. |
4728 |
PLAZA TXIKI, 1 |
AZPEITIA |
Guipúzcoa |
3 bank entities registered
Brands, Signs and Commercial
Names 
ANAGRAM: TSCO
FORMER NAMES:
•
TS COMERCIAL SL
LEGAL STRUCTURE
Constitution Data
Register Date: 27/05/1994
Register town: Guipúzcoa
Announcement number: 190760
Legal form: LIMITED LIABILITY
COMPANY
Social Capital: 4.808,1 €
Current structure data 
Current Legal Form: LIMITED LIABILITY
COMPANY
Current Capital: 605.820,20 €
Legal Aspects
Obligation to fill in Financial
Statements: YES
Chamber census: YES (2005)
Listed on a Stock Exchange: NO
B.O.R.M.E.(Official Companies
Registry Gazette) 
Registered Proceedings
|
PROCEEDINGS |
DATE |
NOTICE NUM. |
TRADE REG. |
|
Re-elections |
31/01/2007 |
57621 |
Guipúzcoa |
|
Re-elections |
31/01/2007 |
57620 |
Guipúzcoa |
Other Proceedings published
|
PROCEEDINGS |
DATE |
NOTICE NUM. |
TRADE REG. |
|
Registration of accounts (2005) Individual |
20/02/2007 |
115060 |
Guipúzcoa |
|
Registration of accounts (2004) Individual |
20/02/2007 |
114921 |
Guipúzcoa |
|
Registration of accounts (2003) Individual |
20/02/2007 |
114903 |
Guipúzcoa |
Press articles
16/03/2007 ESTRATEGIA EMPRESARIAL (FINANCIAL INFORMATION)
JUARISTI, FABRICANTE GUIPUZCOANO DE CENTROS DE MANDRINADO Y FRESADO DE PRECISION,
CAPTO EN 2006 UN CARTERA DE PEDIDOS DE 40 MM. DE EUROS. SEGUN SU DIRECTOR
GENERAL, JAVIER ARIZNABARRETA, LA CIA. PREVE CERRAR EL 2007 CON UNA FACTURACION
SUPERIOR A LOS 30 MM. DE EUROS. DE ELLOS, EL 90% CON VENTAS EN MERCADOS
EXTERIORES, EXPERIMENTANDO UN GRAN CRECIMIENTO EN ALEMANIA Y EN INDIA, AUNQUE
CUENTA CON PEDIDOS DE NORUEGA, HOLANDA, FRANCIA Y ARABIA SAUDI. ACTUALMENTE LA
EMPRESA CUENTA CON UNA PLANTILLA DE 90 TRABAJADORES.
16/09/2005 ESTRATEGIA EMPRESARIAL (GENERAL INFORMATION)
EL FABRICANTE GUIPUZCOANO JUARISTI CUENTA CON UNA CARTERA DE PEDIDOS POR
VALOR DE 18 MM. DE EUROS CON PRESENCIA EN EL MERCADO INTERNACIONAL, QUE LE
PERMITIRA CERRAR EL EJERCICIO CON UN RATIO DE EXPORTACION POR ENCIMA DEL 75%
FACTURANDO 22 MM. DE EUROS. ASIMISMO, LA EMPRESA CON SEDE EN AZKOITIA HA
PRESENTADO EN LA FERIA EMO DE HANNOVER DOS NUEVO MODELOS DE MAQUINARIA, EL MX5
RAM Y EL TX1S.
FINANCIAL INFORMATION
The information on the last account contained in this report is
extracted from the Mercantile Register file of the legal address of the Company
and dated 15/03/2007.
BALANCE SHEET
Assets
Figures given in €
|
|
31/12/2001 (12) |
31/12/2004 (12) |
31/12/2005 (12) |
|
A) DUE FROM SHAREHOLDERS FOR UNCALLED CAPITAL |
|
|
|
|
B) FIXED ASSETS |
75.601,31 |
1.055.193,77 |
985.602,04 |
|
I. Incorporation costs |
|
|
|
|
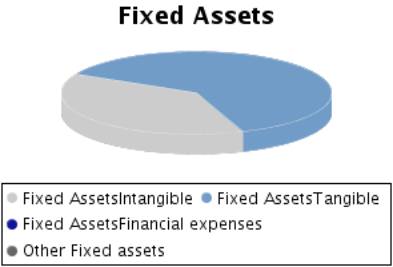
II. Intangible fixed assets |
9.243,57 |
428.022,14 |
375.787,82 |
|
R & D expenses |
56.831,70 |
101.679,26 |
105.879,26 |
|
Concessions, patents, licences , trademarks |
|
|
|
|
Goodwill |
|
|
|
|
Acquired rights from finance leases |
|
535.027,68 |
535.027,68 |
|
Software |
27.989,13 |
27.988,35 |
31.247,35 |
|
Leasing |
|
|
|
|
Cash advance |
|
|
|
|
Provisions |
|
|
|
|
Depreciation |
-75.577,27 |
-236.673,15 |
-296.366,47 |
|
III. Tangible fixed assets |
66.357,75 |
627.171,63 |
609.814,22 |
|
Property, plant and equipment |
|
|
|
|
Machinery, equipment and other |
653.678,80 |
1.187.682,50 |
1.230.303,77 |
|
Other property plant and equipment |
20.843,10 |
104.076,92 |
104.076,92 |
|
Prepaid expenses on fixed assets |
|
|
|
|
Other assets |
57.444,74 |
135.245,40 |
135.245,40 |
|
Provisions |
|
|
|
|
Depreciation |
-665.608,89 |
-799.833,19 |
-859.811,87 |
|
IV. Financial fixed assets |
|
|
|
|
Shares in affiliated companies |
|
|
|
|
Receivables in affiliated companies |
|
|
|
|
Shares in associated companies |
|
|
|
|
Loans to associated companies |
|
|
|
|
Securities |
|
|
|
|
Other loans |
|
|
|
|
Long term deposits and guarantees |
|
|
|
|
Provisions |
|
|
|
|
Taxes receivable |
|
|
|
|
V.Owners equity |
|
|
|
|
VI.Long term trade liabilities |
|
|
|
|
C) DEFERRED EXPENSES |
|
|
|
|
D) CURRENT ASSETS |
5.810.759,32 |
8.492.762,98 |
9.450.150,15 |
|
I. Shareholders by required outlays |
|
|
|
|
II. Stocks |
3.317.773,13 |
2.837.045,36 |
4.361.579,29 |
|
Goods available for sale |
82.837,50 |
76.798,95 |
105.770,22 |
|
Raw material inventory |
|
32.078,47 |
48.447,65 |
|
Work in Progress |
51.380,52 |
2.679.007,09 |
4.125.163,14 |
|
Finished goods |
3.183.555,11 |
|
|
|
Subproducts and recycled materials |
|
|
|
|
Cash advance |
|
49.160,85 |
82.198,28 |
|
Provisions |
|
|
|
|
III. Debtors |
357.109,37 |
4.375.510,43 |
3.228.099,67 |
|
Clients |
236.786,75 |
3.448.338,67 |
1.898.518,21 |
|
Amounts owned by affiliated companies |
|
|
|
|
Amounts owned by associated companies |
|
|
|
|
Other debts |
|
|
40.982,60 |
|
Staff Expenses |
|
|
|
|
Government |
169.966,22 |
976.817,37 |
1.338.244,47 |
|
Provisions |
-49.643,60 |
-49.645,61 |
-49.645,61 |
|
IV. Temporary financial investment |
1.578.672,48 |
1.024.815,73 |
1.459.662,06 |
|
Shares in affiliated companies |
|
|
|
|
Receivables in affiliated companies |
|
|
|
|
Shares in associated companies |
|
|
|
|
Loans to associated companies |
|
|
|
|
Short term investment |
|
1.037.946,22 |
1.469.907,96 |
|
Other loans |
1.829.823,42 |
|
|
|
Short Term Deposit and guarantees |
|
|
|
|
Provisions |
-251.150,94 |
-13.130,49 |
-10.245,90 |
|
V. Short-term own shares |
|
|
|
|
VI. Treasury |
159.226,14 |
114.748,62 |
272.840,49 |
|
VII. Periodification adjustments |
397.978,20 |
140.642,84 |
127.968,64 |
|
ASSETS (A + B + C + D) |
5.886.360,63 |
9.547.956,75 |
10.435.752,19 |
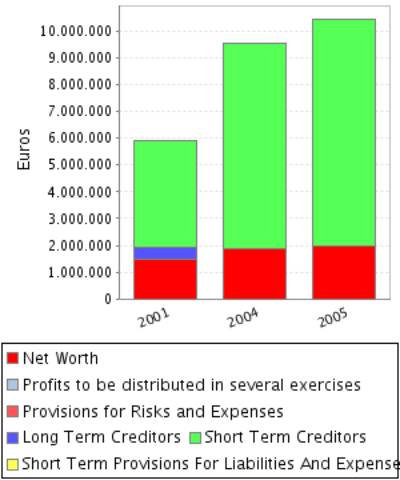
Assets composition

Liabilities
Figures given in €
|
|
31/12/2001 (12) |
31/12/2004 (12) |
31/12/2005 (12) |
|
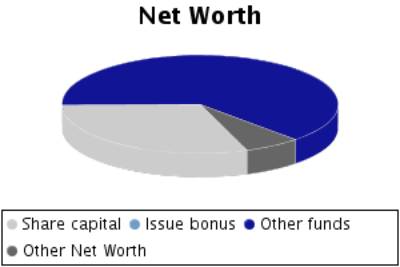
A) SHAREHOLDERS EQUITY |
1.485.527,63 |
1.865.052,47 |
1.996.317,55 |
|
I. Share capital |
605.820,20 |
605.820,20 |
605.820,20 |
|
II. Issue bonus |
|
|
|
|
III.Revaluation reserve |
|
|
|
|
IV.Reserves |
713.876,17 |
1.163.714,19 |
1.259.232,27 |
|
Retained earnings |
71.388,22 |
116.371,43 |
121.164,04 |
|
Sinking fund from owner equity |
|
|
|
|
Reserve for the parent company capital |
|
|
|
|
Statutory reserve |
|
|
|
|
Other funds |
642.487,95 |
1.047.342,76 |
1.138.068,23 |
|
Capital adjustments in Euros |
|
|
|
|
V.Results from previous years |
|
|
|
|
Carry Over |
|
|
|
|
Prior years losses |
|
|
|
|
Loans from partners for losses compensation |
|
|
|
|
VI.Profit and Losses |
165.831,26 |
95.518,08 |
131.265,08 |
|
VII.Dividend paid during the year |
|
|
|
|
VIII.Own shares for capital reduction |
|
|
|
|
B) DEFERRED INCOME |
|
|
|
|
Capital grants |
|
|
|
|
Positive change difference |
|
|
|
|
Other deferred income |
|
|
|
|
Fiscal deferred income |
|
|
|
|
C) PROVISIONS FOR LIABILITIES AND EXPENSES |
|
|
|
|
Provision for pensions plans |
|
|
|
|
Provision for taxes |
|
|
|
|
Other provisions |
|
|
|
|
Reversion fund |
|
|
|
|
D) LONG TERM LIABILITIES |
419.049,68 |
|
|
|
I.Negotiable bonds and other negotiable values |
|
|
|
|
Non convertible securities |
|
|
|
|
Convertible securities |
|
|
|
|
Other convertible debentures |
|
|
|
|
II.Debt with bank entities |
419.049,68 |
|
|
|
Long term bank loans |
419.049,68 |
|
|
|
Leasing |
|
|
|
|
III.Debts with associated and affiliated
companies |
|
|
|
|
With affiliated companies |
|
|
|
|
Associated companies |
|
|
|
|
IV. Other creditors |
|
|
|
|
Bills payable |
|
|
|
|
Other debts |
|
|
|
|
Long term deposit and guaranties |
|
|
|
|
Taxes receivable |
|
|
|
|
V. Deferred debts on shares |
|
|
|
|
From affiliated companies |
|
|
|
|
From associated companies |
|
|
|
|
Other companies |
|
|
|
|
VI. Long term debt with creditor |
|
|
|
|
E) SHORT TERM LIABILITIES |
3.981.783,32 |
7.682.904,28 |
8.439.434,64 |
|
I.Negotiable bonds and other negotiable values |
|
|
|
|
Non convertible securities |
|
|
|
|
Convertible securities |
|
|
|
|
Other convertible debentures |
|
|
|
|
Interests from bonds |
|
|
|
|
II.Debt with bank entities |
|
1.057.619,42 |
466.957,77 |
|
Loans and other debts |
|
1.057.619,42 |
466.957,77 |
|
Debt interest |
|
|
|
|
Leasing |
|
|
|
|
III. Short term debts with associated and affiliated
companies |
|
|
|
|
With affiliated companies |
|
|
|
|
Associated companies |
|
|
|
|
IV. Commercial creditors |
3.902.107,15 |
6.508.759,92 |
7.857.648,74 |
|
Accounts payable |
|
1.709.219,40 |
2.196.625,21 |
|
Expenses |
3.902.107,15 |
4.799.540,52 |
5.661.023,53 |
|
Bills payable |
|
|
|
|
V. Other non-commercial debt |
79.676,17 |
116.524,94 |
114.828,13 |
|
Government |
55.371,25 |
58.253,05 |
82.487,78 |
|
Bills payable |
|
|
|
|
Other debts |
24.304,93 |
58.271,89 |
32.340,35 |
|
Accounts receivable |
|
|
|
|
Short term deposits and guarantees |
|
|
|
|
VI. Provisions for current assets |
|
|
|
|
VII. Periodification adjustments |
|
|
|
|
F) SHORT TERM PROVISIONS FOR LIABILITIES AND
EXPENSES |
|
|
|
|
LIABILITIES (A + B + C + D + E + F) |
5.886.360,63 |
9.547.956,75 |
10.435.752,19 |
Liabilities
Composition

PROFIT AND LOSS ACCOUNT
Itams of the Profit and
Loss Account
Figures given in €
|
|
31/12/2001 (12) |
31/12/2004 (12) |
31/12/2005 (12) |
|
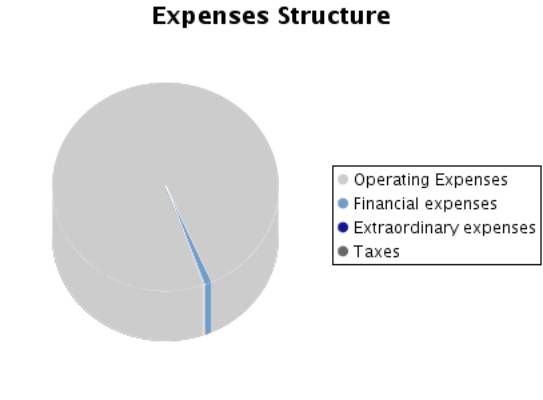
A) EXPENSES (A.1 a A.16) |
14.352.427,49 |
13.716.736,80 |
20.878.800,64 |
|
A.1.Reduction in stocks of finished goods and
work in progress |
|
|
|
|
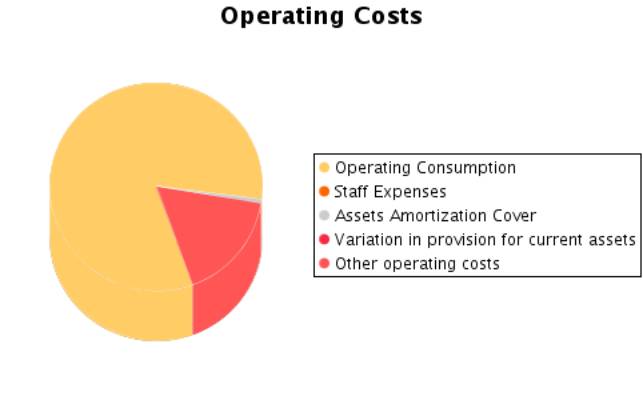
A.2.Supplies |
11.114.138,21 |
11.018.713,98 |
17.298.400,01 |
|
Material consumed |
11.114.138,21 |
6.478.880,61 |
10.558.419,40 |
|
Raw materials consumed |
|
1.062.724,90 |
2.441.501,91 |
|
Other expenses |
|
3.477.108,47 |
4.298.478,70 |
|
A.3. Labour cost |
|
|
|
|
Wages |
|
|
|
|
Social security expenses |
|
|
|
|
A.4. Assets depreciation |
131.212,96 |
131.298,69 |
119.674,12 |
|
A.5.Variance in the traffic provisions |
245.255,01 |
|
|
|
Variance in provision for inventory |
|
|
|
|
Variance in provision for bad debts |
|
|
|
|
Variance in provision for other current assets |
245.255,01 |
|
|
|
A.6. Other operating costs |
2.733.968,00 |
2.499.896,47 |
3.250.243,95 |
|
External costs |
2.733.312,90 |
2.499.350,98 |
3.249.550,04 |
|
Taxes |
655,10 |
545,49 |
693,91 |
|
Other day to day expenses |
|
|
|
|
Allowance to reversion fund |
|
|
|
|
A.I.OPERATING RESULT
(B.1+B.2+B.3+B.4-A.1-A.2-A.3-A.4-A.5-A.6) |
109.480,36 |
151.696,03 |
317.057,78 |
|
A.7.Financial expenses and similar |
80.571,68 |
116.373,87 |
200.156,52 |
|
Debts with related companies |
|
|
|
|
Debts with associated companies |
|
|
|
|
By debts with third parties and similar expenses |
79.039,10 |
105.813,09 |
200.156,52 |
|
Losses from financial investments |
1.532,58 |
10.560,78 |
|
|
A.8. Variation in financial investment provision |
|
-3.795,85 |
-2.884,59 |
|
A.9.Negative exchange difference |
438,74 |
2.046,72 |
123,92 |
|
A.II.POSITIVE FINANCIAL RESULTS
(B.5+B.6+B.7+B.8-A.7-A.8-A.9) |
37.557,25 |
|
|
|
A.III.PROFIT FROM ORDINARY ACTIVITIES
(A.I+A.II-B.I-B.II) |
147.037,61 |
44.721,00 |
144.351,79 |
|
A.10. Variation in provision in fixed assets |
|
|
|
|
A.11. Losses in fixed assets |
|
|
|
|
A.12. Losses from own shares and bonds |
|
|
|
|
A.13. Extraordinary charges |
6.947,70 |
|
|
|
A.14.Other exercises’ expenses and losses |
|
|
2.658,42 |
|
A.IV.POSITIVE EXTRAORDINARY RESULT
(B.9+B.10+B.11+B.12+B.13-A.10-A.11-A.12-A.13-A.14) |
58.688,83 |
3.000,00 |
|
|
A.V.PROFIT BEFORE TAXES (A.III+A.IV-B.III-B.IV) |
205.726,44 |
47.721,00 |
141.693,37 |
|
A.15.Corporate Taxes |
39.895,18 |
-47.797,08 |
10.428,29 |
|
A.16. Other taxes |
|
|
|
|
A.VI.EXERCISE RESULT (PROFIT) (A.V-A.14-A.15) |
165.831,26 |
95.518,08 |
131.265,08 |
|
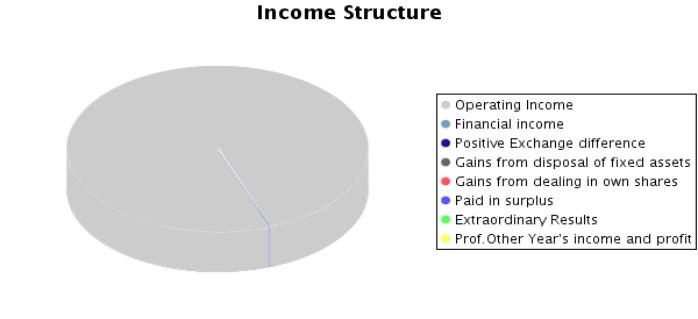
B) INCOMES (B.1 a B13) |
14.518.258,75 |
13.812.254,88 |
21.010.065,72 |
|
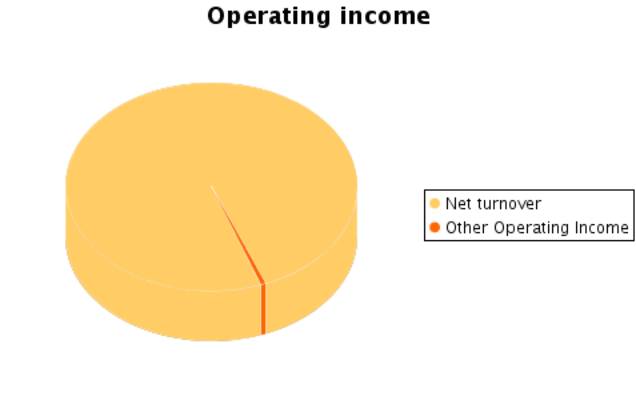
B.1. Turnover |
12.724.141,45 |
12.250.369,36 |
19.440.362,48 |
|
Sales |
12.336.422,54 |
11.978.051,69 |
19.068.861,55 |
|
Services provided |
387.718,92 |
272.317,67 |
371.500,93 |
|
Refunds and sale reminders |
|
|
|
|
B.2.Increase in inventory of finished goods and
works in progress |
1.586.215,19 |
1.481.301,03 |
1.446.156,05 |
|
B.3.Expenses capitalized |
|
|
|
|
B.4. Other operating income |
23.697,91 |
69.934,78 |
98.857,33 |
|
Other incomes |
|
|
|
|
Grants |
22.135,28 |
69.934,78 |
98.857,33 |
|
Excess in provision for liabilities and charges |
1.562,63 |
|
|
|
B.I.OPERATING LOSSES
(A.1+A.2+A.3+A.4+A.5+A.6-B.1-B.2-B.3-B.4) |
|
|
|
|
B.5.Incomes from share participations |
|
|
|
|
From affiliated companies |
|
|
|
|
From associated companies |
|
|
|
|
From other companies |
|
|
|
|
B.6.Income from other securities and credits to
fixed assets |
|
7.209,41 |
8.792,96 |
|
From affiliated companies |
|
7.209,41 |
8.792,96 |
|
From associated companies |
|
|
|
|
Other companies |
|
|
|
|
B.7.Other interests and similar |
118.567,67 |
440,30 |
2.046,05 |
|
From affiliated companies |
|
|
|
|
From associated companies |
|
|
|
|
Other Interests |
118.567,67 |
440,30 |
2.046,05 |
|
Profits from investments |
|
|
|
|
B.8. Positive change difference |
|
|
13.850,85 |
|
B.II. NEGATIVE FINANCIAL RESULTS
(A.7+A.8+A.9-B.5-B.6-B.7-B.8) |
|
106.975,03 |
172.705,99 |
|
B.III.LOSSES FROM ORDINARY ACTIVITIES
(B.I+B.II-A.I-A.II) |
|
|
|
|
B.9.B.9. Gains from disposal of fixed assets |
|
|
|
|
B.10.Gains from dealing in own shares |
|
|
|
|
B.11. Paid in surplus |
|
|
|
|
B.12. Extraordinary income |
65.636,53 |
|
|
|
B.13.Other year’s income and profits |
|
3.000,00 |
|
|
B.IV.NEGATIVE EXTRAORDINARY LOSSES
(A.10+A.11+A.12+A.13+A.14-B.9-B.10-B.11-B.12-B.13) |
|
|
2.658,42 |
|
B.V.LOSS BEFORE TAXES (B.III+B.IV-A.III-A.IV) |
|
|
|
|
B.VI.EXERCISE RESULTS (LOSS) (B.V+A.14+A.15) |
|
|
|
Composition of the
Profit and Loss Account
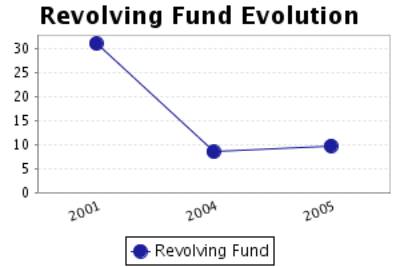
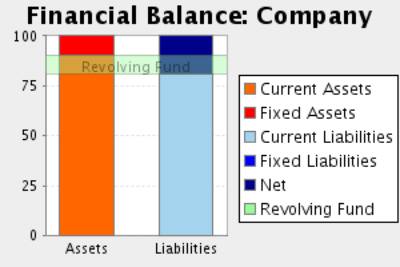
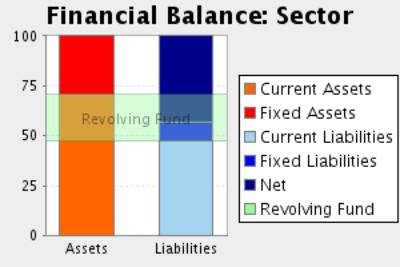
FINANCIAL BALANCE
Here the Main Capital Amounts of the company and the Revolving
Fund Evolution are analysed.
Financial Balance
Table
Figures given in €
|
|
31/12/2001 (12) |
% |
31/12/2004 (12) |
% |
31/12/2005 (12) |
% |
|
A) DUE FROM SHAREHOLDERS FOR UNCALLED CAPITAL |
|
|
|
|
|
|
|
B) FIXED ASSETS |
75.601,31 |
1,28 |
1.055.193,77 |
11,05 |
985.602,04 |
9,44 |
|
C) DEFERRED EXPENSES |
|
|
|
|
|
|
|
D) CURRENT ASSETS |
5.810.759,32 |
98,72 |
8.492.762,98 |
88,95 |
9.450.150,15 |
90,56 |
|
ASSETS (A + B + C + D) |
5.886.360,63 |
|
9.547.956,75 |
|
10.435.752,19 |
|
|
|
||||||
|
A) SHAREHOLDERS EQUITY |
1.485.527,63 |
25,24 |
1.865.052,47 |
19,53 |
1.996.317,55 |
19,13 |
|
B) DEFERRED INCOME |
|
|
|
|
|
|
|
C) PROVISIONS FOR LIABILITIES AND EXPENSES |
|
|
|
|
|
|
|
D) LONG TERM LIABILITIES |
419.049,68 |
7,12 |
|
|
|
|
|
E) SHORT TERM LIABILITIES |
3.981.783,32 |
67,64 |
7.682.904,28 |
80,47 |
8.439.434,64 |
80,87 |
|
F) SHORT TERM PROVISIONS FOR LIABILITIES AND EXPENSES |
|
|
|
|
|
|
|
LIABILITIES (A + B + C + D + E + F) |
5.886.360,63 |
|
9.547.956,75 |
|
10.435.752,19 |
|
Financial Balance
Composition

Comments on Financial
Balance
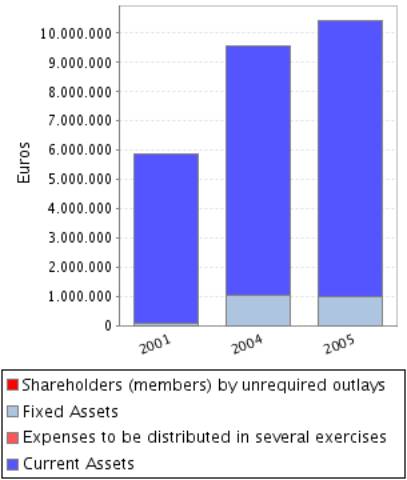
In the 2001, the assets of the company were formed in 1,28% of Fixed
Assets and in 98,72% of Current Assets.This assets were financed in 25,24% with
own capitals, and in 7,12% with long term debt and in 67,64% with current
liabilities.
The result of this financial structure is a positive turnover fund of
1.828.976,00 Euros, which is equivalent to 31,07% proportion of the
company’s total assets.
In the 2004, the assets of the company were formed in 11,05% of Fixed
Assets and in 88,95% of Current Assets.This assets were financed in 19,53% with
own capitals and in 80,47% with current liabilities.
The result of this financial structure is a positive turnover fund of
809.858,70 Euros, which is equivalent to 8,48% proportion of the
company’s total assets.
In the 2005, the assets of the company were formed in 9,44% of Fixed
Assets and in 90,56% of Current Assets.This assets were financed in 19,13% with
own capitals and in 80,87% with current liabilities.
The result of this financial structure is a positive turnover fund of
1.010.715,51 Euros, which is equivalent to 9,69% proportion of the
company’s total assets.
This measure has increased with respect to the previous exercise in
24,80% having also increased its proportion with respect to the total assets of
the company.
RATIOS
Main Ratios
|
|
31/12/2001 (12) |
31/12/2004 (12) |
31/12/2005 (12) |
|
STRUCTURAL RATIOS |
|
|
|
|
Management fund |
1.828.976,00 |
809.858,70 |
1.010.715,51 |
|
Management Fund Requirement |
91.077,37 |
727.913,77 |
-254.829,27 |
|
Indebtedness (%) |
74,76 |
80,47 |
80,87 |
|
External Funds on Net Worth |
2,96 |
4,12 |
4,23 |
|
GENERAL ACTIVITY RATIO |
|
|
|
|
Turnover Increase (%) |
14,64 |
|
58,69 |
|
Added value growth (%) |
6,03 |
|
54,32 |
|
Cash Flow |
542.299,23 |
223.020,92 |
248.054,61 |
|
Assets turnover |
2,16 |
1,28 |
1,86 |
|
Breakdown Point |
12.314.400,12 |
11.648.721,57 |
17.858.964,25 |
|
Security Margin of the Breakdown Point (%) |
3,40 |
5,45 |
8,60 |
|
ACTIVITY RATIOS |
|
|
|
|
Average Payment Period |
147 |
246 |
178 |
|
Average Collection Period |
10 |
129 |
60 |
|
Inventory Turnover Period |
94 |
83 |
81 |
|
SOLVENCY RATIOS |
|
|
|
|
Payback Capacity |
0,12 |
0,03 |
0,03 |
|
Assets Guarantee |
1,34 |
1,24 |
1,24 |
|
Short Term Debts Proportion (%) |
90,48 |
100,00 |
100,00 |
|
Interest Coverage |
-15,54 |
-11,96 |
-6,10 |
|
LIQUIDITY RATIOS |
|
|
|
|
Current Ratio |
1,46 |
1,10 |
1,12 |
|
Immediate liquidity |
0,44 |
0,15 |
0,20 |
|
Treasury |
1.737.898,62 |
81.944,93 |
1.265.544,78 |
|
Sales on Current Assets |
788 |
519 |
741 |
Results Analysis
Ratios
|
|
31/12/2001 (12) |
31/12/2004 (12) |
31/12/2005 (12) |
|
Economic profitability (%) |
1,86 |
1,59 |
3,04 |
|
Operating Profitability (%) |
0,86 |
1,24 |
1,63 |
|
Equity gearing |
5,32 |
1,51 |
2,38 |
|
Financial profitability (%) |
11,16 |
5,12 |
6,58 |
|
General Profitability (%) |
1,30 |
0,78 |
0,68 |
Comments on the
Results Analysis Ratios
The economic profitability in the year2005 achieved a 3,04% positive
level, due to a 1,63% economic margin and to an assets turnover of1,86%.
The economic profitability in the year has increased from 1,59% up to
3,04%. This growth is due to the economic margin increase, from 1,24% to the
current 1,63Y%, and to the assets turnover index, which in the last period has
achieved 1,86, compared to 1,28 del 2004.
Financial profitability on 2005 achieved a 6,58%.
The company’s financial structure has instigated its economic
profitability with an indebtedness level of 2,38.
The general profitability on 2005 achieved a 0,68%.
SECTORIAL ANÁLYSIS
Large Capital Amounts
and Financial Balance
Figures given in %
|
|
COMPANY (2005) |
SECTOR |
DIFFERENCE |
DIFFERENCE RELATIVE |
|
|
|
|
|
|
ASSETS |
|
|
|
|
|
|
|
|
|
|
A) DUE FROM SHAREHOLDERS FOR UNCALLED CAPITAL |
|
0,05 |
|
|
|
|
|
|
|
|
B) FIXED ASSETS |
9,44 |
28,80 |
-19,36 |
-67,22 |
|
|
|
|
|
|
C) DEFERRED EXPENSES |
|
0,32 |
|
|
|
|
|
|
|
|
D) CURRENT ASSETS |
90,56 |
70,83 |
19,73 |
27,85 |
|
|
|
|
|
|
ASSETS (A + B + C + D) |
100 |
100 |
|
|
|
|
|
|
|
|
|
|
|
|
|
|
|
|
|
|
|
|
COMPANY (2005) |
SECTOR |
DIFFERENCE |
DIFFERENCE RELATIVE |
|
|
|
|
|
|
LIABILITIES |
|
|
|
|
|
|
|
|
|
|
A) SHAREHOLDERS EQUITY |
19,13 |
42,60 |
-23,47 |
-55,10 |
|
|
|
|
|
|
B) DEFERRED INCOME |
|
0,52 |
|
|
|
|
|
|
|
|
C) PROVISIONS
FOR LIABILITIES AND EXPENSES |
|
0,48 |
|
|
|
|
|
|
|
|
D) LONG TERM
LIABILITIES |
|
9,29 |
|
|
|
|
|
|
|
|
E) SHORT TERM
LIABILITIES |
80,87 |
47,08 |
33,80 |
71,79 |
|
|
|
|
|
|
F) SHORT TERM
PROVISIONS FOR LIABILITIES AND EXPENSES |
|
0,03 |
|
|
|
|
|
|
|
|
LIABILITIES (A + B + C + D + E + F) |
100 |
100 |
|
|
|
|
|
|
|
Financial Balance Composition
Comments to the Sectorial
Analysis
In the 2005, the assets of the company were formed in 9,44% of fixed
assets and in 90,56Current Assets % In the sector, the proportion of fixed
assets was of 29,17%, 67,64% superior, and the proportion of current assets was
of 70,83%, 27,85% inferior.
The assets were financed in the company in 19,13% with own capitals and
in 80,87% with current liabilities In the sector, the self financing
represented 43,12%, 55,64% superior. On the other hand the long term debts
represented in the sector an average of 47,10% financing, with a relative
difference of 71,68% in favour of the company
The result of this company’s financial structure is a turnover fund that
represents 9,69% of the total assets; in the sector, this same proportion is
23,73%, therefore, we can say that the company’s turnover fund is 59,16%
smaller than the sector one.
Analytical Account of Results
Figures given in %
|
|
COMPANY (2005) |
SECTOR |
DIFFERENCE |
DIFFERENCE RELATIVE |
|
Turnover |
99,49 |
98,32 |
1,17 |
1,19 |
|
Other operating income |
0,51 |
1,68 |
-1,17 |
-69,68 |
|
Production Value |
100,00 |
100,00 |
0,00 |
0,00 |
|
Operating expenses |
81,13 |
58,50 |
22,63 |
38,68 |
|
Other operation expenses |
16,63 |
12,59 |
4,04 |
32,13 |
|
Added value |
2,24 |
28,91 |
-26,67 |
-92,25 |
|
Labour cost |
|
19,21 |
|
|
|
Gross Economic Result |
2,24 |
9,70 |
-7,46 |
-76,91 |
|
Assets depreciation |
0,61 |
3,01 |
-2,40 |
-79,72 |
|
Variation in provision for current assets and bad debt losses |
|
0,37 |
|
|
|
Net Economic Result |
1,62 |
6,32 |
-4,70 |
-74,38 |
|
Financial income |
0,13 |
0,71 |
-0,58 |
-81,79 |
|
Financial Charges |
1,03 |
1,12 |
-0,09 |
-8,28 |
|
Variation in financial investment provision |
-0,01 |
0,03 |
-0,04 |
-133,33 |
|
Ordinary Activities Result |
0,74 |
5,88 |
-5,14 |
-87,42 |
|
Extraordinary income |
|
0,75 |
|
|
|
Extraordinary charges |
0,01 |
0,50 |
-0,48 |
-97,98 |
|
Variation in provision in fixed assets |
|
0,02 |
|
|
|
Results before Taxes |
0,73 |
6,12 |
-5,39 |
-88,06 |
|
Corporate taxes |
0,05 |
1,80 |
-1,74 |
-97,21 |
|
Net Result |
0,67 |
4,32 |
-3,65 |
-84,49 |
|
Assets depreciation |
0,61 |
3,01 |
-2,40 |
-79,72 |
|
Change of Provisions |
-0,01 |
0,42 |
-0,44 |
-102,35 |
|
Net Self-Financing |
1,27 |
7,75 |
-6,48 |
-83,62 |
Principales Ratios
|
|
COMPANY (2005) |
PTILE25 |
PTILE50 |
PTILE75 |
|
STRUCTURAL RATIOS |
|
|
|
|
|
Management fund |
1.010.715,51 |
806,11 |
2.199,71 |
5.158,59 |
|
Management Fund Requirement |
-254.829,27 |
-1.543,96 |
292,40 |
2.042,45 |
|
Indebtedness (%) |
80,87 |
43,46 |
59,29 |
73,06 |
|
External Funds on Net Worth |
4,23 |
0,77 |
1,46 |
2,71 |
|
GENERAL ACTIVITY RATIO |
|
|
|
|
|
Turnover Increase (%) |
58,69 |
-2,73 |
7,34 |
19,68 |
|
Added value growth (%) |
54,32 |
-5,36 |
4,60 |
16,27 |
|
Cash Flow |
248.054,61 |
433,44 |
837,00 |
1.519,40 |
|
Assets turnover |
1,86 |
0,90 |
1,18 |
1,48 |
|
Breakdown Point |
17.858.964,25 |
7.439.865,01 |
10.716.853,89 |
15.238.129,58 |
|
Security Margin of the Breakdown Point (%) |
8,60 |
5,67 |
14,07 |
23,61 |
|
ACTIVITY RATIOS |
|
|
|
|
|
Average Payment Period |
178 |
88 |
128 |
182 |
|
Average Collection Period |
60 |
91 |
122 |
159 |
|
Inventory Turnover Period |
81 |
37 |
60 |
89 |
|
SOLVENCY RATIOS |
|
|
|
|
|
Payback Capacity |
0,03 |
0,07 |
0,14 |
0,27 |
|
Assets Guarantee |
1,24 |
1,36 |
1,68 |
2,30 |
|
Short Term Debts Proportion (%) |
100,00 |
79,02 |
92,42 |
99,30 |
|
Interest Coverage |
-6,10 |
2,32 |
7,78 |
27,47 |
|
LIQUIDITY RATIOS |
|
|
|
|
|
Current Ratio |
1,12 |
1,16 |
1,45 |
2,02 |
|
Immediate liquidity |
0,20 |
0,03 |
0,13 |
0,44 |
|
Treasury |
1.265.544,78 |
-1.389,00 |
17,48 |
1.358,72 |
|
Sales on Current Assets |
741 |
433 |
580 |
738 |
Results Analysis
Ratios
|
|
COMPANY (2005) |
PTILE25 |
PTILE50 |
PTILE75 |
|
Economic profitability (%) |
3,04 |
2,51 |
6,14 |
11,19 |
|
Operating Profitability (%) |
1,63 |
2,16 |
4,97 |
9,92 |
|
Equity gearing |
2,38 |
1,50 |
2,08 |
3,27 |
|
Financial profitability (%) |
6,58 |
3,82 |
10,67 |
20,11 |
|
General Profitability (%) |
0,68 |
1,24 |
3,61 |
7,08 |
NOTES
Linked by its board members to J 2000 SAL (A20173068);ZARAZKO-BI SL
(B20599916 );TALLERES HILFA SL (B48912984)
FOREIGN EXCHANGE
RATES
|
Currency |
Unit
|
Indian Rupees |
|
US Dollar |
1 |
Rs.46.88 |
|
UK Pound |
1 |
Rs.82.97 |
|
Euro |
1 |
Rs.64.99 |
RATING
EXPLANATIONS
|
RATING |
STATUS |
PROPOSED CREDIT LINE |
|
|
>86 |
Aaa |
Possesses an extremely sound financial base with the strongest
capability for timely payment of interest and principal sums |
Unlimited |
|
71-85 |
Aa |
Possesses adequate working capital. No caution needed for credit
transaction. It has above average (strong) capability for payment of interest
and principal sums |
Large |
|
56-70 |
A |
Financial & operational base are regarded healthy. General
unfavourable factors will not cause fatal effect. Satisfactory capability for
payment of interest and principal sums |
Fairly Large |
|
41-55 |
Ba |
Overall operation is considered normal. Capable to meet normal
commitments. |
Satisfactory |
|
26-40 |
B |
Unfavourable & favourable factors carry similar weight in credit
consideration. Capability to overcome financial difficulties seems
comparatively below average. |
Small |
|
11-25 |
Ca |
Adverse factors are apparent. Repayment of interest and principal sums
in default or expected to be in default upon maturity |
Limited with
full security |
|
<10 |
C |
Absolute credit risk exists. Caution needed to be exercised |
Credit not
recommended |
|
NR |
In view of the lack of information, we have no basis upon which to
recommend credit dealings |
No Rating |
|
This score serves as a reference to assess SC’s credit risk and
to set the amount of credit to be extended. It is calculated from a composite
of weighted scores obtained from each of the major sections of this report. The
assessed factors and their relative weights (as indicated through %) are as
follows:
Financial
condition (40%) Ownership
background (20%) Payment
record (10%)
Credit history
(10%) Market trend
(10%) Operational
size (10%)