![]()
MIRA
INFORM REPORT
|
Report Date : |
08.10.2008 |
IDENTIFICATION
DETAILS
|
Name : |
CRUTEXLAN S.L. |
|
|
|
|
Registered Office : |
Camino Can
Bages, S/N, Cp 08211, Castellar Del Valles Barcelona |
|
|
|
|
Country : |
Spain |
|
|
|
|
Financials (as on) : |
31.12.2007 |
|
|
|
|
Date of Incorporation : |
|
|
|
|
|
Legal Form : |
Limited Liability Company |
|
|
|
|
Line of Business : |
RATING &
COMMENTS
|
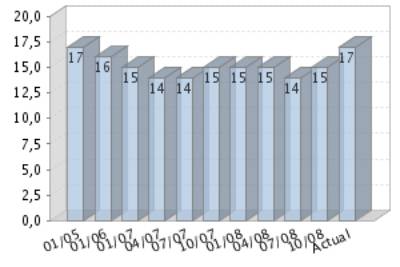
MIRA’s Rating : |
Ba |
|
RATING |
STATUS |
PROPOSED CREDIT LINE |
|
|
41-55 |
Ba |
Overall operation is considered normal. Capable to meet normal
commitments. |
Satisfactory |
|
Maximum Credit Limit : |
44.997,78 € |
|
|
|
|
Status : |
Good |
|
|
|
|
Payment Behaviour : |
Regular |
|
|
|
|
Litigation : |
Clear |
FINANCIAL REPORT
CRUTEXLAN S.L.
TAX NUMBER: B61391678
EXECUTIVE SUMMARY
Identification
Current Business Name: CRUTEXLAN S.L.
Other names: NO
Current Address: CAMINO CAN
BAGES, S/N, CP 08211, CASTELLAR DEL VALLES BARCELONA
Telephone number: 937158954 Fax: 937146944
URL: www.parafred.com Corporate e-mail: crutexlan@parafred.com
Commercial Risk
Credit Appraisal: 44.997,78 €
RAI: NO
Legal Actions: NO
Financial Information
Latest Balance sheet sales (2007): 1.391.088,60 € (MERCANTILE REGISTER)
Result: 2.504,76 €
Total Assets: 643.498,79 €
Social Capital: 133.424,69 €
Employees: 2
Commercial Information
Constitution Date: 07/05/1997
Business activity: Wholesale of
textiles
NACE Code: 5141
International Operations: Imports and
Exports
Corporate Structure
Sole Administrator:
Other Complementary Information
Latest proceeding published in BORME: 19/09/2007 Registration
of accounts
Bank Entities: Yes
Credit Appraisal
Maximum Credit
(from 0 a 6,000,000 €)
Favourable to 44.997,78 €
Rating Evolution
Financial Situation
Fiscal year2007
|
Treasury |
Excellent |
|
Indebtedness |
Average |
|
Profitability |
Null |
|
Balance |
Excellent |
Performance
|
Legal Actions |
None or Negligible |
|
Business
Trajectory |
Excellent |
RAI 
COMPANY NOT REGISTERED IN THE R.A.I.
This company is not registered in the Disputed Bills register (R.A.I.)
DATE AND TIME OF THE CONSULTATION: 29/09/2008
09:09:14
INCIDENTS

Summary
LEGAL ACTIONS: No legal
incidences registered
CLAIM FILED AGAINST THE ADMINISTRATION: No administrative
claims registered
AFFECTED BY: No significant
element.
FINANCIAL ELEMENTS AND SECTORIAL
COMPARATIVE
FINANCIAL ELEMENTS
Figures given in €
|
|
2005 (12) |
2006 (12) |
2007 (12) |
% ASSETS |
|
|
|
|
|
|
BALANCE SHEET ANALYSIS |
|
|
|
|
|
|
|
|
|
|
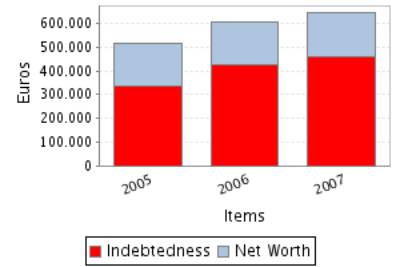
OWN FUNDS |
180.009,81 |
181.664,28 |
184.169,04 |
28,62 |
|
|
|
|
|
|
DEBT |
337.332,90 |
422.675,85 |
459.329,75 |
71,38 |
|
|
|
|
|
|
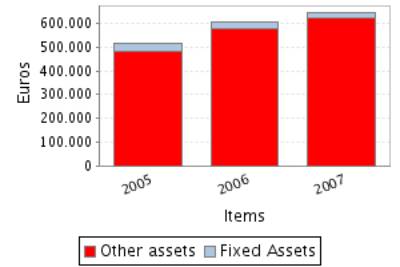
FIXED ASSETS |
34.376,07 |
28.592,11 |
20.157,47 |
3,13 |
|
|
|
|
|
|
TOTAL ASSETS |
517.342,71 |
604.340,13 |
643.498,79 |
|
|
|
|
|
|
|
|
|
|
|
|
|
|
|
|
|
|
|
2005 (12) |
2006 (12) |
2007 (12) |
% SALES |
|
|
|
|
|
|
PROFIT AND LOSS ACCOUNT ANALYSIS |
|
|
|
|
|
|
|
|
|
|
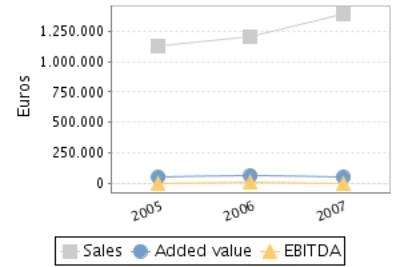
SALES |
1.129.526,06 |
1.201.751,15 |
1.391.088,60 |
|
|
|
|
|
|
|
ADDED VALUE |
49.555,69 |
60.869,80 |
47.960,29 |
3,45 |
|
|
|
|
|
|
EBITDA |
-5.493,17 |
3.239,88 |
-3.797,61 |
-0,27 |
|
|
|
|
|
|
EBIT |
-6.847,23 |
-4.735,25 |
-12.232,27 |
-0,88 |
|
|
|
|
|
|
NET RESULT |
3.730,89 |
1.654,47 |
2.504,76 |
0,18 |
|
|
|
|
|
Balance Sheets Items
Analysis
Balance Sheet Comments
Total assets of the company grew 16,82% between 2005 and 2006.
In spite of the assets’ growth, the fixed assets decreased 16,83%.
This growth has been mainly financed with a debt increase of 25,30%.
Nevertheless the net worth increased 0,92%.
Total assets of the company grew 6,48% between 2006 and 2007.
In spite of the assets’ growth, the fixed assets decreased 29,50%.
This growth has been mainly financed with a debt increase of 8,67%.
Nevertheless the net worth increased 1,38%.
Profit and Loss Account Analysis
Profit and Loss Account Comments
The company’s sales figure grew 6,39% between 2005 and 2006.
The company’s EBIT grew 30,84% between 2005 and 2006.
This evolution implies an increase in the company’s operating
profitability.
The result of these variations is an increase of the company’s Economic
Profitability of 40,80% in the analysed period, being this profitability of
-0,78% in the year 2006.
The company’s Net Result decreased in 55,65% between 2005 and 2006.
This evolution, compared to the EBIT’s performance, implies that the
financial and extraordinary activities have had a negative effect in the
company’s Financial Profitability.
The result of these variations is a reduction of the company’s
profitability of 56,06% in the analysed period, being equal to 0,91% in the
year 2006.
The company’s sales figure grew 15,76% between 2006 and 2007.
The company’s EBIT decreased in 158,32% between 2006 and 2007.
This evolution implies a reduction in the company’s operating
profitability.
The result of these variations is a decrease of the company’s Economic
Profitability of 142,62% in the analysed period, being this profitability of
-1,90% in the year 2007.
The company’s Net Result grew 51,39% between 2006 and 2007.
This evolution, compared to the EBIT’s performance, implies that the
financial and extraordinary activities have had a positive effect in the company’s
Financial Profitability.
The result of these variations is an increase of the company’s Economic
Profitability of 49,34% in the analysed period, being equal to 1,36% in the
year 2007.
ANNUAL FINANCIAL REPORT
ADDITIONAL DATA
Source: annual financial report 2007
Results Distribution
Figures given in €
|
DISTRIBUTION
BASE |
DISTRIBUTION TO |
||
|
Profit and Loss |
2.504,76 |
Retained earnings |
250,48 |
|
Carry Over |
0,00 |
Voluntary Reserve |
2.254,28 |
|
Voluntary reserves |
0,00 |
Prior years losses |
0,00 |
|
Reserves |
0,00 |
Carry Over |
0,00 |
|
Other concepts |
0,00 |
Other funds |
0,00 |
|
Total of Amounts to be distributed |
2.504,76 |
Dividends |
0,00 |
|
|
|
Other Applications |
0,00 |
COMPARATIVE SECTOR ANALYSIS
Values table
Figures expressed in %
|
|
COMPANY (2007) |
SECTOR |
DIFFERENCE |
DIFFERENCE RELATIVE |
|
|
|
|
|
|
BALANCE SHEET
ANALYSIS: % on the total assets |
|
|
|
|
|
|
|
|
|
|
OWN FUNDS |
28,62 |
37,47 |
-8,85 |
-23,63 |
|
|
|
|
|
|
DEBT |
71,38 |
62,53 |
8,85 |
14,16 |
|
|
|
|
|
|
FIXED ASSETS |
3,13 |
27,90 |
-24,77 |
-88,77 |
|
|
|
|
|
|
|
|
|
|
|
|
|
|
|
|
|
|
COMPANY (2007) |
SECTOR |
DIFFERENCE |
DIFFERENCE RELATIVE |
|
|
|
|
|
|
PROFIT AND LOSS
ACCOUNT ANALYSIS: % on the total operating income |
|
|
|
|
|
|
|
|
|
|
SALES |
100,00 |
98,82 |
1,18 |
1,20 |
|
|
|
|
|
|
ADDED VALUE |
3,45 |
20,05 |
-16,60 |
-82,80 |
|
|
|
|
|
|
EBIT |
-0,88 |
3,61 |
-4,49 |
-124,36 |
|
|
|
|
|
|
NET RESULT |
0,18 |
2,18 |
-2,00 |
-91,74 |
|
|
|
|
|
Sector Composition
Compared sector (NACE): 514
Number of companies: 3917
Size (Sales Figure) : 0 - 2.800.000,00
Euros
Comments on the sectorial comparative
Compared to its sector the assets of the companies show an inferior proportion
of fixed assets. Specifically the difference with the sector average is -24,77%
, which means a relative difference of -88,77% .
In liabilities composition the company appeals on a wider scale to self
financing, being the proportion of net worth of 8,85% inferior, which means a
relative difference of 23,63% 8,85% more than the sector, which means a
difference of 14,16% .
The proportion that the sales mean to the company’s total ordinary
income is 100,00%, 1,18% higher than in the sector, which means a relative
difference of 1,20% .
The company’s EBIT was negative and equal to-0,88% with regard to the
total ordinary income, 4,49% less than the sector, which means a relative
difference of 124,36% .
The company’s capacity to generate operating income is equal to that of
the sector as its ratio EBIT/Sales is also equal.
The company’s net result was positive and equal to 0,18% with regard to
the total ordinary income, 2,00% less than the sector, which means a relative
difference of 91,74% .
The financial and extraordinary results and the tax impact have had a
negative impact on the Net result in the company with a worse behaviour than in
the sector; as a consequence, the company shows a worse Net Result/EBIT ratio
(REBEmpresa vs. REBSector).
ADDRESSES
Current Legal Seat Address:
CAMINO CAN BAGES, S/N
08211 CASTELLAR DEL VALLES BARCELONA
Previous Seat Address:
STREET MARCONI, 43
08210
BARBERA DEL VALLES BARCELONA
Characteristics of the current address
Type of premises: store
Property: owned; with no official confirmation
Local Situation: secondary
CORPORATE STRUCTURE
ADMINISTRATIVE LINKS
Main Board members, Directors and Auditor ![]()
|
POSITION |
SURNAMES AND
NAME |
APPOINTMENT DATE |
|
SOLE ADMINISTRATOR |
CRUSELLAS LOU JOSE |
01/07/1997 |
Functional Managers
|
POSITION |
SURNAMES AND
NAME |
|
General Manager |
CRUSELLAS LOU JOSE |
|
Financial Manager |
CRUSELLAS LOU JOSE |
|
Commercial Manager |
LOPEZ JAIME |
FINANCIAL LINKS
|
|
BUSINESS NAME |
CIF / COUNTRY |
% |
SOURCE |
DATA INF. |
|
|
CRUSELLAS LOU JOSE |
|
Indet. |
OWN SOURCES |
01/10/2008 |
|
|
MORALES GUARCH SILVIA |
|
Indet. |
OWN SOURCES |
01/10/2008 |
CREDIT INFORMATION
Constitution Date: 07/05/1997
Business activity 
Activity: Wholesale of textiles
NACE Code: 5141
NACE Activity: Wholesale of
textiles
Business: LA COMPRAVENTA DE MATERIAS TEXTILES DE
RECUPERACION.
Employees 
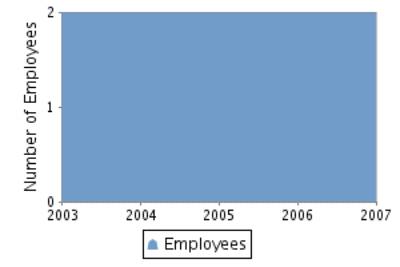
Number of total employees: 2 (2008)
Number of fixed employees: 100,00%
Number of temporary employees: 0,00%
Employees evolution
COMMERCIAL OPERATIONS 
PURCHASES
Payments (estimated):
Import Percentage: 30%
Imports from: INDIA
SALES
Collection (estimated):
On a credit basis: 100%
Export Percentage: 20%
Exports to: INDIA
National Distribution: 80%
Banks 
|
ENTITY |
BRANCH |
ADDRESS |
TOWN OR CITY |
PROVINCE |
|
BANCO DE SABADELL, S.A. |
|
|
CASTELLAR DEL VALLES |
|
|
CAJA DE AHORROS
Y PENSIONES DE BARCELONA |
|
|
CASTELLAR DEL VALLES |
|
|
BANCO DE SABADELL, S.A. |
0900 |
PZ SANT ROC 000020 |
SABADELL |
Barcelona |
3 bank entities registered
LEGAL STRUCTURE
Constitution Data
Register Date: 07/05/1997
Register town: Barcelona
Announcement number: 208030
Legal form: LIMITED LIABILITY
COMPANY
Social Capital: 3.005,06 €
Current structure data 
Current Legal Form: LIMITED LIABILITY
COMPANY
Current Capital: 133.424,69 €
Legal Aspects
Obligation to fill in Financial
Statements: YES
Chamber census: YES (2006)
Listed on a Stock Exchange: NO
B.O.R.M.E.(Official Companies
Registry Gazette) 
Other Proceedings published
|
PROCEEDINGS |
DATE |
NOTICE NUM. |
TRADE REG. |
|
Registration of
accounts (2006) Individual |
19/09/2007 |
558650 |
Barcelona |
|
Registration of
accounts (2005) Individual |
28/09/2006 |
581309 |
Barcelona |
|
Registration of
accounts (2004) Individual |
31/10/2005 |
812498 |
Barcelona |
|
Registration of
accounts (2003) Individual |
20/10/2004 |
667674 |
Barcelona |
|
Registration of accounts (2002) Individual |
03/11/2003 |
757469 |
Barcelona |
FINANCIAL INFORMATION
The information on the last account contained in this report is
extracted from the Mercantile Register file of the legal address of the Company
and dated 22/09/2008.
BALANCE SHEET
Assets
Figures given in €
|
|
31/12/2005 (12) |
31/12/2006 (12) |
31/12/2007 (12) |
|
A) DUE FROM SHAREHOLDERS FOR UNCALLED CAPITAL |
|
|
|
|
B) FIXED ASSETS |
34.376,07 |
28.592,11 |
20.157,47 |
|
I. Incorporation costs |
|
|
|
|
II. Intangible fixed assets |
12.764,93 |
8.155,47 |
|
|
III. Tangible fixed assets |
14.423,04 |
13.248,54 |
12.969,37 |
|
IV. Financial fixed assets |
7.188,10 |
7.188,10 |
7.188,10 |
|
V.Owners equity |
|
|
|
|
VI.Long term trade liabilities |
|
|
|
|
C) DEFERRED EXPENSES |
71,44 |
|
|
|
D) CURRENT ASSETS |
482.895,20 |
575.748,02 |
623.341,32 |
|
I. Shareholders by required outlays |
|
|
|
|
II. Stocks |
172.166,40 |
193.336,40 |
206.336,40 |
|
III. Debtors |
310.728,80 |
382.411,62 |
386.118,78 |
|
IV. Temporary financial investment |
|
|
|
|
V. Short-term own shares |
|
|
|
|
VI. Treasury |
|
|
30.886,14 |
|
VII. Periodification adjustments |
|
|
|
|
ASSETS (A + B + C + D) |
517.342,71 |
604.340,13 |
643.498,79 |
Assets composition
Liabilities
Figures given in €
|
|
31/12/2005 (12) |
31/12/2006 (12) |
31/12/2007 (12) |
|
A) SHAREHOLDERS EQUITY |
180.009,81 |
181.664,28 |
184.169,04 |
|
I. Share capital |
133.424,69 |
133.424,69 |
133.424,69 |
|
II. Issue bonus |
|
|
|
|
III.Revaluation reserve |
|
|
|
|
IV.Reserves |
42.854,23 |
46.585,12 |
48.239,59 |
|
Capital adjustments in Euros |
|
|
|
|
Sundry reserves |
42.854,23 |
46.585,12 |
48.239,59 |
|
V.Results from previous years |
|
|
|
|
VI.Profit and Losses |
3.730,89 |
1.654,47 |
2.504,76 |
|
VII.Dividend paid during the year |
|
|
|
|
VIII.Own shares for capital reduction |
|
|
|
|
B) DEFERRED INCOME |
|
|
|
|
C) PROVISIONS FOR LIABILITIES AND EXPENSES |
|
|
|
|
D) LONG TERM LIABILITIES |
|
|
0,02 |
|
E) SHORT TERM LIABILITIES |
337.332,90 |
422.675,85 |
459.329,73 |
|
F) SHORT TERM PROVISIONS FOR LIABILITIES AND
EXPENSES |
|
|
|
|
LIABILITIES (A + B + C + D + E + F) |
517.342,71 |
604.340,13 |
643.498,79 |
Liabilities
Composition
PROFIT AND LOSS ACCOUNT
Itams of the Profit and Loss Account
Figures given in €
|
|
31/12/2005 (12) |
31/12/2006 (12) |
31/12/2007 (12) |
|
A) EXPENSES (A.1 a A.15) |
1.140.340,98 |
1.212.752,08 |
1.407.130,46 |
|
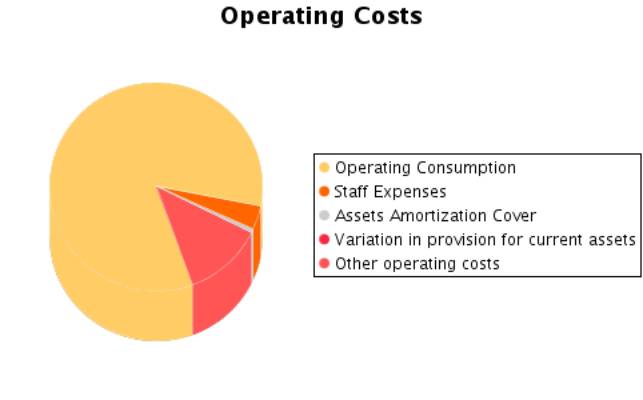
A.1.Operating costs |
920.133,09 |
983.152,64 |
1.173.178,09 |
|
A.2. Labour cost |
55.048,86 |
57.629,92 |
51.757,90 |
|
Wages |
45.663,89 |
48.775,25 |
41.627,05 |
|
Social security expenses |
9.384,97 |
8.854,67 |
10.130,85 |
|
A.3. Assets depreciation |
7.658,87 |
7.955,27 |
8.434,66 |
|
A.4. Variation in provision for current assets |
-6.304,81 |
19,86 |
|
|
A.5. Other operating costs |
159.837,28 |
158.714,52 |
169.950,22 |
|
A.I. OPERATING RESULT (B.1-A.1-A.2-A.3-A.4-A.5) |
|
|
|
|
A.6.Financial expenses and similar |
2.254,36 |
2.611,29 |
|
|
Debts with related companies |
2.211,00 |
423,50 |
|
|
Debts with associated companies |
|
|
|
|
Other companies debts By debts with third parties and similar expenses |
43,36 |
2.187,79 |
|
|
Losses from financial investments |
|
|
|
|
A.7. Variation in financial investment provision |
|
|
|
|
A.8.Negative exchange difference |
|
1.959,52 |
3.507,94 |
|
A.II.POSITIVE FINANCIAL RESULTS
(B.2+B.3-A.6-A.7-A.8) |
7.014,52 |
7.098,75 |
1.592,75 |
|
A.III.PROFIT FROM ORDINARY ACTIVITIES
(A.I+A.II-B.I-B.II) |
167,29 |
2.363,50 |
|
|
A.9. Variation in provision in fixed assets |
|
|
|
|
A.10. Losses in fixed assets |
|
|
|
|
A.11. Losses from own shares and bonds |
|
|
|
|
A.12. Extraordinary charges |
114,37 |
|
|
|
A.13.Other exercises’ expenses and losses |
|
|
|
|
A.IV.POSITIVE
EXTRAORDINARY RESULT (B.4+B.5+B.6+B.7+B.8-A.9-A.10-A.11-A.12-A.13) |
5.162,56 |
0,03 |
13.445,93 |
|
A.V.PROFIT BEFORE
TAXES (A.III+A.IV-B.III-B.IV) |
5.329,85 |
2.363,53 |
2.806,41 |
|
A.14.Corporate
Taxes |
1.598,96 |
709,06 |
301,65 |
|
A.15. Other
taxes |
|
|
|
|
A.VI.EXERCISE
RESULT (PROFIT) (A.V-A.14-A.15) |
3.730,89 |
1.654,47 |
2.504,76 |
|
B) INCOMES (B.1 a
B.8) |
1.144.071,87 |
1.214.406,55 |
1.409.635,22 |
|
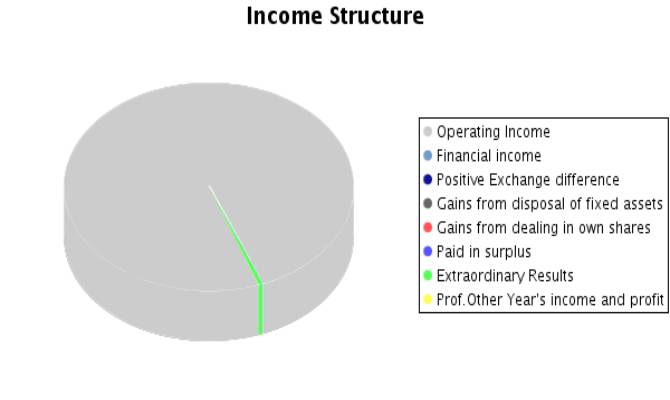
B.1.Operating income |
1.129.526,06 |
1.202.736,96 |
1.391.088,60 |
|
Turnover |
1.129.526,06 |
1.201.751,15 |
1.391.088,60 |
|
Other operating income |
|
985,81 |
|
|
B.I.OPERATING LOSSES (A.1+A.2+A.3+A.4+A.5-B.1) |
6.847,23 |
4.735,25 |
12.232,27 |
|
B.2.Financial Income |
4.125,32 |
3.920,34 |
4.628,59 |
|
From affiliated companies |
3.614,84 |
3.759,84 |
4.175,70 |
|
From associated companies |
|
|
18,68 |
|
Other |
510,48 |
160,50 |
434,21 |
|
Gains from investments |
|
|
|
|
B.3. Positive change difference |
5.143,56 |
7.749,22 |
472,10 |
|
B.II. NEGATIVE FINANCIAL RESULTS
(A.6+A.7+A.8-B.2-B.3) |
|
|
|
|
B.III.LOSSES
FROM ORDINARY ACTIVITIES (B.I+B.II-A.I-A.II) |
|
|
10.639,52 |
|
B.4.B.9. Gains
from disposal of fixed assets |
5.192,83 |
|
|
|
B.5.Gains from
dealing in own shares |
|
|
|
|
B.6. Paid in
surplus |
|
|
|
|
B.7.
Extraordinary income |
84,10 |
0,03 |
13.445,93 |
|
B.8.Other year’s
income and profits |
|
|
|
|
B.IV.NEGATIVE
EXTRAORDINARY LOSSES (A.9+A.10+A.11+A.12+A.13-B.4-B.5-B.6-B.7-B.8) |
|
|
|
|
B.V.LOSS BEFORE
TAXES (B.III+B.IV-A.III-A.IV) |
|
|
|
|
B.VI.EXERCISE
RESULTS (LOSS) (B.V+A.14+A.15) |
|
|
|
Composition of the
Profit and Loss Account
FINANCIAL BALANCE
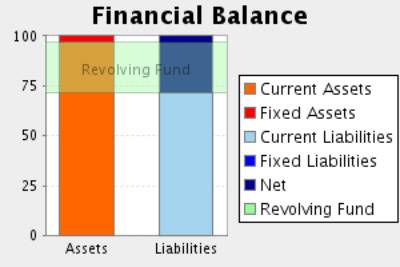
Here the Main Capital Amounts of the company and the Revolving Fund
Evolution are analysed.
Financial Balance Table
Figures given in €
|
|
31/12/2005 (12) |
% |
31/12/2006 (12) |
% |
31/12/2007 (12) |
% |
|
A) DUE FROM
SHAREHOLDERS FOR UNCALLED CAPITAL |
|
|
|
|
|
|
|
B) FIXED ASSETS |
34.376,07 |
6,64 |
28.592,11 |
4,73 |
20.157,47 |
3,13 |
|
C) DEFERRED
EXPENSES |
71,44 |
0,01 |
|
|
|
|
|
D) CURRENT
ASSETS |
482.895,20 |
93,34 |
575.748,02 |
95,27 |
623.341,32 |
96,87 |
|
ASSETS (A + B +
C + D) |
517.342,71 |
|
604.340,13 |
|
643.498,79 |
|
|
|
||||||
|
A) SHAREHOLDERS
EQUITY |
180.009,81 |
34,80 |
181.664,28 |
30,06 |
184.169,04 |
28,62 |
|
B) DEFERRED
INCOME |
|
|
|
|
|
|
|
C) PROVISIONS
FOR LIABILITIES AND EXPENSES |
|
|
|
|
|
|
|
D) LONG TERM
LIABILITIES |
|
|
|
|
0,02 |
0,00 |
|
E) SHORT TERM
LIABILITIES |
337.332,90 |
65,20 |
422.675,85 |
69,94 |
459.329,73 |
71,38 |
|
F) SHORT TERM
PROVISIONS FOR LIABILITIES AND EXPENSES |
|
|
|
|
|
|
|
LIABILITIES (A + B + C + D + E + F) |
517.342,71 |
|
604.340,13 |
|
643.498,79 |
|
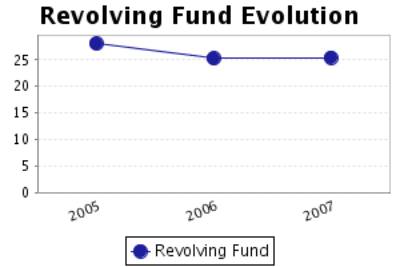
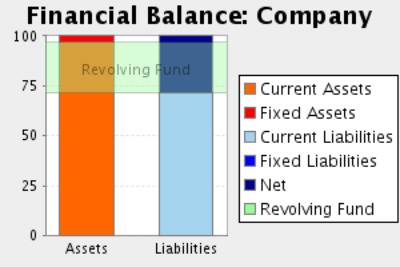
Financial Balance
Composition
Comments on Financial Balance
In the 2005, the assets of the company were formed in 6,66% of Fixed
Assets and in 93,34% of Current Assets.This assets were financed in 34,80% with
own capitals and in 65,20% with current liabilities.
The result of this financial structure is a positive turnover fund of
145.562,30 Euros, which is equivalent to 28,14% proportion of the
company’s total assets.
In the 2006, the assets of the company were formed in 4,73% of Fixed
Assets and in 95,27% of Current Assets.This assets were financed in 30,06% with
own capitals and in 69,94% with current liabilities.
The result of this financial structure is a positive turnover fund of
153.072,17 Euros, which is equivalent to 25,33% proportion of the
company’s total assets.
This measure has increased with respect to the previous exercise in
5,16% having, however, diminished its proportion with respect to the total
assets of the company.
In the 2007, the assets of the company were formed in 3,13% of Fixed
Assets and in 96,87% of Current Assets.This assets were financed in 28,62% with
own capitals and in 71,38% with current liabilities.
The result of this financial structure is a positive turnover fund of
164.011,59 Euros, which is equivalent to 25,49% proportion of the
company’s total assets.
This measure has increased with respect to the previous exercise in
7,15% having also increased its proportion with respect to the total assets of
the company.
RATIOS
Main Ratios
|
|
31/12/2005 (12) |
31/12/2006 (12) |
31/12/2007 (12) |
|
STRUCTURAL RATIOS |
|
|
|
|
Management fund |
145.562,30 |
153.072,17 |
164.011,59 |
|
Indebtedness (%) |
65,20 |
69,94 |
71,38 |
|
External Funds on Net Worth |
1,87 |
2,33 |
2,49 |
|
GENERAL ACTIVITY RATIO |
|
|
|
|
Turnover Increase (%) |
2,92 |
6,39 |
15,76 |
|
Added value growth (%) |
-30,18 |
22,83 |
-21,21 |
|
Cash Flow |
5.084,95 |
9.629,60 |
10.939,42 |
|
Labour Productivity |
0,90 |
1,06 |
0,93 |
|
Assets turnover |
2,18 |
1,99 |
2,16 |
|
Breakdown Point |
1.166.461,99 |
1.228.673,51 |
1.469.176,49 |
|
Security Margin of the Breakdown Point (%) |
-3,27 |
-2,16 |
-5,61 |
|
ACTIVITY RATIOS |
|
|
|
|
Average Collection Period |
99 |
115 |
100 |
|
Inventory Turnover Period |
55 |
58 |
53 |
|
SOLVENCY RATIOS |
|
|
|
|
Payback Capacity |
0,02 |
0,02 |
0,02 |
|
Assets Guarantee |
1,53 |
1,43 |
1,40 |
|
Short Term Debts Proportion (%) |
100,00 |
100,00 |
100,00 |
|
Interest Coverage |
-4,20 |
-0,78 |
|
|
LIQUIDITY RATIOS |
|
|
|
|
Current Ratio |
1,43 |
1,36 |
1,36 |
|
Immediate liquidity |
|
|
0,07 |
|
Sales on Current Assets |
842 |
751 |
803 |
Results Analysis
Ratios
|
|
31/12/2005 (12) |
31/12/2006 (12) |
31/12/2007 (12) |
|
Economic profitability (%) |
-1,32 |
-0,78 |
-1,90 |
|
Operating Profitability (%) |
-0,61 |
-0,39 |
-0,88 |
|
Equity gearing |
-0,07 |
-1,66 |
3,04 |
|
Financial profitability (%) |
2,07 |
0,91 |
1,36 |
|
General Profitability (%) |
0,33 |
0,14 |
0,18 |
Comments on the
Results Analysis Ratios
The economic profitability in the year2006The economic profitability in
the year -0,78%, derived from a negative operating profitability of -0,39%.The
assets turnover was 1,99%.
The economic profitability in the year has improved from -1,32% up to the
current value, in spite of remaining in negative. This improvement has been
mainly due to the variation in operating profitability, from -0,61% to the
current level of -0,39% as the fall in assets turnover from2,18 to level 1,99,
which reduces the impact of negative margins.
Financial profitability on 2006 achieved a 0,91%.
The company’s financial structure has favoured its profitability with an
indebtedness level of -1,66.
The general profitability on 2006 achieved a 0,14%.
The economic profitability in the year2007The economic profitability in
the year -1,90%, derived from a negative operating profitability of -0,88%.The
assets turnover was 2,16%.
The economic profitability in the year has worsen from -0,78% to the
current value, going deeper into the negative values. This evolution means a
dangerous situation for the company.Thos worsening has been due to the
combination of a reduction in operating profitability , from -0,39% to the
current level of -0,88% and an increase in assets turnover to a value of 1,99
to level 2,16, which instigate negative margins.
Financial profitability on 2007 achieved a 1,36%.
The company’s financial structure has restrained its financial
profitability with an indebtedness level of 3,04.
The general profitability on 2007 achieved a 0,18%.
SECTORIAL ANÁLYSIS
Large Capital Amounts and Financial Balance
Figures given in %
|
|
COMPANY (2007) |
SECTOR |
DIFFERENCE |
DIFFERENCE RELATIVE |
|
|
|
|
|
|
ASSETS |
|
|
|
|
|
|
|
|
|
|
A) DUE FROM SHAREHOLDERS
FOR UNCALLED CAPITAL |
|
0,07 |
|
|
|
|
|
|
|
|
B) FIXED ASSETS |
3,13 |
27,90 |
-24,78 |
-88,78 |
|
|
|
|
|
|
C) DEFERRED
EXPENSES |
|
0,39 |
|
|
|
|
|
|
|
|
D) CURRENT
ASSETS |
96,87 |
71,63 |
25,24 |
35,23 |
|
|
|
|
|
|
ASSETS (A + B + C + D) |
100 |
100 |
|
|
|
|
|
|
|
|
|
|
|
|
|
|
|
|
|
|
|
|
COMPANY (2007) |
SECTOR |
DIFFERENCE |
DIFFERENCE RELATIVE |
|
|
|
|
|
|
LIABILITIES |
|
|
|
|
|
|
|
|
|
|
A) SHAREHOLDERS
EQUITY |
28,62 |
37,11 |
-8,49 |
-22,87 |
|
|
|
|
|
|
B) DEFERRED
INCOME |
|
0,37 |
|
|
|
|
|
|
|
|
C) PROVISIONS
FOR LIABILITIES AND EXPENSES |
|
0,10 |
|
|
|
|
|
|
|
|
D) LONG TERM
LIABILITIES |
0,00 |
13,57 |
-13,57 |
-100,00 |
|
|
|
|
|
|
E) SHORT TERM
LIABILITIES |
71,38 |
48,78 |
22,60 |
46,33 |
|
|
|
|
|
|
F) SHORT TERM
PROVISIONS FOR LIABILITIES AND EXPENSES |
|
0,08 |
|
|
|
|
|
|
|
|
LIABILITIES (A +
B + C + D + E + F) |
100 |
100 |
|
|
|
|
|
|
|
Sectorial Financial
Balance Comparison
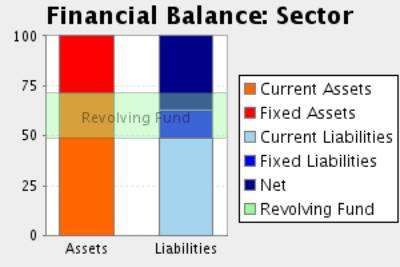
Comments to the Sectorial Analysis
In the 2007, the assets of the company were formed in 3,13% of fixed
assets and in 96,87Current Assets % In the sector, the proportion of fixed
assets was of 28,37%, 88,97% superior, and the proportion of current assets was
of 71,63%, 35,23% inferior.
The assets were financed in the company in 28,62% with own capitals and
in 71,38% with current liabilities In the sector, the self financing
represented 37,47%, 23,63% superiorAnd, short term liabilities represented in
the sector an average of 48,86% financing, with a relative difference of 46,10%
in favour of the company
The result of this company’s financial structure is a turnover fund that
represents 25,49% of the total assets; in the sector, this same proportion is
22,78%, therefore, we can say that the company’s turnover fund is 11,92% higher
than the one in of the sector.
Analytical Account of Results
Figures given in %
|
|
COMPANY (2007) |
SECTOR |
DIFFERENCE |
DIFFERENCE RELATIVE |
|
Turnover |
100,00 |
98,82 |
1,18 |
1,20 |
|
Other operating income |
|
1,18 |
|
|
|
Production Value |
100,00 |
100,00 |
0,00 |
0,00 |
|
Operating expenses |
84,34 |
66,55 |
17,79 |
26,72 |
|
Other operation expenses |
12,22 |
13,40 |
-1,18 |
-8,78 |
|
Added value |
3,45 |
20,05 |
-16,60 |
-82,79 |
|
Labour cost |
3,72 |
14,67 |
-10,95 |
-74,65 |
|
Gross Economic Result |
-0,27 |
5,38 |
-5,65 |
-105,02 |
|
Assets depreciation |
0,61 |
1,58 |
-0,97 |
-61,42 |
|
Variation in provision for current assets and bad debt losses |
|
0,18 |
|
|
|
Net Economic Result |
-0,88 |
3,61 |
-4,49 |
-124,38 |
|
Financial income |
0,37 |
0,37 |
0,00 |
-0,80 |
|
Financial Charges |
0,25 |
1,40 |
-1,15 |
-82,12 |
|
Variation in financial investment provision |
|
0,00 |
|
|
|
Ordinary Activities Result |
-0,76 |
2,58 |
-3,34 |
-129,41 |
|
Extraordinary income |
0,97 |
0,65 |
0,32 |
48,32 |
|
Extraordinary charges |
|
0,17 |
|
|
|
Variation in provision in fixed assets |
|
0,00 |
|
|
|
Results before Taxes |
0,20 |
3,06 |
-2,86 |
-93,47 |
|
Corporate taxes |
0,02 |
0,88 |
-0,86 |
-97,74 |
|
Net Result |
0,18 |
2,18 |
-2,00 |
-91,74 |
|
Assets depreciation |
0,61 |
1,58 |
-0,97 |
-61,42 |
|
Change of Provisions |
|
0,19 |
|
|
|
Net Self-Financing |
0,79 |
3,95 |
-3,16 |
-80,01 |
Main Ratios
|
|
COMPANY (2007) |
PTILE25 |
PTILE50 |
PTILE75 |
|
STRUCTURAL RATIOS |
|
|
|
|
|
Management fund |
164.011,59 |
14,07 |
79,92 |
213,78 |
|
Indebtedness (%) |
71,38 |
50,48 |
70,90 |
84,93 |
|
External Funds on Net Worth |
2,49 |
1,02 |
2,44 |
5,64 |
|
GENERAL ACTIVITY RATIO |
|
|
|
|
|
Turnover Increase (%) |
15,76 |
-10,06 |
0,34 |
11,18 |
|
Added value growth (%) |
-21,21 |
-8,16 |
3,00 |
16,20 |
|
Cash Flow |
10.939,42 |
7,65 |
20,38 |
47,02 |
|
Labour Productivity |
0,93 |
1,14 |
1,30 |
1,61 |
|
Assets turnover |
2,16 |
0,97 |
1,47 |
2,10 |
|
Breakdown Point |
1.469.176,49 |
313.403,56 |
651.298,66 |
1.192.759,02 |
|
Security Margin of the Breakdown Point (%) |
-5,61 |
3,74 |
8,94 |
16,51 |
|
ACTIVITY RATIOS |
|
|
|
|
|
Average Collection Period |
100 |
30 |
68 |
114 |
|
Inventory Turnover Period |
53 |
22 |
60 |
128 |
|
SOLVENCY RATIOS |
|
|
|
|
|
Payback Capacity |
0,02 |
0,03 |
0,07 |
0,14 |
|
Assets Guarantee |
1,40 |
1,17 |
1,40 |
1,97 |
|
Short Term Debts Proportion (%) |
100,00 |
73,96 |
94,93 |
100,00 |
|
LIQUIDITY RATIOS |
|
|
|
|
|
Current Ratio |
1,36 |
1,08 |
1,35 |
1,96 |
|
Immediate liquidity |
0,07 |
0,04 |
0,16 |
0,45 |
|
Sales on Current Assets |
803 |
475 |
703 |
1.011 |
Results Analysis
Ratios
|
|
COMPANY (2007) |
PTILE25 |
PTILE50 |
PTILE75 |
|
Economic profitability (%) |
-1,90 |
1,76 |
4,09 |
7,79 |
|
Operating Profitability (%) |
-0,88 |
1,22 |
2,84 |
5,52 |
|
Equity gearing |
3,04 |
1,33 |
2,23 |
4,21 |
|
Financial profitability (%) |
1,36 |
2,70 |
7,63 |
16,46 |
|
General Profitability (%) |
0,18 |
0,49 |
1,28 |
3,08 |
NOTES
Linked by its board members to B61466306
CRUMO 97 S.L.
FOREIGN EXCHANGE
RATES
|
Currency |
Unit
|
Indian Rupees |
|
US Dollar |
1 |
Rs.48.72 |
|
UK Pound |
1 |
Rs.82.17 |
|
Euro |
1 |
Rs..65.90 |
RATING
EXPLANATIONS
|
RATING |
STATUS |
PROPOSED CREDIT LINE |
|
|
>86 |
Aaa |
Possesses an extremely sound financial base with the strongest capability
for timely payment of interest and principal sums |
Unlimited |
|
71-85 |
Aa |
Possesses adequate working capital. No caution needed for credit
transaction. It has above average (strong) capability for payment of interest
and principal sums |
Large |
|
56-70 |
A |
Financial & operational base are regarded healthy. General
unfavourable factors will not cause fatal effect. Satisfactory capability for
payment of interest and principal sums |
Fairly Large |
|
41-55 |
Ba |
Overall operation is considered normal. Capable to meet normal
commitments. |
Satisfactory |
|
26-40 |
B |
Unfavourable & favourable factors carry similar weight in credit
consideration. Capability to overcome financial difficulties seems comparatively
below average. |
Small |
|
11-25 |
Ca |
Adverse factors are apparent. Repayment of interest and principal sums
in default or expected to be in default upon maturity |
Limited with
full security |
|
<10 |
C |
Absolute credit risk exists. Caution needed to be exercised |
Credit not
recommended |
|
NR |
In view of the lack of information, we have no basis upon which to
recommend credit dealings |
No Rating |
|
This score serves as a reference to assess SC’s credit risk
and to set the amount of credit to be extended. It is calculated from a
composite of weighted scores obtained from each of the major sections of this
report. The assessed factors and their relative weights (as indicated through
%) are as follows:
Financial
condition (40%) Ownership
background (20%) Payment
record (10%)
Credit history
(10%) Market trend
(10%) Operational
size (10%)