![]()
MIRA INFORM
REPORT
|
Report Date : |
13.10.2008 |
IDENTIFICATION
DETAILS
|
Name : |
TORCIDOS SINTETICOS S.L. |
|
|
|
|
Registered Office : |
Poligono Industrial
Moli (Naves A 2 Y A 3), Cp 08359, Sant Iscle De
Vallalta Barcelona |
|
|
|
|
Country : |
Spain |
|
|
|
|
Financials (as on) : |
31.12.2007 |
|
|
|
|
Date of Incorporation : |
|
|
|
|
|
Legal Form : |
Limited Liability Company |
|
|
|
|
Line of Business : |
Throwing
and Preparation of Silk including from Noils and Throwing and Texturing of
Systhe. |
RATING &
COMMENTS
|
MIRA’s Rating : |
Ba |
|
RATING |
STATUS |
PROPOSED CREDIT LINE |
|
|
41-55 |
Ba |
Overall operation is considered normal. Capable to meet normal
commitments. |
Satisfactory |
|
Status : |
Good |
|
|
|
|
Payment Behaviour : |
Regular |
|
|
|
|
Litigation : |
Clear |
FINANCIAL REPORT
TORCIDOS SINTETICOS S.L.
TAX NUMBER: B62087192
EXECUTIVE SUMMARY
Identification
Current Business Name: TORCIDOS
SINTETICOS S.L.
Commercial Name: SINTETIC
Other names: NO
Current Address: POLIGONO INDUSTRIAL
MOLI (NAVES A 2 Y A 3), CP 08359, SANT ISCLE DE
VALLALTA BARCELONA
Branches: 2
Telephone number : 937946017 Fax: 937946145
Corporate e-mail: sintetic@sintetic.biz
Commercial Risk
RAI: NO
Legal Actions: NO
Financial
Information
Latest Balance sheet sales (2007): 2.469.143,08 € (MERCANTILE REGISTER)
Result: 38.571,35 €
Total Assets:
2.577.993,78 €
Social Capital: 243.015,00 €
Employees: 12
Commercial Information
Constitution Date: 21/10/1999
Business activity: Throwing
& preparation of silk including from noils & throwing & texturing
of systhe.
NACE Code: 1714
International Operations: Imports and
Exports
Corporate Structure
Administrator:
Other Complementary Information
Latest proceeding published in BORME: 25/08/2008 Registration
of accounts
Bank Entities: Yes
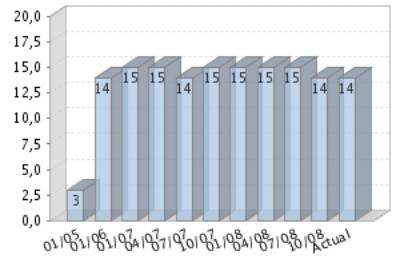
Rating Evolution
Financial Situation
Fiscal year2007
|
Treasury |
Average |
|
Indebtedness |
Important |
|
Profitability |
Average |
|
Balance |
Good |
Performance
|
Legal Actions |
None or Negligible |
|
Business
Trajectory |
Excellent |
RAI 
COMPANY NOT REGISTERED IN THE R.A.I.
This company is not registered in the Disputed Bills register (R.A.I.)
DATE AND TIME OF THE CONSULTATION: 03/10/2008
09:10:30
INCIDENTS

Summary
LEGAL ACTIONS: No legal
incidences registered
CLAIM FILED AGAINST THE ADMINISTRATION: No administrative
claims registered
AFFECTED BY: No significant
element.
FINANCIAL ELEMENTS AND SECTORIAL
COMPARATIVE
FINANCIAL ELEMENTS
Figures given in €
|
|
2005 (12) |
2006 (12) |
2007 (12) |
% ASSETS |
|
|
|
|
|
|
BALANCE SHEET
ANALYSIS |
|
|
|
|
|
|
|
|
|
|
OWN FUNDS |
226.171,13 |
257.006,63 |
289.084,69 |
11,21 |
|
|
|
|
|
|
DEBT |
1.227.840,71 |
1.719.055,88 |
2.288.909,09 |
88,79 |
|
|
|
|
|
|
FIXED ASSETS |
535.226,41 |
834.376,14 |
1.001.880,68 |
38,86 |
|
|
|
|
|
|
TOTAL ASSETS |
1.454.011,84 |
1.976.062,51 |
2.577.993,78 |
|
|
|
|
|
|
|
|
|
|
|
|
|
|
|
|
|
|
|
2005 (12) |
2006 (12) |
2007 (12) |
% SALES |
|
|
|
|
|
|
PROFIT AND LOSS
ACCOUNT ANALYSIS |
|
|
|
|
|
|
|
|
|
|
SALES |
1.417.797,50 |
1.795.448,23 |
2.469.143,08 |
|
|
|
|
|
|
|
ADDED VALUE |
419.902,20 |
473.748,41 |
591.180,30 |
23,94 |
|
|
|
|
|
|
EBITDA |
121.585,88 |
124.628,93 |
179.671,75 |
7,28 |
|
|
|
|
|
|
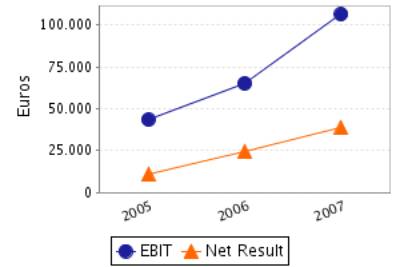
EBIT |
43.440,24 |
65.184,44 |
106.419,24 |
4,31 |
|
|
|
|
|
|
NET RESULT |
10.609,80 |
24.342,21 |
38.571,35 |
1,56 |
|
|
|
|
|
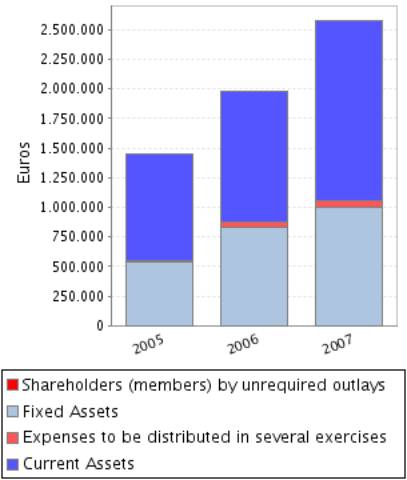
Balance Sheets Items
Analysis
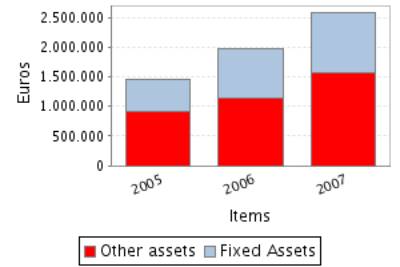
Balance Sheet Comments
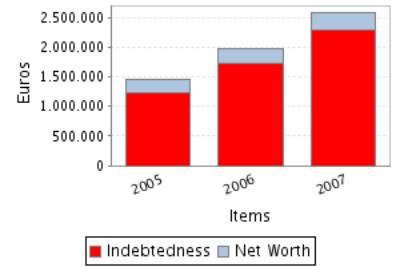
Total assets of the company grew 35,90% between 2005 and 2006.
This growth is a consequence of the fixed assets increase of 55,89%.
This growth has been mainly financed with a debt increase of 40,01%.
Nevertheless the net worth increased 13,63%.
Total assets of the company grew 30,46% between 2006 and 2007.
This growth has been inferior in the case of the fixed assets that
increased just in 20,08%.
This growth has been mainly financed with a debt increase of 33,15%.
Nevertheless the net worth increased 12,48%.
Profit and Loss Account Analysis
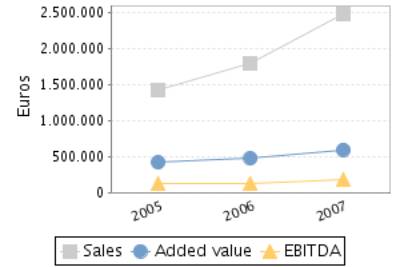
Profit and Loss Account Comments
The company’s sales figure grew 26,64% between 2005 and 2006.
The company’s EBIT grew 50,06% between 2005 and 2006.
This evolution implies an increase in the company’s operating
profitability.
The result of these variations is an increase of the company’s Economic
Profitability of 10,41% in the analysed period, being this profitability of
3,30% in the year 2006.
The company’s Net Result grew 129,43% between 2005 and 2006.
This evolution, compared to the EBIT’s performance, implies that the
financial and extraordinary activities have had a positive effect in the
company’s Financial Profitability.
The result of these variations is an increase of the company’s Economic
Profitability of 101,91% in the analysed period, being equal to 9,47% in the
year 2006.
The company’s sales figure grew 37,52% between 2006 and 2007.
The company’s EBIT grew 63,26% between 2006 and 2007.
This evolution implies an increase in the company’s operating
profitability.
The result of these variations is an increase of the company’s Economic
Profitability of 25,14% in the analysed period, being this profitability of
4,13% in the year 2007.
The company’s Net Result grew 58,45% between 2006 and 2007.
This evolution, compared to the EBIT’s performance, implies that the
financial and extraordinary activities have had a negative effect in the
company’s Financial Profitability.
The result of these variations is an increase of the company’s Economic
Profitability of 40,87% in the analysed period, being equal to 13,34% in the
year 2007.
ANNUAL FINANCIAL REPORT ADDITIONAL DATA
Source: annual financial report 2007
Results Distribution
Figures given in €
|
DISTRIBUTION
BASE |
DISTRIBUTION TO |
||
|
Profit and Loss |
38.571,35 |
Retained earnings |
3.857,14 |
|
Carry Over |
0,00 |
Voluntary Reserve |
28.041,16 |
|
Voluntary reserves |
0,00 |
Prior years losses |
6.673,05 |
|
Reserves |
0,00 |
Carry Over |
0,00 |
|
Other concepts |
0,00 |
Other funds |
0,00 |
|
Total of Amounts to be distributed |
38.571,35 |
Dividends |
0,00 |
|
|
|
Other Applications |
0,00 |
COMPARATIVE SECTOR
ANALYSIS
Values table
Figures expressed in %
|
|
COMPANY (2007) |
SECTOR |
DIFFERENCE |
DIFFERENCE RELATIVE |
|
|
|
|
|
|
BALANCE SHEET
ANALYSIS: % on the total assets |
|
|
|
|
|
|
|
|
|
|
OWN FUNDS |
11,21 |
41,00 |
-29,79 |
-72,65 |
|
|
|
|
|
|
DEBT |
88,79 |
59,00 |
29,79 |
50,49 |
|
|
|
|
|
|
FIXED ASSETS |
38,86 |
38,36 |
0,50 |
1,30 |
|
|
|
|
|
|
|
|
|
|
|
|
|
|
|
|
|
|
COMPANY (2007) |
SECTOR |
DIFFERENCE |
DIFFERENCE RELATIVE |
|
|
|
|
|
|
PROFIT AND LOSS
ACCOUNT ANALYSIS: % on the total operating income |
|
|
|
|
|
|
|
|
|
|
SALES |
99,71 |
99,43 |
0,28 |
0,28 |
|
|
|
|
|
|
ADDED VALUE |
23,87 |
29,98 |
-6,11 |
-20,38 |
|
|
|
|
|
|
EBIT |
4,30 |
0,91 |
3,39 |
373,80 |
|
|
|
|
|
|
NET RESULT |
1,56 |
0,11 |
1,45 |
1.290,68 |
|
|
|
|
|
Sector Composition
Compared sector (NACE): 171
Number of companies: 233
Size (Sales Figure) : 0 - 2.800.000,00
Euros
Comments on the sectorial comparative
Compared to its sector the assets of the companies show a greater proportion
of fixed assets. Specifically the difference with the sector average is 0,50% ,
which means a relative difference of 1,30% .
In liabilities composition the company appeals on a wider scale to self
financing, being the proportion of net worth of 29,79% inferior, which means a
relative difference of 72,65% 29,79% more than the sector, which means a
difference of 50,49% .
The proportion that the sales mean to the company’s total ordinary
income is 99,71%, 0,28% higher than in the sector, which means a relative
difference of 0,28% .
The company’s EBIT was positive and was 4,30% with regard to the total
ordinary income, 3,39% higher than in the sector, which means a relative
difference of 373,80% .
The company’s capacity to generate operating income is higher than the
one of the sector as its ratio EBIT/Sales is higher (ES Company versus ES
Sector).
The company’s net result was positive and equal to 1,56% with regard to
the total ordinary income, 1,45% higher than in the sector, which means a
relative difference of 1.290,68% .
The financial and extraordinary results and the tax impact have had a
less negative impact on the Net result in the company than in the sector; as a
consequence, the company shows a better Net Result/EBIT ratio (REBEmpresa vs.
REBSector).
ADDRESSES
Current Legal Seat Address:
POLIGONO INDUSTRIAL MOLI (NAVES A 2 Y A 3)
08359
SANT ISCLE DE VALLALTA BARCELONA
Characteristics of the current address
Type of premises: office, factory
Property: rented
Local Situation: main
|
STREET |
POSTAL CODE |
TOWN |
PROVINCE |
|
STREET MOLI DEL COMPTE 21 |
25600 |
BALAGUER |
Lérida |
|
POLIGONO IND TORRENT DE PUIG CL CAN BERNAR 49 |
08358 |
ARENS DE MUIN |
Barcelona |
2 branches registered
CORPORATE STRUCTURE
ADMINISTRATIVE LINKS
Main Board members, Directors and Auditor ![]()
|
POSITION |
SURNAMES AND
NAME |
APPOINTMENT DATE |
|
ADMINISTRATOR |
GIL BOGUNA SANTIAGO |
13/06/2003 |
|
ADMINISTRATOR |
COMPTE FORS MANUEL |
13/06/2003 |
Functional Managers
|
POSITION |
SURNAMES AND
NAME |
|
General Manager |
GIL BOGUNA SANTIAGO |
|
Financial Manager |
NOGUEROLES MARIA JOSE |
FINANCIAL LINKS
|
|
BUSINESS NAME |
CIF / COUNTRY |
% |
SOURCE |
DATA INF. |
|
|
GIL BOGUNA SANTIAGO |
|
50,00 |
OWN SOURCES |
13/10/2008 |
CREDIT INFORMATION
Constitution Date: 21/10/1999
Business activity 
Activity: Throwing & preparation of silk including
from noils & throwing & texturing of systhe.
NACE Code: 1714
NACE Activity: Preparation and
spinning of flax-type fibres
Business: EL TORCIDO DE FIBRAS SINTETICAS. ASI COMO LA
COMERCIALIZACION Y MANIPULACION DE PRODUCTOS DERIVADOS DE ELLAS.
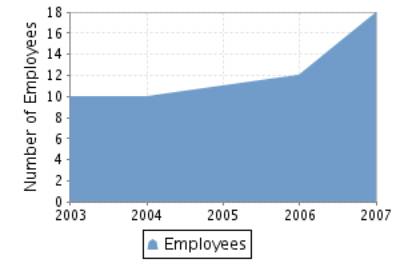
Employees 
Number of total employees: 12 (2008)
Number of fixed employees: 88,89%
Number of temporary employees: 11,11%
Employees evolution
COMMERCIAL OPERATIONS 
PURCHASES
Payments (estimated):
Imports from: UNION EUROPEA
SALES
Collection (estimated):
On a credit basis: 100%
Exports to: UNION EUROPEA
Regional Distribution: 100%
Banks 
|
ENTITY |
BRANCH |
ADDRESS |
TOWN OR CITY |
PROVINCE |
|
BANCO DE SABADELL, S.A. |
0184 |
C RIERA GAVARRA 000029 |
CANET DE MAR |
Barcelona |
|
CAJA DE AHORROS
Y PENSIONES DE BARCELONA |
0212 |
PL. FRANCESC MORAGAS, 1 |
SANT POL DE MAR |
Barcelona |
2 bank entities registered
LEGAL STRUCTURE
Constitution Data
Register Date: 21/10/1999
Register town: Barcelona
Announcement number: 416221
Legal form: LIMITED LIABILITY
COMPANY
Social Capital: 3.015 €
Current Legal Form: LIMITED LIABILITY
COMPANY
Current Capital: 243.015,00 €
Legal Aspects
Obligation to fill in Financial
Statements: YES
Chamber census: YES (2006)
Listed on a Stock Exchange: NO
B.O.R.M.E.(Official Companies Registry Gazette) ![]()
Other Proceedings published
|
PROCEEDINGS |
DATE |
NOTICE NUM. |
TRADE REG. |
|
Registration of
accounts (2007) Individual |
25/08/2008 |
313092 |
Barcelona |
|
Registration of
accounts (2006) Individual |
04/09/2007 |
352559 |
Barcelona |
|
Registration of
accounts (2005) Individual |
11/12/2006 |
989266 |
Barcelona |
|
Registration of
accounts (2004) Individual |
04/10/2005 |
657462 |
Barcelona |
|
Registration of
accounts (2003) Individual |
22/11/2004 |
883734 |
Barcelona |
FINANCIAL INFORMATION
The information on the last account contained in this report is
extracted from the Mercantile Register file of the legal address of the Company
and dated 25/08/2008.
BALANCE SHEET
Assets
Figures given in €
|
|
31/12/2005 (12) |
31/12/2006 (12) |
31/12/2007 (12) |
|
A) DUE FROM SHAREHOLDERS FOR UNCALLED CAPITAL |
|
|
|
|
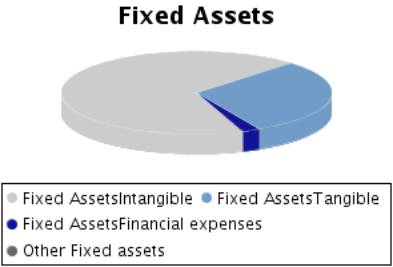
B) FIXED ASSETS |
535.226,41 |
834.376,14 |
1.001.880,68 |
|
I. Incorporation costs |
11.853,96 |
11.660,42 |
|
|
II. Intangible fixed assets |
256.144,77 |
527.585,60 |
679.403,75 |
|
III. Tangible fixed assets |
259.618,69 |
276.620,17 |
300.518,64 |
|
IV. Financial fixed assets |
7.608,99 |
18.509,95 |
21.958,29 |
|
V.Owners equity |
|
|
|
|
VI.Long term trade liabilities |
|
|
|
|
C) DEFERRED EXPENSES |
16.479,60 |
41.569,12 |
54.582,84 |
|
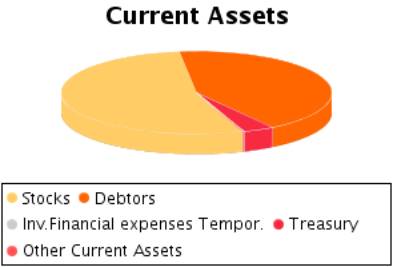
D) CURRENT ASSETS |
902.305,83 |
1.100.117,25 |
1.521.530,26 |
|
I. Shareholders by required outlays |
|
|
|
|
II. Stocks |
519.439,06 |
706.667,44 |
814.907,05 |
|
III. Debtors |
350.331,24 |
381.105,96 |
645.958,71 |
|
IV. Temporary financial investment |
|
|
|
|
V. Short-term own shares |
|
|
|
|
VI. Treasury |
32.535,53 |
9.584,59 |
57.812,93 |
|
VII. Periodification adjustments |
|
2.759,26 |
2.851,57 |
|
ASSETS (A + B + C + D) |
1.454.011,84 |
1.976.062,51 |
2.577.993,78 |
Assets composition
Liabilities
Figures given in €
|
|
31/12/2005 (12) |
31/12/2006 (12) |
31/12/2007 (12) |
|
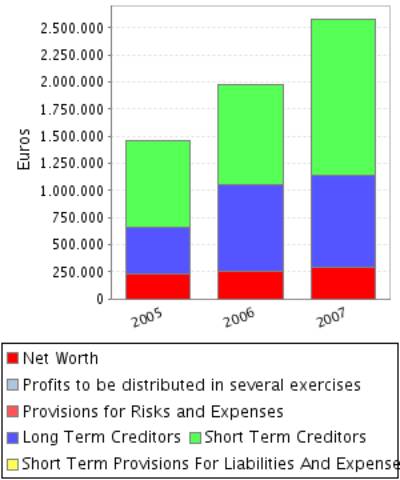
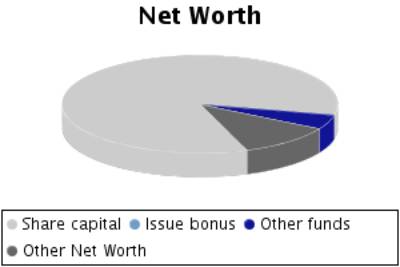
A) SHAREHOLDERS EQUITY |
226.171,13 |
250.513,34 |
289.084,69 |
|
I. Share capital |
243.015,00 |
243.015,00 |
243.015,00 |
|
II. Issue bonus |
|
|
|
|
III.Revaluation reserve |
|
|
|
|
IV.Reserves |
10.676,19 |
11.737,17 |
14.171,39 |
|
Capital adjustments in Euros |
|
|
|
|
Sundry reserves |
10.676,19 |
11.737,17 |
14.171,39 |
|
V.Results from previous years |
-38.129,86 |
-28.581,04 |
-6.673,05 |
|
VI.Profit and Losses |
10.609,80 |
24.342,21 |
38.571,35 |
|
VII.Dividend paid during the year |
|
|
|
|
VIII.Own shares for capital reduction |
|
|
|
|
B) DEFERRED INCOME |
|
6.493,29 |
|
|
C) PROVISIONS FOR LIABILITIES AND EXPENSES |
|
|
|
|
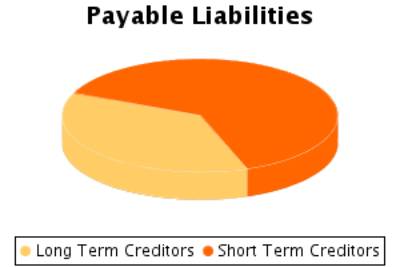
D) LONG TERM LIABILITIES |
428.468,68 |
791.727,10 |
847.186,80 |
|
E) SHORT TERM LIABILITIES |
799.372,03 |
927.328,78 |
1.441.722,29 |
|
F) SHORT TERM PROVISIONS FOR LIABILITIES AND
EXPENSES |
|
|
|
|
LIABILITIES (A + B + C + D + E + F) |
1.454.011,84 |
1.976.062,51 |
2.577.993,78 |
Liabilities
Composition
PROFIT AND LOSS ACCOUNT
Itams of the Profit and Loss Account
Figures given in €
|
|
31/12/2005 (12) |
31/12/2006 (12) |
31/12/2007 (12) |
|
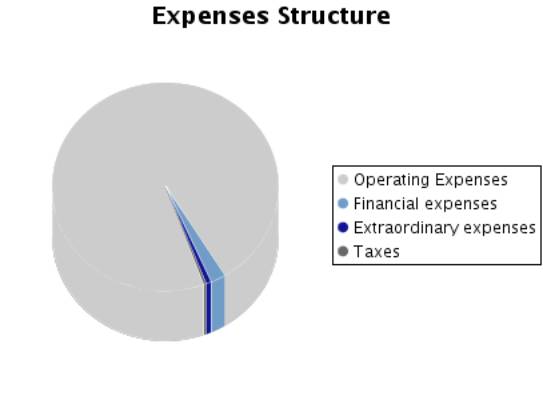
A) EXPENSES (A.1 a A.15) |
1.466.449,52 |
1.780.304,26 |
2.449.008,51 |
|
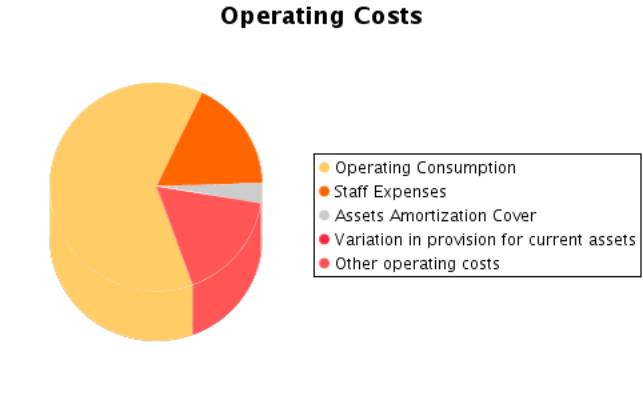
A.1.Operating costs |
813.594,36 |
1.003.675,12 |
1.484.529,29 |
|
A.2. Labour cost |
298.316,32 |
349.119,48 |
411.508,55 |
|
Wages |
239.113,23 |
272.775,66 |
322.133,99 |
|
Social security expenses |
59.203,09 |
76.343,82 |
89.374,56 |
|
A.3. Assets depreciation |
76.986,38 |
59.130,41 |
72.715,08 |
|
A.4. Variation in provision for current assets |
1.159,26 |
314,08 |
537,43 |
|
A.5. Other operating costs |
239.864,69 |
321.033,78 |
400.676,78 |
|
A.I. OPERATING RESULT (B.1-A.1-A.2-A.3-A.4-A.5) |
43.440,24 |
65.184,44 |
106.419,24 |
|
A.6.Financial expenses and similar |
25.535,08 |
30.468,98 |
54.015,31 |
|
Debts with related companies |
|
|
|
|
Debts with associated companies |
|
|
|
|
Other companies debts By debts with third parties and similar expenses |
25.535,08 |
30.468,98 |
54.015,31 |
|
Losses from financial investments |
|
|
|
|
A.7. Variation in financial investment provision |
|
|
|
|
A.8.Negative exchange difference |
6,97 |
15,11 |
|
|
A.II.POSITIVE FINANCIAL RESULTS
(B.2+B.3-A.6-A.7-A.8) |
|
|
|
|
A.III.PROFIT FROM
ORDINARY ACTIVITIES (A.I+A.II-B.I-B.II) |
18.150,10 |
35.478,60 |
63.597,42 |
|
A.9. Variation in provision in fixed assets |
|
|
|
|
A.10. Losses in fixed assets |
5.664,36 |
5.664,36 |
17.324,78 |
|
A.11. Losses from own shares and bonds |
|
|
|
|
A.12. Extraordinary charges |
|
|
|
|
A.13.Other exercises’ expenses and losses |
|
300,57 |
|
|
A.IV.POSITIVE
EXTRAORDINARY RESULT (B.4+B.5+B.6+B.7+B.8-A.9-A.10-A.11-A.12-A.13) |
|
|
|
|
A.V.PROFIT
BEFORE TAXES (A.III+A.IV-B.III-B.IV) |
15.931,90 |
34.924,58 |
46.272,64 |
|
A.14.Corporate
Taxes |
5.322,10 |
10.582,37 |
7.701,29 |
|
A.15. Other
taxes |
|
|
|
|
A.VI.EXERCISE
RESULT (PROFIT) (A.V-A.14-A.15) |
10.609,80 |
24.342,21 |
38.571,35 |
|
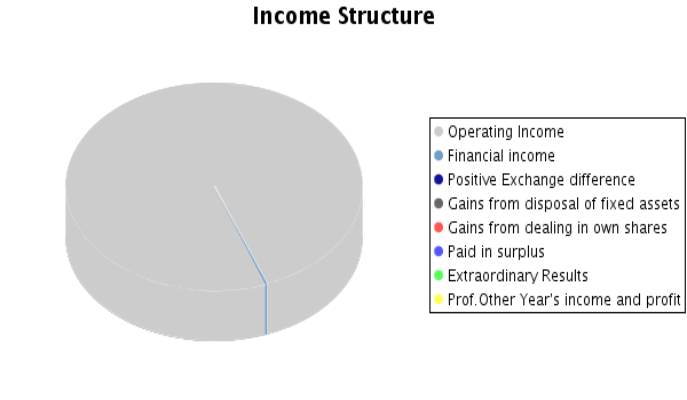
B) INCOMES (B.1
a B.8) |
1.477.059,32 |
1.804.646,47 |
2.487.579,86 |
|
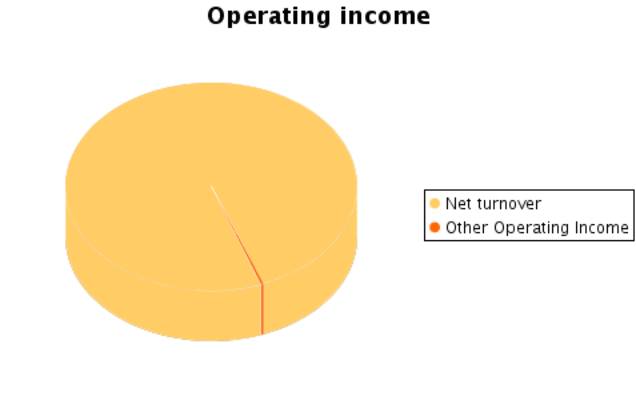
B.1.Operating
income |
1.473.361,25 |
1.798.457,31 |
2.476.386,37 |
|
Turnover |
1.417.797,50 |
1.795.448,23 |
2.469.143,08 |
|
Other operating
income |
55.563,75 |
3.009,08 |
7.243,29 |
|
B.I.OPERATING
LOSSES (A.1+A.2+A.3+A.4+A.5-B.1) |
|
|
|
|
B.2.Financial Income |
251,91 |
758,00 |
11.193,49 |
|
From affiliated companies |
|
|
|
|
From associated companies |
|
|
|
|
Other |
251,91 |
758,00 |
11.193,49 |
|
Gains from investments |
|
|
|
|
B.3. Positive change difference |
|
20,25 |
|
|
B.II. NEGATIVE FINANCIAL RESULTS
(A.6+A.7+A.8-B.2-B.3) |
25.290,14 |
29.705,84 |
42.821,82 |
|
B.III.LOSSES FROM ORDINARY ACTIVITIES
(B.I+B.II-A.I-A.II) |
|
|
|
|
B.4.B.9. Gains from disposal of fixed assets |
|
4.422,46 |
|
|
B.5.Gains from dealing in own shares |
|
|
|
|
B.6. Paid in surplus |
|
|
|
|
B.7. Extraordinary income |
3.446,16 |
|
|
|
B.8.Other year’s income and profits |
|
988,45 |
|
|
B.IV.NEGATIVE EXTRAORDINARY LOSSES (A.9+A.10+A.11+A.12+A.13-B.4-B.5-B.6-B.7-B.8) |
2.218,20 |
554,02 |
17.324,78 |
|
B.V.LOSS BEFORE TAXES (B.III+B.IV-A.III-A.IV) |
|
|
|
|
B.VI.EXERCISE RESULTS (LOSS) (B.V+A.14+A.15) |
|
|
|
Composition of the
Profit and Loss Account
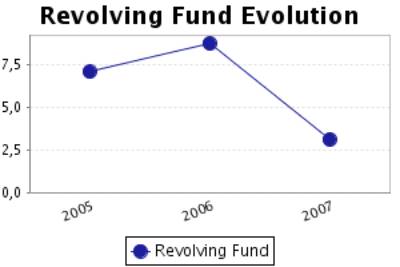
FINANCIAL BALANCE
Here the Main Capital Amounts of the company and the Revolving Fund
Evolution are analysed.
Financial Balance Table
Figures given in €
|
|
31/12/2005 (12) |
% |
31/12/2006 (12) |
% |
31/12/2007 (12) |
% |
|
A) DUE FROM
SHAREHOLDERS FOR UNCALLED CAPITAL |
|
|
|
|
|
|
|
B) FIXED ASSETS |
535.226,41 |
36,81 |
834.376,14 |
42,22 |
1.001.880,68 |
38,86 |
|
C) DEFERRED
EXPENSES |
16.479,60 |
1,13 |
41.569,12 |
2,10 |
54.582,84 |
2,12 |
|
D) CURRENT
ASSETS |
902.305,83 |
62,06 |
1.100.117,25 |
55,67 |
1.521.530,26 |
59,02 |
|
ASSETS (A + B +
C + D) |
1.454.011,84 |
|
1.976.062,51 |
|
2.577.993,78 |
|
|
|
||||||
|
A) SHAREHOLDERS
EQUITY |
226.171,13 |
15,55 |
250.513,34 |
12,68 |
289.084,69 |
11,21 |
|
B) DEFERRED
INCOME |
|
|
6.493,29 |
0,33 |
|
|
|
C) PROVISIONS
FOR LIABILITIES AND EXPENSES |
|
|
|
|
|
|
|
D) LONG TERM
LIABILITIES |
428.468,68 |
29,47 |
791.727,10 |
40,07 |
847.186,80 |
32,86 |
|
E) SHORT TERM LIABILITIES |
799.372,03 |
54,98 |
927.328,78 |
46,93 |
1.441.722,29 |
55,92 |
|
F) SHORT TERM
PROVISIONS FOR LIABILITIES AND EXPENSES |
|
|
|
|
|
|
|
LIABILITIES (A + B + C + D + E + F) |
1.454.011,84 |
|
1.976.062,51 |
|
2.577.993,78 |
|
Financial Balance
Composition
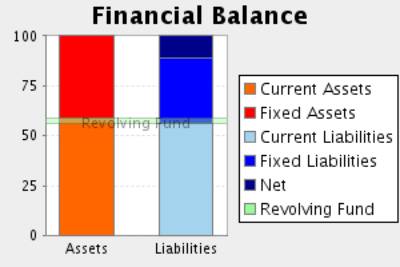
Comments on Financial Balance
In the 2005, the assets of the company were formed in 37,94% of Fixed
Assets and in 62,06% of Current Assets.This assets were financed in 15,55% with
own capitals, and in 29,47% with long term debt and in 54,98% with current
liabilities.
The result of this financial structure is a positive turnover fund of
102.933,80 Euros, which is equivalent to 7,08% proportion of the
company’s total assets.
In the 2006, the assets of the company were formed in 44,33% of Fixed
Assets and in 55,67% of Current Assets.This assets were financed in 13,01% with
own capitals, and in 40,07% with long term debt and in 46,93% with current
liabilities.
The result of this financial structure is a positive turnover fund of
172.788,47 Euros, which is equivalent to 8,74% proportion of the
company’s total assets.
This measure has increased with respect to the previous exercise in
67,86% having also increased its proportion with respect to the total assets of
the company.
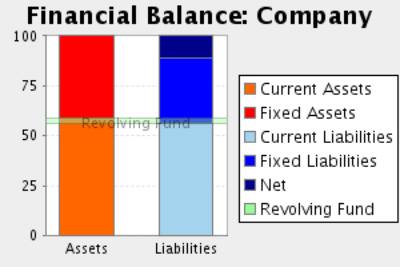
In the 2007, the assets of the company were formed in 40,98% of Fixed
Assets and in 59,02% of Current Assets.This assets were financed in 11,21% with
own capitals, and in 32,86% with long term debt and in 55,92% with current
liabilities.
The result of this financial structure is a positive turnover fund of
79.807,97 Euros, which is equivalent to 3,10% proportion of the company’s
total assets.
This measure has diminished with respect to the previous exercise in
53,81% having also diminished its proportion with respect to the total assets
of the company.
RATIOS
Main Ratios
|
|
31/12/2005 (12) |
31/12/2006 (12) |
31/12/2007 (12) |
|
STRUCTURAL RATIOS |
|
|
|
|
Management fund |
102.933,80 |
172.788,47 |
79.807,97 |
|
Indebtedness (%) |
84,44 |
86,99 |
88,79 |
|
External Funds on Net Worth |
5,43 |
6,69 |
7,92 |
|
GENERAL ACTIVITY RATIO |
|
|
|
|
Turnover Increase (%) |
24,32 |
26,64 |
37,52 |
|
Added value growth (%) |
36,85 |
12,82 |
24,79 |
|
Cash Flow |
88.755,44 |
83.786,70 |
111.823,86 |
|
Labour Productivity |
1,41 |
1,36 |
1,44 |
|
Assets turnover |
0,98 |
0,91 |
0,96 |
|
Breakdown Point |
1.376.352,49 |
1.650.955,98 |
2.210.687,65 |
|
Security Margin of the Breakdown Point (%) |
6,58 |
8,20 |
10,73 |
|
ACTIVITY RATIOS |
|
|
|
|
Average Collection Period |
89 |
76 |
94 |
|
Inventory Turnover Period |
132 |
142 |
119 |
|
SOLVENCY RATIOS |
|
|
|
|
Payback Capacity |
0,07 |
0,05 |
0,05 |
|
Assets Guarantee |
1,16 |
1,12 |
1,10 |
|
Short Term Debts Proportion (%) |
65,10 |
53,94 |
62,99 |
|
Interest Coverage |
3,33 |
2,55 |
1,86 |
|
LIQUIDITY RATIOS |
|
|
|
|
Current Ratio |
1,13 |
1,19 |
1,06 |
|
Immediate liquidity |
0,04 |
0,01 |
0,04 |
|
Sales on Current Assets |
566 |
588 |
584 |
Results Analysis
Ratios
|
|
31/12/2005 (12) |
31/12/2006 (12) |
31/12/2007 (12) |
|
Economic profitability (%) |
2,99 |
3,30 |
4,13 |
|
Operating Profitability (%) |
3,06 |
3,63 |
4,31 |
|
Equity gearing |
2,69 |
4,18 |
5,33 |
|
Financial profitability (%) |
4,69 |
9,47 |
13,34 |
|
General Profitability (%) |
0,75 |
1,36 |
1,56 |
Comments on the
Results Analysis Ratios
The economic profitability in the year2006 achieved a 3,30% positive
level, due to a 3,63% economic margin and to an assets turnover of0,91%.
The economic profitability in the year has increased from 2,99% up to
3,30%. This growth is due to the economic margin increase, from 3,06% to the
current 3,63% in spite of the assets turnover drop, which have decreased from
0,98 to 0,91%.
Financial profitability on 2006 achieved a 9,47%.
The company’s financial structure has instigated its economic
profitability with an indebtedness level of 4,18.
The general profitability on 2006 achieved a 1,36%.
The economic profitability in the year2007 achieved a 4,13% positive
level, due to a 4,31% economic margin and to an assets turnover of0,96%.
The economic profitability in the year has increased from 3,30% up to
4,13%. This growth is due to the economic margin increase, from 3,63% to the
current 4,31Y%, and to the assets turnover index, which in the last period has
achieved 0,96, compared to 0,91 del 2006.
Financial profitability on 2007 achieved a 13,34%.
The company’s financial structure has instigated its economic
profitability with an indebtedness level of 5,33.
The general profitability on 2007 achieved a 1,56%.
SECTORIAL ANÁLYSIS
Large Capital Amounts and Financial Balance
Figures given in %
|
|
COMPANY (2007) |
SECTOR |
DIFFERENCE |
DIFFERENCE RELATIVE |
|
|
|
|
|
|
ASSETS |
|
|
|
|
|
|
|
|
|
|
A) DUE FROM
SHAREHOLDERS FOR UNCALLED CAPITAL |
|
0,02 |
|
|
|
|
|
|
|
|
B) FIXED ASSETS |
38,86 |
38,36 |
0,50 |
1,30 |
|
|
|
|
|
|
C) DEFERRED
EXPENSES |
2,12 |
0,33 |
1,79 |
550,31 |
|
|
|
|
|
|
D) CURRENT ASSETS |
59,02 |
61,29 |
-2,27 |
-3,71 |
|
|
|
|
|
|
ASSETS (A + B + C + D) |
100 |
100 |
|
|
|
|
|
|
|
|
|
|
|
|
|
|
|
|
|
|
|
|
COMPANY (2007) |
SECTOR |
DIFFERENCE |
DIFFERENCE RELATIVE |
|
|
|
|
|
|
LIABILITIES |
|
|
|
|
|
|
|
|
|
|
A) SHAREHOLDERS EQUITY |
11,21 |
39,65 |
-28,44 |
-71,73 |
|
|
|
|
|
|
B) DEFERRED INCOME |
|
1,35 |
|
|
|
|
|
|
|
|
C) PROVISIONS
FOR LIABILITIES AND EXPENSES |
|
0,10 |
|
|
|
|
|
|
|
|
D) LONG TERM
LIABILITIES |
32,86 |
15,10 |
17,76 |
117,63 |
|
|
|
|
|
|
E) SHORT TERM
LIABILITIES |
55,92 |
43,80 |
12,12 |
27,67 |
|
|
|
|
|
|
F) SHORT TERM
PROVISIONS FOR LIABILITIES AND EXPENSES |
|
0,00 |
|
|
|
|
|
|
|
|
LIABILITIES (A + B + C + D + E + F) |
100 |
100 |
|
|
|
|
|
|
|
Sectorial Financial
Balance Comparison
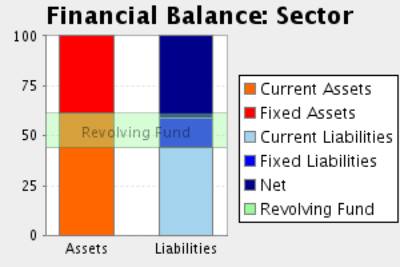
Comments to the
Sectorial Analysis
In the 2007, the assets of the company were formed in 40,98% of fixed
assets and in 59,02Current Assets % In the sector, the proportion of fixed
assets was of 38,71%, 5,87% inferior, and the proportion of current assets was
of 61,29%, 3,71% superior.
The assets were financed in the company in 11,21% with own capitals , in
32,86% with fixed liabilities and in 55,92% with current liabilities In the
sector, the self financing represented 41,00%, 72,66% superior. On the other
hand the long term debts represented in the sector an average of 15,20%
financing, with a relative difference of 116,21% in favour of the companyAnd,
short term liabilities represented in the sector an average of 43,80%
financing, with a relative difference of 27,67% in favour of the company
The result of this company’s financial structure is a turnover fund that
represents 3,10% of the total assets; in the sector, this same proportion is
17,49%, therefore, we can say that the company’s turnover fund is 82,28%
smaller than the sector one.
Analytical Account
of Results
Figures given in %
|
|
COMPANY (2007) |
SECTOR |
DIFFERENCE |
DIFFERENCE RELATIVE |
|
Turnover |
99,71 |
99,43 |
0,28 |
0,28 |
|
Other operating income |
0,29 |
0,57 |
-0,28 |
-49,21 |
|
Production Value |
100,00 |
100,00 |
0,00 |
0,00 |
|
Operating expenses |
59,95 |
50,72 |
9,23 |
18,20 |
|
Other operation expenses |
16,18 |
19,30 |
-3,12 |
-16,16 |
|
Added value |
23,87 |
29,98 |
-6,11 |
-20,39 |
|
Labour cost |
16,62 |
24,00 |
-7,38 |
-30,76 |
|
Gross Economic Result |
7,26 |
5,98 |
1,28 |
21,42 |
|
Assets depreciation |
2,94 |
4,88 |
-1,94 |
-39,74 |
|
Variation in provision for current assets and bad debt losses |
0,02 |
0,19 |
-0,17 |
-89,64 |
|
Net Economic Result |
4,30 |
0,91 |
3,39 |
374,09 |
|
Financial income |
0,45 |
0,47 |
-0,02 |
-4,86 |
|
Financial Charges |
2,18 |
1,76 |
0,42 |
23,51 |
|
Variation in financial investment provision |
|
0,04 |
|
|
|
Ordinary Activities Result |
2,57 |
-0,43 |
3,00 |
-703,29 |
|
Extraordinary income |
|
1,86 |
|
|
|
Extraordinary charges |
0,70 |
0,98 |
-0,28 |
-28,57 |
|
Variation in provision in fixed assets |
|
0,01 |
|
|
|
Results before Taxes |
1,87 |
0,44 |
1,43 |
328,90 |
|
Corporate taxes |
0,31 |
0,32 |
-0,01 |
-4,32 |
|
Net Result |
1,56 |
0,11 |
1,45 |
1.292,86 |
|
Assets depreciation |
2,94 |
4,88 |
-1,94 |
-39,74 |
|
Change of Provisions |
0,02 |
0,25 |
-0,23 |
-91,90 |
|
Net Self-Financing |
4,52 |
5,24 |
-0,72 |
-13,71 |
Main Ratios
|
|
COMPANY (2007) |
PTILE25 |
PTILE50 |
PTILE75 |
|
STRUCTURAL RATIOS |
|
|
|
|
|
Management fund |
79.807,97 |
1,61 |
88,73 |
271,03 |
|
Indebtedness (%) |
88,79 |
40,31 |
64,82 |
78,92 |
|
External Funds on Net Worth |
7,92 |
0,68 |
1,84 |
3,74 |
|
GENERAL ACTIVITY RATIO |
|
|
|
|
|
Turnover Increase (%) |
37,52 |
-16,54 |
-4,25 |
7,95 |
|
Added value growth (%) |
24,79 |
-17,73 |
-4,22 |
9,00 |
|
Cash Flow |
111.823,86 |
8,66 |
36,20 |
83,87 |
|
Labour Productivity |
1,44 |
1,11 |
1,28 |
1,54 |
|
Assets turnover |
0,96 |
0,78 |
1,12 |
1,65 |
|
Breakdown Point |
2.210.687,65 |
355.517,63 |
798.015,16 |
1.606.521,80 |
|
Security Margin of the Breakdown Point (%) |
10,73 |
-3,03 |
4,24 |
9,83 |
|
ACTIVITY RATIOS |
|
|
|
|
|
Average Collection Period |
94 |
61 |
94 |
127 |
|
Inventory Turnover Period |
119 |
11 |
52 |
100 |
|
SOLVENCY RATIOS |
|
|
|
|
|
Payback Capacity |
0,05 |
0,03 |
0,09 |
0,17 |
|
Assets Guarantee |
1,10 |
1,26 |
1,54 |
2,46 |
|
Short Term Debts Proportion (%) |
62,99 |
64,12 |
88,18 |
100,00 |
|
Interest Coverage |
1,86 |
0,51 |
2,23 |
7,04 |
|
LIQUIDITY RATIOS |
|
|
|
|
|
Current Ratio |
1,06 |
1,01 |
1,33 |
2,20 |
|
Immediate liquidity |
0,04 |
0,04 |
0,14 |
0,51 |
|
Sales on Current Assets |
584 |
453 |
668 |
995 |
Results Analysis
Ratios
|
|
COMPANY (2007) |
PTILE25 |
PTILE50 |
PTILE75 |
|
Economic profitability (%) |
4,13 |
-1,68 |
2,38 |
5,15 |
|
Operating Profitability (%) |
4,31 |
-1,66 |
2,00 |
4,18 |
|
Equity gearing |
5,33 |
1,03 |
1,74 |
3,90 |
|
Financial profitability (%) |
13,34 |
-1,83 |
2,88 |
7,22 |
|
General Profitability (%) |
1,56 |
-0,66 |
0,83 |
1,91 |
FOREIGN EXCHANGE
RATES
|
Currency |
Unit
|
Indian Rupees |
|
US Dollar |
1 |
Rs.47.71 |
|
UK Pound |
1 |
Rs.83.30 |
|
Euro |
1 |
Rs.65.12 |
RATING
EXPLANATIONS
|
RATING |
STATUS |
PROPOSED CREDIT LINE |
|
|
>86 |
Aaa |
Possesses an extremely sound financial base with the strongest
capability for timely payment of interest and principal sums |
Unlimited |
|
71-85 |
Aa |
Possesses adequate working capital. No caution needed for credit
transaction. It has above average (strong) capability for payment of interest
and principal sums |
Large |
|
56-70 |
A |
Financial & operational base are regarded healthy. General unfavourable
factors will not cause fatal effect. Satisfactory capability for payment of
interest and principal sums |
Fairly Large |
|
41-55 |
Ba |
Overall operation is considered normal. Capable to meet normal
commitments. |
Satisfactory |
|
26-40 |
B |
Unfavourable & favourable factors carry similar weight in credit
consideration. Capability to overcome financial difficulties seems
comparatively below average. |
Small |
|
11-25 |
Ca |
Adverse factors are apparent. Repayment of interest and principal sums
in default or expected to be in default upon maturity |
Limited with
full security |
|
<10 |
C |
Absolute credit risk exists. Caution needed to be exercised |
Credit not
recommended |
|
NR |
In view of the lack of information, we have no basis upon which to
recommend credit dealings |
No Rating |
|
This score serves as a reference to assess SC’s credit risk
and to set the amount of credit to be extended. It is calculated from a composite
of weighted scores obtained from each of the major sections of this report. The
assessed factors and their relative weights (as indicated through %) are as
follows:
Financial
condition (40%) Ownership
background (20%) Payment
record (10%)
Credit history
(10%) Market trend
(10%) Operational
size (10%)