![]()
MIRA INFORM REPORT
|
Report Date : |
28.08.2008 |
IDENTIFICATION
DETAILS
|
Name : |
SUMINISTROS TECNICOS DEL SUR SA |
|
|
|
|
Registered Office : |
Poligono Industrial Torrecilla - Avd.Torrecilla, S/N, Cp 14013, Cordoba Córdoba |
|
|
|
|
Country : |
Spain |
|
|
|
|
Financials (as on) : |
31.12.2006 |
|
|
|
|
Date of Incorporation : |
|
|
|
|
|
Legal Form : |
Joint Stock Company |
|
|
|
|
Line of Business : |
Wholesale of other machinery for use in industry, trade and navigation |
RATING &
COMMENTS
|
MIRA’s Rating : |
A |
|
RATING |
STATUS |
PROPOSED CREDIT LINE |
|
|
56-70 |
A |
Financial & operational base are regarded healthy. General unfavourable
factors will not cause fatal effect. Satisfactory capability for payment of
interest and principal sums |
Fairly Large |
|
Status : |
Good |
|
|
|
|
Payment Behaviour : |
Regular |
|
|
|
|
Litigation : |
Clear |
Name
SUMINISTROS TECNICOS DEL SUR SA ”STS”
TAX NUMBER
A14085393
EXECUTIVE SUMMARY
Identification
Current Business Name: SUMINISTROS TECNICOS DEL SUR SA
Commercial Name: STS
Other names: NO
Current
Address: POLIGONO INDUSTRIAL
TORRECILLA - AVD.
TORRECILLA, S/N, CP 14013, CORDOBA CÓRDOBA
Branches: 2
Telephone number: 957760642 Fax: 957202187
URL: www.sts.es
Corporate e-mail: sts@sts.es
Commercial Risk
RAI: NO
Legal
Actions: NO
Financial Information
Latest sales known (2007): 11.944.130,22 € (Estimated)
Latest Balance sheet sales (2006): 11.375.365,33 € (MERCANTILE REGISTER)
Result: 215.370,85 €
Total Assets: 9.066.161,39 €
Social Capital: 252.000,00 €
Employees: 67
Commercial Information
Constitution Date: 28/10/1986
Business activity: Wholesale of other
products
NACE Code: 5165
International Operations: Imports
Corporate Structure
President:
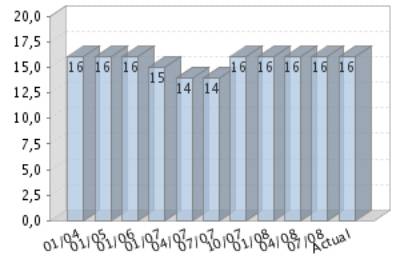
Rating Evolution
Financial Situation
Fiscal year2006
|
Treasury |
Very good |
|
Indebtedness |
Average |
|
Profitability |
Average |
|
Balance |
Excellent |
Performance
|
Legal Actions |
None or Negligible |
|
Business
Trajectory |
Excellent |
RAI 
COMPANY NOT REGISTERED IN THE R.A.I.
This company is not registered in the Disputed Bills register (R.A.I.)
INCIDENTS

Summary
LEGAL ACTIONS: No legal incidences registered.
CLAIM FILED AGAINST THE ADMINISTRATION: No administrative
claims registered
AFFECTED BY: No significant element.
FINANCIAL ELEMENTS AND SECTORIAL
COMPARATIVE
FINANCIAL ELEMENTS
Figures given in €
|
|
2005 (12) |
2006 (12) |
2007 |
|
BALANCE SHEET ANALYSIS |
|
|
|
|
OWN FUNDS |
1.675.028,20 |
1.887.818,33 |
|
|
DEBT |
6.211.156,76 |
7.178.343,06 |
|
|
FIXED ASSETS |
1.690.085,60 |
2.261.477,51 |
|
|
TOTAL ASSETS |
7.886.184,96 |
9.066.161,39 |
|
|
|
|
|
|
|
|
2005 (12) |
2006 (12) |
2007 |
|
PROFIT AND LOSS ACCOUNT ANALYSIS |
|
|
|
|
SALES |
11.200.504,01 |
11.375.365,33 |
11.944.130,22 |
|
ADDED VALUE |
2.740.608,96 |
2.883.309,97 |
|
|
EBITDA |
700.139,36 |
778.034,05 |
|
|
EBIT |
417.801,58 |
423.884,28 |
|
|
NET RESULT |
203.758,89 |
215.370,85 |
|
Balance Sheets Items Analysis

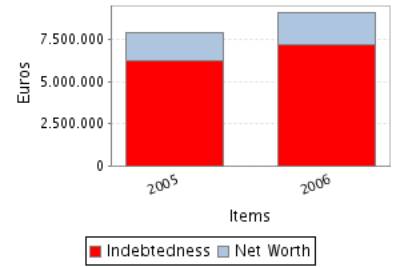
Balance Sheet Comments
Total assets of the company grew 14,96% between 2005 and 2006.
This growth is a consequence of the fixed assets increase of 33,81%.
This growth has been mainly financed with a debt increase of 15,57%.
Nevertheless the net worth increased 12,70%.
Profit and Loss Account Analysis
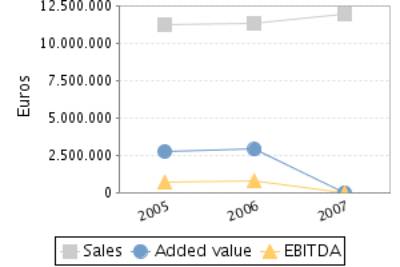

Profit and Loss Account Comments
The company’s sales figure grew 1,56% between 2005 and 2006.
The company’s EBIT grew 1,46% between 2005 and 2006.
This evolution implies a reduction in the company’s operating
profitability.
The result of these variations is a decrease of the company’s Economic
Profitability of 11,75% in the analysed period, being this profitability of
4,68% in the year 2006.
The company’s Net Result grew 5,70% between 2005 and 2006.
This evolution, compared to the EBIT’s performance, implies that the
financial and extraordinary activities have had a positive effect in the
company’s Financial Profitability.
The result of these variations is a reduction of the company’s
profitability of 6,21% in the analysed period, being equal to 11,41% in the
year 2006.
ANNUAL FINANCIAL REPORT
ADDITIONAL DATA
Source: annual financial report 2007
Results Distribution
Figures given in €
|
DISTRIBUTION
BASE |
DISTRIBUTION TO |
||
|
Profit and Loss |
173.176,70 |
Retained earnings |
0,00 |
|
Carry Over |
0,00 |
Voluntary Reserve |
147.200,20 |
|
Voluntary reserves |
0,00 |
Prior years losses |
0,00 |
|
Reserves |
0,00 |
Carry Over |
0,00 |
|
Other concepts |
0,00 |
Other funds |
0,00 |
|
Total of Amounts to be distributed |
173.176,70 |
Dividends |
25.976,50 |
|
|
|
Other Applications |
0,00 |
Auditing
Auditors’ opinion: FAVOURABLE
Auditor: AUDITORES DEL SUR S.L.
COMPARATIVE SECTOR ANALYSIS
Values table
Figures expressed in %
|
|
COMPANY (2006) |
SECTOR |
DIFFERENCE |
DIFFERENCE RELATIVE |
|
BALANCE SHEET ANALYSIS: % on the total
assets |
|
|
|
|
|
OWN FUNDS |
20,82 |
38,76 |
-17,94 |
-46,28 |
|
DEBT |
79,18 |
61,24 |
17,94 |
29,29 |
|
FIXED ASSETS |
24,94 |
21,11 |
3,84 |
18,17 |
|
|
|
|
|
|
|
|
COMPANY (2006) |
SECTOR |
DIFFERENCE |
DIFFERENCE RELATIVE |
|
PROFIT AND LOSS ACCOUNT ANALYSIS: % on the total
operating income |
|
|
|
|
|
SALES |
98,45 |
98,98 |
-0,53 |
-0,54 |
|
ADDED VALUE |
24,95 |
18,64 |
6,31 |
33,87 |
|
EBIT |
3,67 |
5,75 |
-2,09 |
-36,25 |
|
NET RESULT |
1,86 |
3,82 |
-1,95 |
-51,16 |
Sector Composition
Compared sector (NACE): 516
Number of companies: 485
Size (Sales Figure) : 7.000.000,00 - 40.000.000,00 Euros
Comments on the sectorial
comparative
Compared to its sector the assets of the companies show a greater proportion
of fixed assets. Specifically the difference with the sector average is 3,84% ,
which means a relative difference of 18,17% .
In liabilities composition the company appeals on a wider scale to self
financing, being the proportion of net worth of 17,94% inferior, which means a
relative difference of 46,28% 17,94% more than the sector, which means a
difference of 29,29% .
The proportion that the sales mean to the company’s total ordinary
income is 98,45%, 0,53% lower than in the sector, which means a relative
difference of 0,54% .
The company’s EBIT was positive and was 3,67% with regard to the total
ordinary income, 2,09% less than the sector, which means a relative difference
of 36,25% .
The company’s capacity to generate operating income is equal to that of
the sector as its ratio EBIT/Sales is also equal.
The company’s net result was positive and equal to 1,86% with regard to
the total ordinary income, 1,95% less than the sector, which means a relative
difference of 51,16% .
ADDRESSES
Current Legal Seat Address:
POLIGONO INDUSTRIAL TORRECILLA - AVD. TORRECILLA, S/N
14013
CORDOBA CÓRDOBA
Characteristics of the current
address
Type of premises: office, warehouse
Property: rented
Local Situation: main
Branches 
|
STREET |
POSTAL CODE |
TOWN |
PROVINCE |
|
POLIGONO INDUSTRIAL MALPICA 84 ALFIDEN CL SAUCE |
50016 |
ZARAGOZA |
Zaragoza |
|
STREET PIRITA 203 PG IND SAN CRISTOBAL. PARCELA 203.
NAVE A |
47012 |
VALLADOLID |
Valladolid |
2 branches registered
CORPORATE STRUCTURE
ADMINISTRATIVE LINKS
Main Board members,
Directors and Auditor ![]()
|
POSITION |
SURNAMES AND
NAME |
APPOINTMENT DATE |
|
|
PRESIDENT |
COMES LLEBERIA JOSE EMILIO |
16/05/2006 |
|
|
MANAGING DIRECTOR |
RODRIGUEZ REDO ESTEBAN |
16/05/2006 |
|
|
CHIEF OFFICER |
COMES LLEBERIA AGUSTIN |
16/05/2006 |
|
|
CHIEF OFFICER |
PONS PONS ELEUTERIO |
16/05/2006 |
|
|
CHIEF OFFICER |
SEVILLANO RODRIGUEZ TEODORO |
16/05/2006 |
|
|
CHIEF OFFICER |
LUQUE PEREZ FERNANDO |
16/05/2006 |
|
|
AUDITOR |
APPOINTMENT DATE |
||
|
AUDITORES DEL SUR SL |
04/07/2007 |
||
Functional Managers
|
POSITION |
SURNAMES AND
NAME |
|
General Manager |
RODRIGUEZ ESTEBAN |
|
Financial Manager |
SERRANO GARCIA SEBASTIAN |
|
Commercial Manager |
LUQUE PEREZ FERNANDO |
|
Marketing Manager |
RODRIGUEZ NURIA |
FINANCIAL LINKS
|
|
BUSINESS NAME |
CIF / COUNTRY |
% |
SOURCE |
DATA INF. |
|
|
SEVILLANO RODRIGUEZ TEODORO |
|
25,00 |
OWN SOURCES |
13/02/2008 |
|
|
COMES LLEVERIA JOSE EMILIO |
|
25,00 |
OWN SOURCES |
13/02/2008 |
|
|
COMES LLIBERIA AGUSTIN |
|
25,00 |
OWN SOURCES |
13/02/2008 |
|
|
RODRIGUEZ REDO ESTEBAN |
|
10,00 |
OWN SOURCES |
13/02/2008 |
|
|
PONS PONS ELEUTERIO |
|
10,00 |
OWN SOURCES |
13/02/2008 |
|
|
LUQUE PEREZ FERNANDO |
|
5,00 |
OWN SOURCES |
13/02/2008 |
CREDIT INFORMATION
Constitution Date: 28/10/1986
Business activity 
Code: 1617900
Activity: Wholesale of other products
NACE Code: 5165
NACE Activity: Wholesale of other machinery for use in industry,
trade and navigation
Business: COMPRAVENTA, IMPORTACION Y EXPORTACION DE
MAQUINARIA Y SUS REPUESTOS, ARTICULOS DE FERRETERIA, TANTO AGRICOLA O
INDUSTRIAL
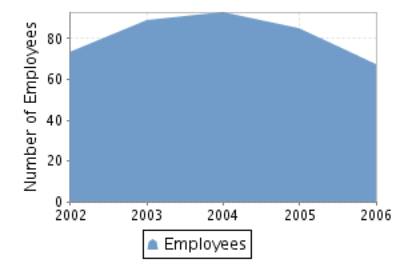
Employees 
Number of total employees: 67 (2006)
Number of fixed employees: 71,64%
Number of temporary employees: 28,36%
Employees evolution
COMMERCIAL OPERATIONS 
PURCHASES
Payments (estimated):
Import Percentage: 10%
SALES
Collection (estimated):
Cash sales percentage: 10%
On a credit basis: 90%
National Distribution: 100%
Banks 
|
ENTITY |
BRANCH |
ADDRESS |
TOWN OR CITY |
PROVINCE |
|
BANCO POPULAR ESPAÑOL, S.A. |
1002 |
INGENIERO J. DE LA CIERVA, S-N |
CORDOBA |
Córdoba |
|
BANKINTER, S.A. |
0740 |
RONDA DE LOS TEJARES,19 |
CORDOBA |
Córdoba |
|
CAJA DE AHORROS Y PENSIONES DE BARCELONA |
|
|
CORDOBA |
|
3 bank entities registered
Brands, Signs and Commercial
Names 
ANAGRAM: STS
LEGAL STRUCTURE
Constitution Data
Register Date: 28/10/1986
Current structure data 
Current Legal Form: JOINT STOCK COMPANY
Current Capital: 252.000,00 €
Legal Aspects
Obligation to fill in Financial Statements: YES
Chamber census: YES (2006)
Listed on a Stock Exchange: NO
B.O.R.M.E.(Official Companies
Registry Gazette) 
Registered Proceedings
|
PROCEEDINGS |
DATE |
NOTICE NUM. |
TRADE REG. |
|
Officially Cancelling of an appointment |
04/07/2007 |
358168 |
Córdoba |
|
Appointments |
04/07/2007 |
358168 |
Córdoba |
|
Appointments |
04/07/2007 |
358167 |
Córdoba |
Other Proceedings published
|
PROCEEDINGS |
DATE |
NOTICE NUM. |
TRADE REG. |
|
Registration of accounts (2007) Individual |
10/07/2008 |
195687 |
Córdoba |
|
Registration of accounts (2006) Individual |
25/06/2007 |
206689 |
Córdoba |
Press articles

27/05/2001 DIARIO DE SEVILLA (FINANCIAL INFORMATION)
ESTA SDAD. FACTURO EL PASADO AÑO 1.460 MM. DE PTAS., UN 27% MAS QUE EN
1999 Y ALCANZO UN BENEFICIO NETO DE 26,574 MM. LA EMPRESA ESTUDIA ENTRAR EN
NUEVOS MERCADOS, SITUANDO EL PUNTO DE MIRA EN LATINOAMERICA Y MARRUECOS. EN
ESTOS PAISES ENTRARA INICIALMENTE VIA DIRECTA STS-CLIENTE, PARA PASAR
POSTERIORMENTE A UNA FASE DE ALIANZA CON UN AGENTE O DISTRIBUIDOR DE LA ZONA.
ESTE PROYECTO, QUE CONTEMPLA UNA INVERSION CERCANA A LOS 25 MM. DE PTAS.,
PODRIA ESTAR EN MARCHA EN MENOS DE UN AÑO. LA EMPRESA CUENTA CON DELEGACIONES
EN VALLADOLID Y ZARAGOZA Y HA INVERTIDO 200 MM. DE PTAS. EN SUS INSTALACIONES.
FINANCIAL INFORMATION
The information on the last account contained in this report is extracted
from the Mercantile Register file of the legal address of the Company and
dated 26/06/2007.
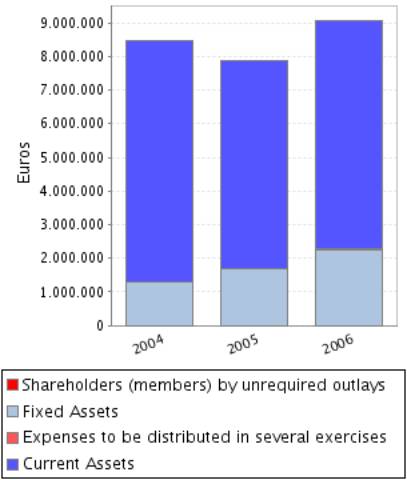
BALANCE SHEET
Assets
Figures given in €
|
|
31/12/2004 (12) |
31/12/2005 (12) |
31/12/2006 (12) |
|
A) DUE FROM SHAREHOLDERS FOR UNCALLED CAPITAL |
|
|
|
|
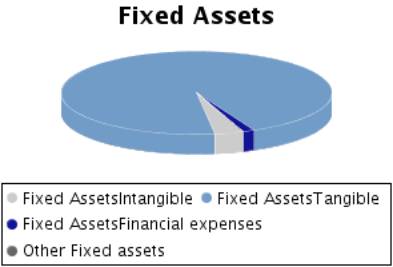
B) FIXED ASSETS |
1.287.577,35 |
1.690.085,60 |
2.261.477,51 |
|
I. Incorporation costs |
5.031,81 |
3.275,38 |
1.629,97 |
|
II. Intangible fixed assets |
19.260,31 |
83.449,30 |
77.440,90 |
|
R & D expenses |
|
|
|
|
Concessions, patents, licences , trademarks |
2.189,56 |
2.189,56 |
2.189,56 |
|
Goodwill |
|
|
|
|
Acquired rights from finance leases |
|
|
|
|
Software |
41.062,15 |
126.204,15 |
137.424,90 |
|
Leasing |
59.950,96 |
59.950,96 |
59.950,96 |
|
Cash advance |
|
|
|
|
Provisions |
|
|
|
|
Depreciation |
-83.942,36 |
-104.895,37 |
-122.124,52 |
|
III. Tangible fixed assets |
1.238.145,99 |
1.576.185,70 |
2.151.127,42 |
|
Property, plant and equipment |
719.221,86 |
725.183,07 |
1.026.750,32 |
|
Machinery, equipment and other |
221.621,80 |
224.725,45 |
271.852,81 |
|
Other property plant and equipment |
465.514,87 |
498.003,36 |
539.385,42 |
|
Prepaid expenses on fixed assets |
476,14 |
372.869,59 |
663.718,94 |
|
Other assets |
733.984,49 |
786.909,97 |
817.287,67 |
|
Provisions |
|
|
|
|
Depreciation |
-902.673,17 |
-1.031.505,74 |
-1.167.867,74 |
|
IV. Financial fixed assets |
25.139,24 |
27.175,22 |
31.279,22 |
|
Shares in affiliated companies |
|
|
|
|
Receivables in affiliated companies |
|
|
|
|
Shares in associated companies |
|
|
|
|
Loans to associated companies |
|
|
|
|
Securities |
|
|
|
|
Other loans |
|
|
|
|
Long term deposits and guarantees |
25.139,24 |
27.175,22 |
31.279,22 |
|
Provisions |
|
|
|
|
Taxes receivable |
|
|
|
|
V.Owners equity |
|
|
|
|
VI.Long term trade liabilities |
|
|
|
|
C) DEFERRED EXPENSES |
16.661,07 |
14.011,43 |
11.664,96 |
|
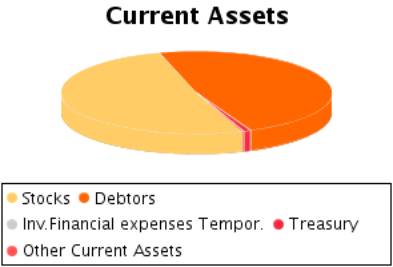
D) CURRENT ASSETS |
7.168.026,80 |
6.182.087,93 |
6.793.018,92 |
|
I. Shareholders by required outlays |
|
|
|
|
II. Stocks |
3.596.222,71 |
2.902.168,34 |
3.476.905,38 |
|
Goods available for sale |
3.586.772,82 |
2.902.168,34 |
3.468.628,88 |
|
Raw material inventory |
10.106,38 |
|
8.276,50 |
|
Work in Progress |
|
|
|
|
Finished goods |
|
|
|
|
Subproducts and recycled materials |
|
|
|
|
Cash advance |
|
|
|
|
Provisions |
-656,49 |
|
|
|
III. Debtors |
3.499.013,00 |
3.227.037,98 |
3.248.229,29 |
|
Clients |
3.494.611,86 |
3.203.033,30 |
3.335.913,92 |
|
Amounts owned by affiliated companies |
|
|
|
|
Amounts owned by associated companies |
|
|
|
|
Other debts |
5.409,10 |
|
|
|
Staff Expenses |
15.393,77 |
13.978,21 |
13.615,89 |
|
Government |
|
36.985,83 |
|
|
Provisions |
-16.401,73 |
-26.959,36 |
-101.300,52 |
|
IV. Temporary financial investment |
12.900,77 |
2.160,65 |
2.160,65 |
|
Shares in affiliated companies |
|
|
|
|
Receivables in affiliated companies |
|
|
|
|
Shares in associated companies |
|
|
|
|
Loans to associated companies |
|
|
|
|
Short term investment |
|
|
|
|
Other loans |
|
|
|
|
Short Term Deposit and guarantees |
12.900,77 |
2.160,65 |
2.160,65 |
|
Provisions |
|
|
|
|
V. Short-term own shares |
|
|
|
|
VI. Treasury |
50.566,65 |
39.631,08 |
49.071,59 |
|
VII. Periodification adjustments |
9.323,67 |
11.089,88 |
16.652,01 |
|
ASSETS (A + B + C + D) |
8.472.265,22 |
7.886.184,96 |
9.066.161,39 |
Assets composition
Liabilities
Figures given in €
|
|
31/12/2004 (12) |
31/12/2005 (12) |
31/12/2006 (12) |
|
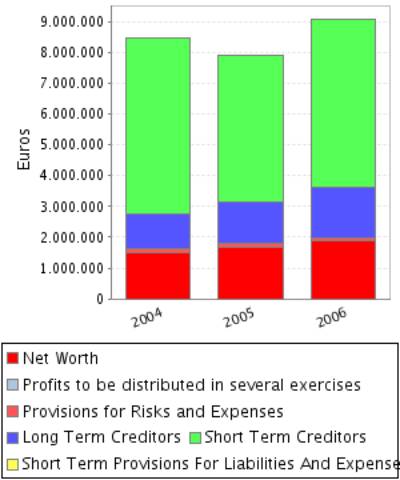
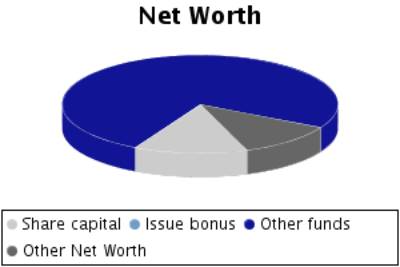
A) SHAREHOLDERS EQUITY |
1.517.058,64 |
1.675.028,20 |
1.887.818,33 |
|
I. Share capital |
252.000,00 |
252.000,00 |
252.000,00 |
|
II. Issue bonus |
|
|
|
|
III.Revaluation reserve |
|
|
|
|
IV.Reserves |
980.070,22 |
1.219.269,31 |
1.420.447,48 |
|
Retained earnings |
50.400,00 |
50.400,00 |
50.400,00 |
|
Sinking fund from owner equity |
|
|
|
|
Reserve for the parent company capital |
|
|
|
|
Statutory reserve |
|
|
|
|
Other funds |
929.670,22 |
1.168.868,10 |
1.370.046,27 |
|
Capital adjustments in Euros |
|
1,21 |
1,21 |
|
V.Results from previous years |
|
|
|
|
Carry Over |
|
|
|
|
Prior years losses |
|
|
|
|
Loans from partners for losses compensation |
|
|
|
|
VI.Profit and Losses |
284.988,42 |
203.758,89 |
215.370,85 |
|
VII.Dividend paid during the year |
|
|
|
|
VIII.Own shares for capital reduction |
|
|
|
|
B) DEFERRED INCOME |
4.868,19 |
|
|
|
Capital grants |
|
|
|
|
Positive change difference |
|
|
|
|
Other deferred income |
4.868,19 |
|
|
|
Fiscal deferred income |
|
|
|
|
C) PROVISIONS FOR LIABILITIES AND EXPENSES |
112.464,69 |
115.505,76 |
96.453,01 |
|
Provision for pensions plans |
112.464,69 |
115.505,76 |
96.453,01 |
|
Provision for taxes |
|
|
|
|
Other provisions |
|
|
|
|
Reversion fund |
|
|
|
|
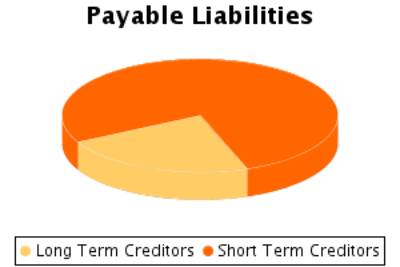
D) LONG TERM LIABILITIES |
1.104.215,98 |
1.343.184,14 |
1.614.707,80 |
|
I.Negotiable bonds and other negotiable values |
|
|
|
|
Non convertible securities |
|
|
|
|
Convertible securities |
|
|
|
|
Other convertible debentures |
|
|
|
|
II.Debt with bank entities |
1.091.967,82 |
1.098.912,12 |
1.614.707,80 |
|
Long term bank loans |
1.091.967,82 |
1.098.912,12 |
1.614.707,80 |
|
Leasing |
|
|
|
|
III.Debts with associated and affiliated
companies |
|
|
|
|
With affiliated companies |
|
|
|
|
Associated companies |
|
|
|
|
IV. Other creditors |
12.248,16 |
244.272,02 |
|
|
Bills payable |
|
|
|
|
Other debts |
12.248,16 |
244.272,02 |
|
|
Long term deposit and guaranties |
|
|
|
|
Taxes receivable |
|
|
|
|
V. Deferred debts on shares |
|
|
|
|
From affiliated companies |
|
|
|
|
From associated companies |
|
|
|
|
Other companies |
|
|
|
|
VI. Long term debt with creditor |
|
|
|
|
E) SHORT TERM LIABILITIES |
5.733.657,72 |
4.752.466,86 |
5.467.182,25 |
|
I.Negotiable bonds and other negotiable values |
|
|
|
|
Non convertible securities |
|
|
|
|
Convertible securities |
|
|
|
|
Other convertible debentures |
|
|
|
|
Interests from bonds |
|
|
|
|
II.Debt with bank entities |
2.237.674,94 |
1.989.783,27 |
1.988.899,81 |
|
Loans and other debts |
2.237.674,94 |
1.989.783,27 |
1.988.899,81 |
|
Debt interest |
|
|
|
|
Leasing |
|
|
|
|
III. Short term debts with associated and
affiliated companies |
|
|
0,03 |
|
With affiliated companies |
|
|
0,03 |
|
Associated companies |
|
|
|
|
IV. Commercial creditors |
3.139.505,60 |
2.518.218,44 |
3.173.141,27 |
|
Accounts payable |
567,65 |
|
20,00 |
|
Expenses |
3.138.937,95 |
2.518.218,44 |
3.173.121,27 |
|
Bills payable |
|
|
|
|
V. Other non-commercial debt |
260.293,34 |
151.305,94 |
215.366,64 |
|
Government |
243.785,19 |
127.276,03 |
204.117,26 |
|
Bills payable |
|
|
|
|
Other debts |
16.442,65 |
24.029,91 |
1.976,74 |
|
Accounts receivable |
65,50 |
|
9.272,64 |
|
Short term deposits and guarantees |
|
|
|
|
VI. Provisions for current assets |
96.183,84 |
93.159,21 |
89.774,50 |
|
VII. Periodification adjustments |
|
|
|
|
F) SHORT TERM PROVISIONS FOR LIABILITIES AND
EXPENSES |
|
|
|
|
LIABILITIES (A + B + C + D + E + F) |
8.472.265,22 |
7.886.184,96 |
9.066.161,39 |
Liabilities Composition
PROFIT AND LOSS ACCOUNT
Itams of the Profit
and Loss Account
Figures given in €
|
|
31/12/2004 (12) |
31/12/2005 (12) |
31/12/2006 (12) |
|
A) EXPENSES (A.1 a A.16) |
12.779.587,59 |
11.226.771,78 |
11.379.100,49 |
|
A.1.Reduction in stocks of finished goods and
work in progress |
|
|
|
|
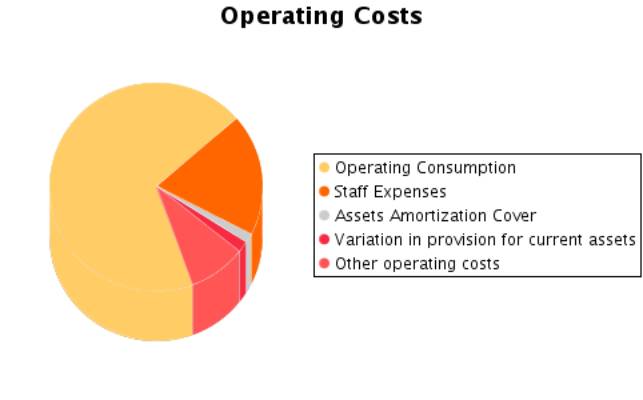
A.2.Supplies |
9.124.809,04 |
7.637.824,09 |
7.698.260,39 |
|
Material consumed |
9.054.664,75 |
6.943.317,21 |
7.636.998,70 |
|
Raw materials consumed |
70.144,29 |
694.506,88 |
61.261,69 |
|
Other expenses |
|
|
|
|
A.3. Labour cost |
2.107.167,66 |
2.040.469,60 |
2.105.275,92 |
|
Wages |
1.548.041,84 |
1.476.706,37 |
1.557.444,78 |
|
Social security expenses |
559.125,82 |
563.763,23 |
547.831,14 |
|
A.4. Assets depreciation |
151.436,35 |
166.508,05 |
163.704,29 |
|
A.5.Variance in the traffic provisions |
150.767,94 |
115.829,73 |
190.445,48 |
|
Variance in provision for inventory |
|
|
|
|
Variance in provision for bad debts |
39.575,18 |
115.829,73 |
190.445,48 |
|
Variance in provision for other current assets |
111.192,76 |
|
|
|
A.6. Other operating costs |
968.112,90 |
1.019.579,12 |
973.358,45 |
|
External costs |
951.789,00 |
1.003.713,53 |
959.695,61 |
|
Taxes |
16.323,90 |
15.865,59 |
13.662,84 |
|
Other day to day expenses |
|
|
|
|
Allowance to reversion fund |
|
|
|
|
A.I.OPERATING RESULT
(B.1+B.2+B.3+B.4-A.1-A.2-A.3-A.4-A.5-A.6) |
528.036,64 |
417.801,58 |
423.884,28 |
|
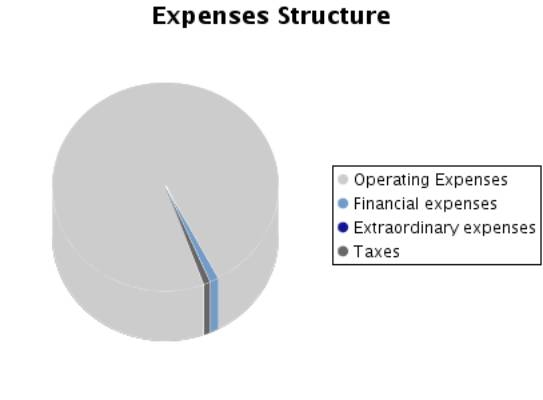
A.7.Financial expenses and similar |
111.307,85 |
139.711,91 |
141.307,33 |
|
Debts with related companies |
|
|
138.846,17 |
|
Debts with associated companies |
|
|
|
|
Other companies debts By debts with third parties and similar expenses |
111.307,85 |
139.711,91 |
2.461,16 |
|
Losses from financial investments |
|
|
|
|
A.8. Variation in financial investment provision |
|
|
|
|
A.9.Negative exchange difference |
|
|
270,64 |
|
A.II.POSITIVE FINANCIAL RESULTS
(B.5+B.6+B.7+B.8-A.7-A.8-A.9) |
|
|
|
|
A.III.PROFIT FROM ORDINARY ACTIVITIES
(A.I+A.II-B.I-B.II) |
441.356,62 |
294.669,22 |
313.092,61 |
|
A.10. Variation in provision in fixed assets |
|
|
|
|
A.11. Losses in fixed assets |
3.225,74 |
5.311,97 |
|
|
A.12. Losses from own shares and bonds |
|
|
|
|
A.13. Extraordinary charges |
8.954,71 |
3.181,93 |
2.498,98 |
|
A.14.Other exercises’ expenses and losses |
|
|
|
|
A.IV.POSITIVE EXTRAORDINARY RESULT
(B.9+B.10+B.11+B.12+B.13-A.10-A.11-A.12-A.13-A.14) |
|
7.445,05 |
6.257,25 |
|
A.V.PROFIT BEFORE TAXES (A.III+A.IV-B.III-B.IV) |
438.793,82 |
302.114,27 |
319.349,86 |
|
A.15.Corporate Taxes |
153.805,40 |
98.355,38 |
103.979,01 |
|
A.16. Other taxes |
|
|
|
|
A.VI.EXERCISE RESULT (PROFIT) (A.V-A.14-A.15) |
284.988,42 |
203.758,89 |
215.370,85 |
|
B) INCOMES (B.1 a B13) |
13.064.576,01 |
11.430.530,67 |
11.594.471,34 |
|
B.1. Turnover |
12.810.409,43 |
11.200.504,01 |
11.375.365,33 |
|
Sales |
13.244.439,32 |
11.200.504,01 |
11.375.365,33 |
|
Services provided |
|
|
|
|
Refunds and sale reminders |
-434.029,89 |
|
|
|
B.2.Increase in inventory of finished goods and works
in progress |
|
|
|
|
B.3.Expenses capitalized |
|
|
|
|
B.4. Other operating income |
219.921,10 |
197.508,16 |
179.563,48 |
|
Other incomes |
173.133,92 |
160.522,33 |
173.563,48 |
|
Grants |
7.212,00 |
36.985,83 |
6.000,00 |
|
Excess in provision for liabilities and charges |
39.575,18 |
|
|
|
B.I.OPERATING LOSSES
(A.1+A.2+A.3+A.4+A.5+A.6-B.1-B.2-B.3-B.4) |
|
|
|
|
B.5.Incomes from share participations |
|
|
|
|
From affiliated companies |
|
|
|
|
From associated companies |
|
|
|
|
From other companies |
|
|
|
|
B.6.Income from other securities and credits to
fixed assets |
|
|
|
|
From affiliated companies |
|
|
|
|
From associated companies |
|
|
|
|
Other companies |
|
|
|
|
B.7.Other interests and similar |
24.627,83 |
16.579,55 |
29.016,31 |
|
From affiliated companies |
|
4.720,54 |
15.743,63 |
|
From associated companies |
|
|
|
|
Other Interests |
24.627,83 |
11.859,01 |
13.272,68 |
|
Profits from investments |
|
|
|
|
B.8. Positive change difference |
|
|
1.769,99 |
|
B.II. NEGATIVE FINANCIAL RESULTS
(A.7+A.8+A.9-B.5-B.6-B.7-B.8) |
86.680,02 |
123.132,36 |
110.791,67 |
|
B.III.LOSSES FROM ORDINARY ACTIVITIES
(B.I+B.II-A.I-A.II) |
|
|
|
|
B.9.B.9. Gains from disposal of fixed assets |
|
1.995,10 |
|
|
B.10.Gains from dealing in own shares |
4.868,20 |
4.868,19 |
|
|
B.11. Paid in surplus |
|
|
|
|
B.12. Extraordinary income |
4.749,45 |
9.075,66 |
8.756,23 |
|
B.13.Other year’s income and profits |
|
|
|
|
B.IV.NEGATIVE EXTRAORDINARY LOSSES
(A.10+A.11+A.12+A.13+A.14-B.9-B.10-B.11-B.12-B.13) |
2.562,80 |
|
|
|
B.V.LOSS BEFORE TAXES (B.III+B.IV-A.III-A.IV) |
|
|
|
|
B.VI.EXERCISE RESULTS (LOSS) (B.V+A.14+A.15) |
|
|
|
Composition of the Profit and
Loss Account
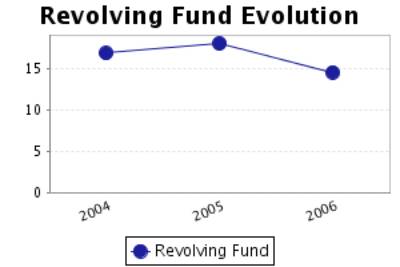
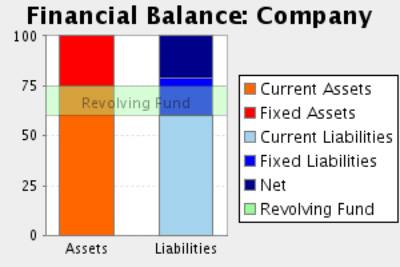
FINANCIAL BALANCE
Here the Main Capital Amounts of the company and the Revolving Fund
Evolution are analysed.
Financial Balance
Table
Figures given in €
|
|
31/12/2004 (12) |
% |
31/12/2005 (12) |
% |
31/12/2006 (12) |
% |
|
A) DUE FROM SHAREHOLDERS FOR UNCALLED CAPITAL |
|
|
|
|
|
|
|
B) FIXED ASSETS |
1.287.577,35 |
15,20 |
1.690.085,60 |
21,43 |
2.261.477,51 |
24,94 |
|
C) DEFERRED EXPENSES |
16.661,07 |
0,20 |
14.011,43 |
0,18 |
11.664,96 |
0,13 |
|
D) CURRENT ASSETS |
7.168.026,80 |
84,61 |
6.182.087,93 |
78,39 |
6.793.018,92 |
74,93 |
|
ASSETS (A + B + C + D) |
8.472.265,22 |
|
7.886.184,96 |
|
9.066.161,39 |
|
|
|
||||||
|
A) SHAREHOLDERS EQUITY |
1.517.058,64 |
17,91 |
1.675.028,20 |
21,24 |
1.887.818,33 |
20,82 |
|
B) DEFERRED INCOME |
4.868,19 |
0,06 |
|
|
|
|
|
C) PROVISIONS FOR LIABILITIES AND EXPENSES |
112.464,69 |
1,33 |
115.505,76 |
1,46 |
96.453,01 |
1,06 |
|
D) LONG TERM LIABILITIES |
1.104.215,98 |
13,03 |
1.343.184,14 |
17,03 |
1.614.707,80 |
17,81 |
|
E) SHORT TERM LIABILITIES |
5.733.657,72 |
67,68 |
4.752.466,86 |
60,26 |
5.467.182,25 |
60,30 |
|
F) SHORT TERM PROVISIONS FOR LIABILITIES AND EXPENSES |
|
|
|
|
|
|
|
LIABILITIES (A + B + C + D + E + F) |
8.472.265,22 |
|
7.886.184,96 |
|
9.066.161,39 |
|
Financial Balance Composition
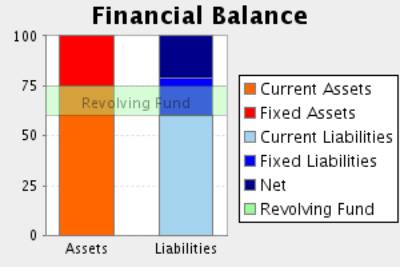
Comments on Financial Balance
In the 2004, the assets of the company were formed in 15,39% of Fixed
Assets and in 84,61% of Current Assets. This assets were financed in 17,96% with
own capitals, and in 14,36% with long term debt and in 67,68% with current
liabilities.
The result of this financial structure is a positive turnover fund of
1.434.369,08 Euros, which is equivalent to 16,93% proportion of the
company’s total assets.
In the 2005, the assets of the company were formed in 21,61% of Fixed
Assets and in 78,39% of Current Assets. This assets were financed in 21,24%
with own capitals, and in 18,50% with long term debt and in 60,26% with current
liabilities.
The result of this financial structure is a positive turnover fund of
1.429.621,07 Euros, which is equivalent to 18,13% proportion of the
company’s total assets.
This measure has diminished with respect to the previous exercise in
0,33% having, however, increased its proportion with respect to the total
assets of the company.
In the 2006, the assets of the company were formed in 25,07% of Fixed
Assets and in 74,93% of Current Assets. This assets were financed in 20,82%
with own capitals, and in 18,87% with long term debt and in 60,30% with current
liabilities.
The result of this financial structure is a positive turnover fund of
1.325.836,67 Euros, which is equivalent to 14,62% proportion of the
company’s total assets.
This measure has diminished with respect to the previous exercise in
7,26% having also diminished its proportion with respect to the total assets of
the company.
RATIOS
Main Ratios
|
|
31/12/2004 (12) |
31/12/2005 (12) |
31/12/2006 (12) |
|
STRUCTURAL RATIOS |
|
|
|
|
Management fund |
1.434.369,08 |
1.429.621,07 |
1.325.836,67 |
|
Management Fund Requirement |
3.608.576,60 |
3.377.612,61 |
3.263.504,24 |
|
Indebtedness (%) |
82,04 |
78,76 |
79,18 |
|
External Funds on Net Worth |
4,57 |
3,71 |
3,80 |
|
GENERAL ACTIVITY RATIO |
|
|
|
|
Turnover Increase (%) |
14,97 |
-12,57 |
1,56 |
|
Added value growth (%) |
13,85 |
-6,70 |
5,21 |
|
Cash Flow |
587.192,71 |
486.096,67 |
569.520,62 |
|
Labour Productivity |
1,39 |
1,34 |
1,37 |
|
Assets turnover |
1,51 |
1,42 |
1,26 |
|
Breakdown Point |
11.268.596,03 |
10.131.557,57 |
10.284.933,01 |
|
Security Margin of the Breakdown Point (%) |
13,52 |
11,11 |
10,99 |
|
ACTIVITY RATIOS |
|
|
|
|
Average Payment Period |
124 |
119 |
148 |
|
Average Collection Period |
98 |
104 |
103 |
|
Inventory Turnover Period |
101 |
93 |
110 |
|
SOLVENCY RATIOS |
|
|
|
|
Payback Capacity |
0,08 |
0,08 |
0,08 |
|
Assets Guarantee |
1,22 |
1,27 |
1,26 |
|
Short Term Debts Proportion (%) |
82,50 |
76,52 |
76,16 |
|
Interest Coverage |
4,97 |
3,25 |
3,75 |
|
LIQUIDITY RATIOS |
|
|
|
|
Current Ratio |
1,25 |
1,30 |
1,24 |
|
Immediate liquidity |
0,01 |
0,01 |
0,01 |
|
Treasury |
-2.174.207,52 |
-1.947.991,54 |
-1.937.667,57 |
|
Sales on Current Assets |
643 |
652 |
603 |
Results Analysis Ratios
|
|
31/12/2004 (12) |
31/12/2005 (12) |
31/12/2006 (12) |
|
Economic profitability (%) |
6,23 |
5,30 |
4,68 |
|
Operating Profitability (%) |
4,12 |
3,73 |
3,73 |
|
Equity gearing |
4,65 |
3,32 |
3,55 |
|
Financial profitability (%) |
18,73 |
12,16 |
11,41 |
|
General Profitability (%) |
2,22 |
1,82 |
1,89 |
Comments on the Results Analysis
Ratios
The economic profitability in the year2005 achieved a 5,30% positive level,
due to a 3,73% economic margin and to an assets turnover of1,42%.
The economic profitability in the year has reduced from 6,23% up to
5,30% of2005, even if it remains positive. This fall is due to the decrease in
operating profitability, that has passe from 4,12% to 3,73%, as assets turnover
whose index has passed from 1,51 to 1,42%.
Financial profitability on 2005 achieved a 12,16%.
The company’s financial structure has instigated its economic
profitability with an indebtedness level of 3,32.
The general profitability on 2005 achieved a 1,82%.
The economic profitability in the year2006 achieved a 4,68% positive
level, due to a 3,73% economic margin and to an assets turnover of1,26%.
The economic profitability in the year has reduced from 5,30% up to 4,68%
of2006, even if it remains positive. The decrease in assets turnover from 1,42%
to the current level of 1,26 has been the cause of this fall as operating
profitability has maintained at the same level of 3,73%.
Financial profitability on 2006 achieved a 11,41%.
The company’s financial structure has instigated its economic
profitability with an indebtedness level of 3,55.
The general profitability on 2006 achieved a 1,89%.
SECTORIAL ANÁLYSIS
Large Capital Amounts
and Financial Balance
Figures given in %
|
|
COMPANY (2006) |
SECTOR |
DIFFERENCE |
DIFFERENCE RELATIVE |
|
ASSETS |
|
|
|
|
|
A) DUE FROM
SHAREHOLDERS FOR UNCALLED CAPITAL |
|
0,02 |
|
|
|
B) FIXED ASSETS |
24,94 |
21,11 |
3,83 |
18,15 |
|
C) DEFERRED
EXPENSES |
0,13 |
0,23 |
-0,10 |
-42,73 |
|
D) CURRENT
ASSETS |
74,93 |
78,65 |
-3,72 |
-4,72 |
|
ASSETS (A + B +
C + D) |
100 |
100 |
|
|
|
|
|
|
|
|
|
|
COMPANY (2006) |
SECTOR |
DIFFERENCE |
DIFFERENCE RELATIVE |
|
LIABILITIES |
|
|
|
|
|
A) SHAREHOLDERS
EQUITY |
20,82 |
38,63 |
-17,81 |
-46,10 |
|
B) DEFERRED
INCOME |
|
0,13 |
|
|
|
C) PROVISIONS
FOR LIABILITIES AND EXPENSES |
1,06 |
0,29 |
0,77 |
264,26 |
|
D) LONG TERM
LIABILITIES |
17,81 |
6,17 |
11,64 |
188,61 |
|
E) SHORT TERM LIABILITIES |
60,30 |
54,73 |
5,57 |
10,18 |
|
F) SHORT TERM
PROVISIONS FOR LIABILITIES AND EXPENSES |
|
0,05 |
|
|
|
LIABILITIES (A + B + C + D + E + F) |
100 |
100 |
|
|
Sectorial Financial Balance
Comparison
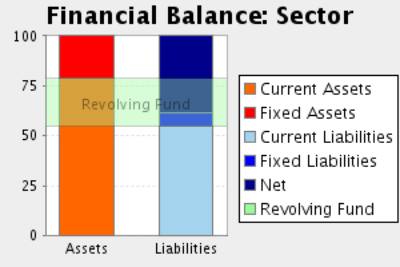
Comments to the Sectorial
Analysis
In the 2006, the assets of the company were formed in 25,07% of fixed
assets and in 74,93Current Assets % In the sector, the proportion of fixed
assets was of 21,35%, 17,40% inferior, and the proportion of current assets was
of 78,65%, 4,72% superior.
The assets were financed in the company in 20,82% with own capitals , in
18,87% with fixed liabilities and in 60,30% with current liabilities In the
sector, the self financing represented 38,76%, 46,28% superior. On the other
hand the long term debts represented in the sector an average of 6,46%
financing, with a relative difference of 192,01% in favour of the companyAnd,
short term liabilities represented in the sector an average of 54,78%
financing, with a relative difference of 10,08% in favour of the company
The result of this company’s financial structure is a turnover fund that
represents 14,62% of the total assets; in the sector, this same proportion is
23,87%, therefore, we can say that the company’s turnover fund is 38,75%
smaller than the sector one.
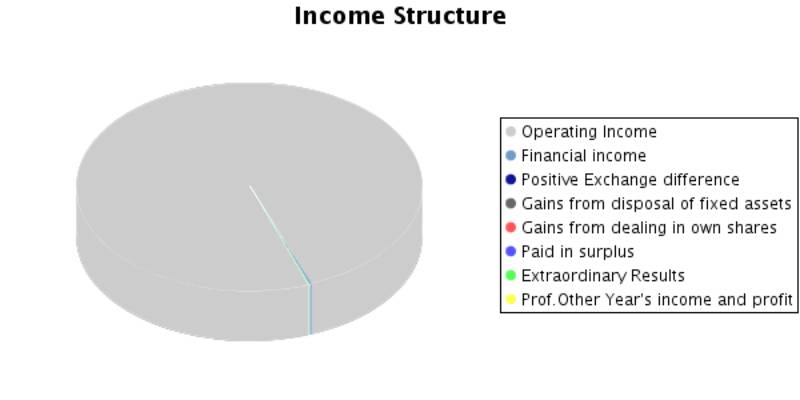
Analytical Account of Results
Figures given in %
|
|
COMPANY (2006) |
SECTOR |
DIFFERENCE |
DIFFERENCE RELATIVE |
|
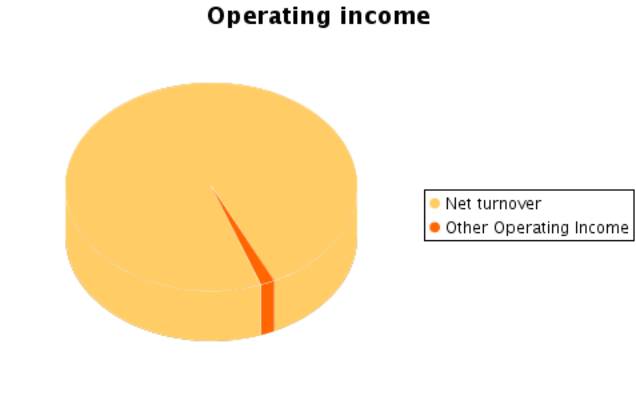
Turnover |
98,45 |
98,98 |
-0,53 |
-0,54 |
|
Other operating income |
1,55 |
1,02 |
0,53 |
51,96 |
|
Production Value |
100,00 |
100,00 |
0,00 |
0,00 |
|
Operating expenses |
66,62 |
72,76 |
-6,14 |
-8,44 |
|
Other operation expenses |
8,42 |
8,60 |
-0,18 |
-2,10 |
|
Added value |
24,95 |
18,64 |
6,31 |
33,85 |
|
Labour cost |
18,22 |
11,05 |
7,17 |
64,87 |
|
Gross Economic Result |
6,73 |
7,59 |
-0,86 |
-11,32 |
|
Assets depreciation |
1,42 |
1,36 |
0,06 |
4,26 |
|
Variation in provision for current assets and bad debt losses |
1,65 |
0,47 |
1,18 |
249,58 |
|
Net Economic Result |
3,67 |
5,75 |
-2,08 |
-36,22 |
|
Financial income |
0,27 |
0,65 |
-0,38 |
-58,20 |
|
Financial Charges |
1,23 |
0,84 |
0,39 |
46,43 |
|
Variation in financial investment provision |
|
0,02 |
|
|
|
Ordinary Activities Result |
2,71 |
5,54 |
-2,84 |
-51,13 |
|
Extraordinary income |
0,08 |
0,46 |
-0,38 |
-82,72 |
|
Extraordinary charges |
0,02 |
0,25 |
-0,23 |
-91,90 |
|
Variation in provision in fixed assets |
|
0,14 |
|
|
|
Results before Taxes |
2,76 |
5,62 |
-2,86 |
-50,85 |
|
Corporate taxes |
0,90 |
1,80 |
-0,90 |
-50,00 |
|
Net Result |
1,86 |
3,82 |
-1,96 |
-51,26 |
|
Assets depreciation |
1,42 |
1,36 |
0,06 |
4,26 |
|
Change of Provisions |
1,65 |
0,63 |
1,02 |
161,08 |
|
Net Self-Financing |
4,93 |
5,81 |
-0,88 |
-15,16 |
Main Ratios
|
|
COMPANY (2006) |
PTILE25 |
PTILE50 |
PTILE75 |
|
STRUCTURAL RATIOS |
|
|
|
|
|
Management fund |
1.325.836,67 |
737,55 |
1.684,00 |
3.623,76 |
|
Management Fund Requirement |
3.263.504,24 |
-1.006,88 |
319,24 |
1.543,81 |
|
Indebtedness (%) |
79,18 |
49,32 |
63,88 |
76,98 |
|
External Funds on Net Worth |
3,80 |
0,97 |
1,77 |
3,34 |
|
GENERAL ACTIVITY RATIO |
|
|
|
|
|
Turnover Increase (%) |
1,56 |
1,64 |
9,38 |
19,31 |
|
Added value growth (%) |
5,21 |
-0,92 |
10,85 |
25,43 |
|
Cash Flow |
569.520,62 |
281,10 |
585,48 |
1.060,43 |
|
Labour Productivity |
1,37 |
1,34 |
1,63 |
2,11 |
|
Assets turnover |
1,26 |
1,22 |
1,58 |
2,03 |
|
Breakdown Point |
10.284.933,01 |
6.809.761,38 |
8.916.894,65 |
13.530.885,88 |
|
Security Margin of the Breakdown Point (%) |
10,99 |
9,88 |
19,31 |
30,33 |
|
ACTIVITY RATIOS |
|
|
|
|
|
Average Payment Period |
148 |
32 |
80 |
122 |
|
Average Collection Period |
103 |
85 |
116 |
141 |
|
Inventory Turnover Period |
110 |
22 |
43 |
68 |
|
SOLVENCY RATIOS |
|
|
|
|
|
Payback Capacity |
0,08 |
0,06 |
0,12 |
0,26 |
|
Assets Guarantee |
1,26 |
1,29 |
1,56 |
2,02 |
|
Short Term Debts Proportion (%) |
76,16 |
88,95 |
97,21 |
99,85 |
|
Interest Coverage |
3,75 |
2,71 |
7,18 |
22,51 |
|
LIQUIDITY RATIOS |
|
|
|
|
|
Current Ratio |
1,24 |
1,17 |
1,41 |
1,86 |
|
Immediate liquidity |
0,01 |
0,04 |
0,12 |
0,34 |
|
Treasury |
-1.937.667,57 |
-1.065,28 |
59,14 |
930,76 |
|
Sales on Current Assets |
603 |
553 |
680 |
882 |
Results Analysis Ratios
|
|
COMPANY (2006) |
PTILE25 |
PTILE50 |
PTILE75 |
|
Economic profitability (%) |
4,68 |
3,79 |
7,56 |
13,28 |
|
Operating Profitability (%) |
3,73 |
2,27 |
4,90 |
8,51 |
|
Equity gearing |
3,55 |
1,78 |
2,49 |
3,56 |
|
Financial profitability (%) |
11,41 |
8,21 |
14,69 |
24,24 |
|
General Profitability (%) |
1,89 |
1,33 |
3,17 |
6,12 |
NOTES
Here is our provisional report, until we
receive the last balance sheets for this company for 2007.
FOREIGN EXCHANGE
RATES
|
Currency |
Unit
|
Indian Rupees |
|
US Dollar |
1 |
Rs.43.79 |
|
UK Pound |
1 |
Rs.80.05 |
|
Euro |
1 |
Rs.64.56 |
RATING
EXPLANATIONS
|
RATING |
STATUS |
PROPOSED CREDIT LINE |
|
|
>86 |
Aaa |
Possesses an extremely sound financial base with the strongest capability
for timely payment of interest and principal sums |
Unlimited |
|
71-85 |
Aa |
Possesses adequate working capital. No caution needed for credit
transaction. It has above average (strong) capability for payment of interest
and principal sums |
Large |
|
56-70 |
A |
Financial & operational base are regarded healthy. General
unfavourable factors will not cause fatal effect. Satisfactory capability for
payment of interest and principal sums |
Fairly Large |
|
41-55 |
Ba |
Overall operation is considered normal. Capable to meet normal
commitments. |
Satisfactory |
|
26-40 |
B |
Unfavourable & favourable factors carry similar weight in credit
consideration. Capability to overcome financial difficulties seems comparatively
below average. |
Small |
|
11-25 |
Ca |
Adverse factors are apparent. Repayment of interest and principal sums
in default or expected to be in default upon maturity |
Limited with
full security |
|
<10 |
C |
Absolute credit risk exists. Caution needed to be exercised |
Credit not
recommended |
|
NR |
In view of the lack of information, we have no basis upon which to
recommend credit dealings |
No Rating |
|
This score serves as a reference to assess SC’s credit risk
and to set the amount of credit to be extended. It is calculated from a
composite of weighted scores obtained from each of the major sections of this
report. The assessed factors and their relative weights (as indicated through
%) are as follows:
Financial
condition (40%) Ownership
background (20%) Payment
record (10%)
Credit history
(10%) Market trend
(10%) Operational
size (10%)