![]()
MIRA
INFORM REPORT
|
Report Date : |
01.09.2008 |
IDENTIFICATION
DETAILS
|
Name : |
MESPACK S.L. |
|
|
|
|
Registered Office : |
Street Mar
Adriatic, 18 (Pg Ind Torre Rector), Cp 08130, Santa Perpetua
De Mogoda Barcelona |
|
|
|
|
Country : |
Spain |
|
|
|
|
Financials (as on) : |
31.12.2006 |
|
|
|
|
Date of Incorporation : |
|
|
|
|
|
Legal Form : |
Limited Liability Company |
|
|
|
|
Line of Business : |
Manufacturer of Machinery |
RATING &
COMMENTS
|
MIRA’s Rating : |
A |
|
RATING |
STATUS |
PROPOSED CREDIT LINE |
|
|
56-70 |
A |
Financial & operational base are regarded healthy. General
unfavourable factors will not cause fatal effect. Satisfactory capability for
payment of interest and principal sums |
Fairly Large |
|
Maximum Credit Limit : |
500.000,00 € |
|
|
|
|
Status : |
Good |
|
|
|
|
Payment Behaviour : |
Regular |
|
|
|
|
Litigation : |
Clear |
FINANCIAL REPORT
MESPACK S.L.
TAX NUMBER: B60718749
EXECUTIVE SUMMARY
Identification
Current Business Name: MESPACK S.L.
Other names: NO
Current Address: STREET MAR
ADRIATIC, 18 (PG IND TORRE RECTOR), CP 08130, SANTA PERPETUA DE
MOGODA BARCELONA
Telephone number: 935747227 Fax: 935600200
URL: www.mespack.com
Commercial Risk
Credit Appraisal: 500.000,00 €
RAI: NO
Legal Actions: NO
Financial Information
Latest Balance sheet sales (2006): 13.272.000,00 € (MERCANTILE REGISTER)
Result: 1.520.000 €
Total Assets: 9.862.000 €
Social Capital: 502.000,00 €
Employees: 61
Commercial Information
Constitution Date: 15/12/1994
Business activity: Mfg. of
machinery nec.
NACE Code: 2924
International Operations: Imports and
Exports
Corporate Structure
Administrator:
Other Complementary Information
Latest proceeding published in BORME: 04/02/2008 Registration
of accounts
Bank Entities: Yes
Credit Appraisal
Maximum Credit
(from 0 a 6,000,000 €)
Favourable to 500.000,00 €
Rating Evolution
Financial Situation
Fiscal year2006
|
Treasury |
Excellent |
|
Indebtedness |
Average |
|
Profitability |
Good |
|
Balance |
Excellent |
Performance
|
Legal Actions |
None or Negligible |
|
Business
Trajectory |
Excellent |
RAI 
COMPANY NOT REGISTERED IN THE R.A.I.
This company is not registered in the Disputed Bills register (R.A.I.)
DATE AND TIME OF THE CONSULTATION: 27/08/2008
08:08:02
INCIDENTS

Summary
LEGAL ACTIONS: No legal
incidences registered
CLAIM FILED AGAINST THE ADMINISTRATION: No administrative
claims registered.
AFFECTED BY: No significant
element.
FINANCIAL ELEMENTS AND SECTORIAL
COMPARATIVE
FINANCIAL ELEMENTS
Figures given in thousands €
|
|
2004 (12) |
2005 (12) |
2006 (12) |
% ASSETS |
|
|
|
|
|
|
BALANCE SHEET ANALYSIS |
|
|
|
|
|
|
|
|
|
|
OWN FUNDS |
972,00 |
2.104,00 |
3.264,00 |
33,10 |
|
|
|
|
|
|
DEBT |
3.888,00 |
4.664,00 |
6.598,00 |
66,90 |
|
|
|
|
|
|
FIXED ASSETS |
1.013,00 |
398,00 |
377,00 |
3,82 |
|
|
|
|
|
|
TOTAL ASSETS |
4.860,00 |
6.768,00 |
9.862,00 |
|
|
|
|
|
|
|
|
|
|
|
|
|
|
|
|
|
|
|
2004 (12) |
2005 (12) |
2006 (12) |
% SALES |
|
|
|
|
|
|
PROFIT AND LOSS ACCOUNT ANALYSIS |
|
|
|
|
|
|
|
|
|
|
SALES |
6.886,00 |
10.857,00 |
13.272,00 |
|
|
|
|
|
|
|
ADDED VALUE |
2.639,00 |
4.005,00 |
5.368,00 |
40,45 |
|
|
|
|
|
|
EBITDA |
577,00 |
1.643,00 |
2.595,00 |
19,55 |
|
|
|
|
|
|
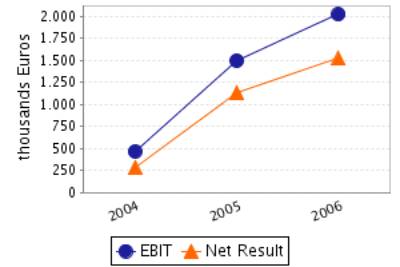
EBIT |
464,00 |
1.496,00 |
2.023,00 |
15,24 |
|
|
|
|
|
|
NET RESULT |
282,00 |
1.133,00 |
1.520,00 |
11,45 |
|
|
|
|
|
Balance Sheets Items
Analysis
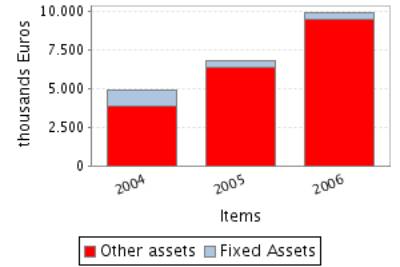
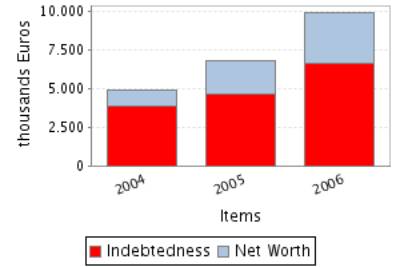
Balance Sheet Comments
Total assets of the company grew 39,26% between 2004 and 2005.
In spite of the assets’ growth, the fixed assets decreased 60,71%.
This growth has been financed, on a wider scale, with a Shareholders’
equity increase of 116,46% and in a smaller proportion with an debt increase of
19,96%.
Total assets of the company grew 45,72% between 2005 and 2006.
In spite of the assets’ growth, the fixed assets decreased 5,28%.
This growth has been financed, on a wider scale, with a Shareholders’
equity increase of 55,13% and in a smaller proportion with an debt increase of
41,47%.
Profit and Loss Account Analysis
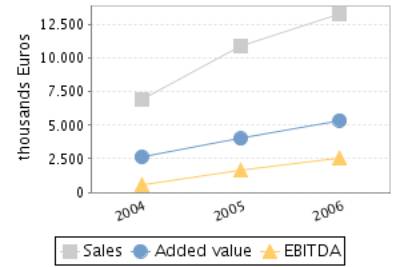
Profit and Loss Account Comments
The company’s sales figure grew 57,67% between 2004 and 2005.
The company’s EBIT grew 222,41% between 2004 and 2005.
This evolution implies an increase in the company’s operating
profitability.
The result of these variations is an increase of the company’s Economic
Profitability of 131,52% in the analysed period, being this profitability of
22,10% in the year 2005.
The company’s Net Result grew 301,77% between 2004 and 2005.
This evolution, compared to the EBIT’s performance, implies that the
financial and extraordinary activities have had a positive effect in the
company’s Financial Profitability.
The result of these variations is an increase of the company’s Economic
Profitability of 85,61% in the analysed period, being equal to 53,85% in the
year 2005.
The company’s sales figure grew 22,24% between 2005 and 2006.
The company’s EBIT grew 35,23% between 2005 and 2006.
This evolution implies an increase in the company’s operating
profitability.
The result of these variations is a decrease of the company’s Economic
Profitability of 7,20% in the analysed period, being this profitability of
20,51% in the year 2006.
The company’s Net Result grew 34,16% between 2005 and 2006.
This evolution, compared to the EBIT’s performance, implies that the
financial and extraordinary activities have had a negative effect in the
company’s Financial Profitability.
The result of these variations is a reduction of the company’s
profitability of 13,52% in the analysed period, being equal to 46,57% in the
year 2006.
ANNUAL FINANCIAL REPORT
ADDITIONAL DATA
Source: annual financial report 2006
Results Distribution
Figures given in €
|
DISTRIBUTION
BASE |
DISTRIBUTION TO |
||
|
Profit and Loss |
1.520.000,00 |
Retained earnings |
0,00 |
|
Carry Over |
0,00 |
Voluntary Reserve |
1.520.000,00 |
|
Voluntary reserves |
0,00 |
Prior years losses |
0,00 |
|
Reserves |
0,00 |
Carry Over |
0,00 |
|
Other concepts |
0,00 |
Other funds |
0,00 |
|
Total of Amounts to be distributed |
1.520.000,00 |
Dividends |
0,00 |
|
|
|
Other Applications |
0,00 |
Auditing
Auditors’ opinion: FAVOURABLE WITH RESERVATIONS
Auditor: ACR AUDITECNIA S.L.
Auditing exceptions:
EXISTE UNA DEMANDA CONTRA LA SOCIEDAD DE FECHA 12 DE MAYO DE 2006, POR
UNA SUPUESTA INFRACCION DE UNAPATENTE ESPANOLA. A FECHA ACTUAL, NO NOS ES
POSIBLE EVALUAR DE MODO OBJETIVO EL EFECTO, SI LO HUBIESE, QUE LA RESOLUCION
DEFINITIVA DE LA MENCIONADA DEMANDA PUDIERA TENER EN LAS CUENTAS ANUALES
ADJUNTAS.
COMPARATIVE SECTOR ANALYSIS
Values table
Figures expressed in %
|
|
COMPANY (2006) |
SECTOR |
DIFFERENCE |
DIFFERENCE RELATIVE |
|
|
|
|
|
|
BALANCE SHEET
ANALYSIS: % on the total assets |
|
|
|
|
|
|
|
|
|
|
OWN FUNDS |
33,10 |
39,85 |
-6,76 |
-16,95 |
|
|
|
|
|
|
DEBT |
66,90 |
60,15 |
6,76 |
11,23 |
|
|
|
|
|
|
FIXED ASSETS |
3,82 |
28,51 |
-24,69 |
-86,59 |
|
|
|
|
|
|
|
|
|
|
|
|
|
|
|
|
|
|
COMPANY (2006) |
SECTOR |
DIFFERENCE |
DIFFERENCE RELATIVE |
|
|
|
|
|
|
PROFIT AND LOSS ACCOUNT ANALYSIS: % on the total
operating income |
|
|
|
|
|
|
|
|
|
|
SALES |
99,64 |
97,67 |
1,97 |
2,02 |
|
|
|
|
|
|
ADDED VALUE |
40,30 |
29,99 |
10,31 |
34,38 |
|
|
|
|
|
|
EBIT |
15,19 |
7,71 |
7,48 |
97,06 |
|
|
|
|
|
|
NET RESULT |
11,41 |
5,07 |
6,34 |
124,94 |
|
|
|
|
|
Sector Composition
Compared sector (NACE): 292
Number of companies: 73
Size (Sales Figure) : 7.000.000,00 - 40.000.000,00 Euros
Comments on the sectorial comparative
Compared to its sector the assets of the companies show an inferior
proportion of fixed assets. Specifically the difference with the sector average
is -24,69% , which means a relative difference of -86,59% .
In liabilities composition the company appeals on a wider scale to self
financing, being the proportion of net worth of 6,76% inferior, which means a
relative difference of 16,95% 6,76% more than the sector, which means a
difference of 11,23% .
The proportion that the sales mean to the company’s total ordinary
income is 99,64%, 1,97% higher than in the sector, which means a relative
difference of 2,02% .
The company’s EBIT was positive and was 15,19% with regard to the total
ordinary income, 7,48% higher than in the sector, which means a relative
difference of 97,06% .
The company’s capacity to generate operating income is higher than the
one of the sector as its ratio EBIT/Sales is higher (ES Company versus ES
Sector).
The company’s net result was positive and equal to 11,41% with regard to
the total ordinary income, 6,34% less than the sector, which means a relative
difference of 124,94% .
The financial and extraordinary results and the tax impact have had a
less negative impact on the Net result in the company than in the sector; as a
consequence, the company shows a better Net Result/EBIT ratio (REBEmpresa vs.
REBSector).
ADDRESSES
Current Legal Seat Address:
STREET MAR ADRIATIC, 18 (PG IND TORRE RECTOR)
08130 SANTA PERPETUA DE MOGODA BARCELONA
Previous Seat Address:
STREET ARGENTERS - PG IND SANTIGA, 10
08130
SANTA PERPETUA DE MOGODA BARCELONA
Characteristics of the current address
Type of premises: office, factory,
warehouse
Property: rented
Local Situation: secondary
CORPORATE STRUCTURE
ADMINISTRATIVE LINKS
Main Board members, Directors and Auditor ![]()
|
POSITION |
SURNAMES AND
NAME |
APPOINTMENT DATE |
|
|
ADMINISTRATOR |
GEINFISAR 99 SL |
25/06/2004 |
|
|
ADMINISTRATOR |
EMIG ENRIC MARTI INVESTMENTS GROUP SL |
25/06/2004 |
|
|
AUDITOR |
APPOINTMENT DATE |
||
|
ACR AUDITECNIA SL |
21/06/2007 |
||
FINANCIAL LINKS
|
|
BUSINESS NAME |
CIF / COUNTRY |
% |
SOURCE |
DATA INF. |
|
|
EMIG ENRIC MARTI INVESTMENTS GROUP S.L. |
B62796024 |
46,00 |
TRADE REG. |
31/12/2006 |
|
|
GEINFISAR 99 S.L. |
B62029228 |
46,00 |
TRADE REG. |
31/12/2006 |
|
|
VAN ZIJP REINOUT |
|
5,00 |
OWN SOURCES |
12/06/2008 |
|
|
MORA FRANCISCO |
|
3,00 |
OWN SOURCES |
12/06/2008 |
CREDIT INFORMATION
Constitution Date: 15/12/1994
Business activity 
Activity: Mfg. of machinery nec.
NACE Code: 2924
NACE Activity: Manufacture of other general purpose machinery
n.e.c.
Business: SE AMPLIA. DISENO, FABRICACION, INSTALACION,
REPARACION Y MANTENIMIENTO DE MAQUINARIA PARA EL ENVASADO DE PRODUCTOS Y SUS
COMPLEMENTOS, Y DE APARATOS E INSTALACIONES DE AGUA, GAS Y ELECTRICIDAD EN
GENERAL, ETC.
Activity description: COMERCIO AL MAYOR DE MAQUINARIA DE ENVASE Y
EMBALAJE
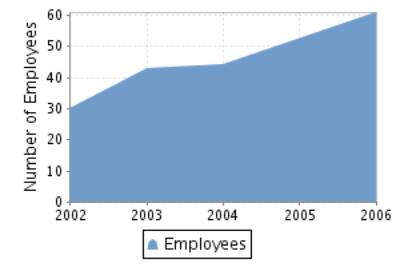
Employees 
Number of total employees: 61 (2006)
Number of fixed employees: 100,00%
Number of temporary employees: 0,00%
Employees evolution
COMMERCIAL OPERATIONS 
SUPPLIERS
|
BUSINESS NAME |
INTERNATIONAL |
|
EMIG SL |
NO |
|
GEINFISAR SL |
NO |
2 proveedores
SALES
Collection (estimated):
Export Percentage: 98%
Exports to: Polonia, Singapur y Alemania
National Distribution: 2%
Banks 
|
ENTITY |
BRANCH |
ADDRESS |
TOWN OR CITY |
PROVINCE |
|
BANCO DE SABADELL, S.A. |
0034 |
C JOAN PRIM 000036 |
GRANOLLERS |
Barcelona |
1 bank entities registered
Brands, Signs and Commercial
Names 
Brand name: MESPACK (Valid)
Type: JOINT Date: 05/01/2001
LEGAL STRUCTURE
Constitution Data
Register Date: 15/12/1994
Register town: Barcelona
Announcement number: 45574
Legal form: LIMITED LIABILITY
COMPANY
Social Capital: 7.212,15 €
Current structure data 
Current Legal Form: LIMITED LIABILITY
COMPANY
Current Capital: 502.000,00 €
Legal Aspects
Obligation to fill in Financial
Statements: YES
Chamber census: YES (2006)
Listed on a Stock Exchange: NO
B.O.R.M.E.(Official Companies
Registry Gazette) 
Registered Proceedings
|
PROCEEDINGS |
DATE |
NOTICE NUM. |
TRADE REG. |
|
Resignations |
31/07/2007 |
400538 |
Barcelona |
|
Appointments |
21/06/2007 |
334344 |
Barcelona |
Other Proceedings published
|
PROCEEDINGS |
DATE |
NOTICE NUM. |
TRADE REG. |
|
Registration of
accounts (2006) Individual |
04/02/2008 |
55376 |
Barcelona |
|
Registration of
accounts (2005) Individual |
26/07/2007 |
236368 |
Barcelona |
|
Registration of
accounts (2004) Individual |
07/11/2005 |
862550 |
Barcelona |
FINANCIAL INFORMATION
The information on the last account contained in this report is
extracted from the Mercantile Register file of the legal address of the Company
and dated 06/02/2008.
BALANCE SHEET
Assets
Figures given in thousands €
|
|
31/12/2004 (12) |
31/12/2005 (12) |
31/12/2006 (12) |
|
A) DUE FROM SHAREHOLDERS FOR UNCALLED CAPITAL |
|
|
|
|
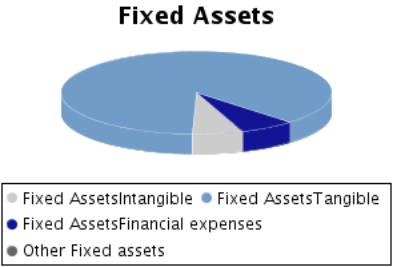
B) FIXED ASSETS |
1.013,00 |
398,00 |
377,00 |
|
I. Incorporation costs |
1,00 |
|
|
|
II. Intangible fixed assets |
923,00 |
58,00 |
23,00 |
|
R & D expenses |
189,00 |
189,00 |
539,00 |
|
Concessions, patents, licences , trademarks |
3,00 |
5,00 |
5,00 |
|
Goodwill |
|
|
|
|
Acquired rights from finance leases |
|
|
|
|
Software |
34,00 |
34,00 |
55,00 |
|
Leasing |
886,00 |
40,00 |
|
|
Cash advance |
|
|
|
|
Provisions |
|
|
|
|
Depreciation |
-189,00 |
-210,00 |
-576,00 |
|
III. Tangible fixed assets |
88,00 |
337,00 |
329,00 |
|
Property, plant and equipment |
|
|
|
|
Machinery, equipment and other |
10,00 |
10,00 |
45,00 |
|
Other property plant and equipment |
80,00 |
339,00 |
384,00 |
|
Prepaid expenses on fixed assets |
|
|
|
|
Other assets |
89,00 |
125,00 |
145,00 |
|
Provisions |
|
|
|
|
Depreciation |
-91,00 |
-137,00 |
-245,00 |
|
IV. Financial fixed assets |
1,00 |
3,00 |
25,00 |
|
Shares in affiliated companies |
|
|
|
|
Receivables in affiliated companies |
|
|
|
|
Shares in associated companies |
|
|
|
|
Loans to associated companies |
|
|
|
|
Securities |
|
|
|
|
Other loans |
|
|
23,00 |
|
Long term deposits and guarantees |
1,00 |
3,00 |
2,00 |
|
Provisions |
|
|
|
|
Taxes receivable |
|
|
|
|
V.Owners equity |
|
|
|
|
VI.Long term trade liabilities |
|
|
|
|
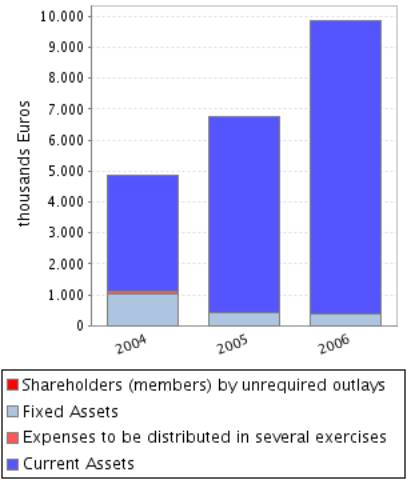
C) DEFERRED EXPENSES |
103,00 |
|
|
|
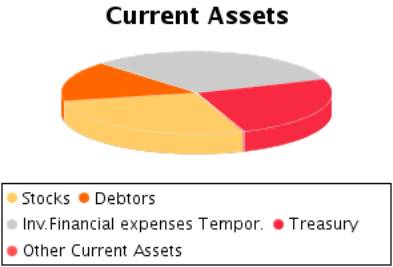
D) CURRENT ASSETS |
3.744,00 |
6.370,00 |
9.485,00 |
|
I. Shareholders by required outlays |
|
|
|
|
II. Stocks |
1.519,00 |
1.943,00 |
2.590,00 |
|
Goods available for sale |
|
|
|
|
Raw material inventory |
774,00 |
1.199,00 |
1.592,00 |
|
Work in Progress |
336,00 |
633,00 |
1.036,00 |
|
Finished goods |
387,00 |
|
|
|
Subproducts and recycled materials |
22,00 |
104,00 |
37,00 |
|
Cash advance |
|
7,00 |
|
|
Provisions |
|
|
-75,00 |
|
III. Debtors |
955,00 |
1.596,00 |
1.505,00 |
|
Clients |
818,00 |
1.609,00 |
1.537,00 |
|
Amounts owned by affiliated companies |
|
|
|
|
Amounts owned by associated companies |
|
|
|
|
Other debts |
84,00 |
3,00 |
3,00 |
|
Staff Expenses |
|
|
7,00 |
|
Government |
118,00 |
98,00 |
90,00 |
|
Provisions |
-65,00 |
-114,00 |
-132,00 |
|
IV. Temporary financial investment |
277,00 |
362,00 |
3.030,00 |
|
Shares in affiliated companies |
|
|
|
|
Receivables in affiliated companies |
|
|
|
|
Shares in associated companies |
|
|
|
|
Loans to associated companies |
|
|
|
|
Short term investment |
276,00 |
361,00 |
3.029,00 |
|
Other loans |
|
|
|
|
Short Term Deposit and guarantees |
1,00 |
1,00 |
1,00 |
|
Provisions |
|
|
|
|
V. Short-term own shares |
|
|
|
|
VI. Treasury |
993,00 |
2.451,00 |
2.343,00 |
|
VII. Periodification adjustments |
|
18,00 |
17,00 |
|
ASSETS (A + B + C + D) |
4.860,00 |
6.768,00 |
9.862,00 |
Assets composition
Liabilities
Figures given in thousands €
|
|
31/12/2004 (12) |
31/12/2005 (12) |
31/12/2006 (12) |
|
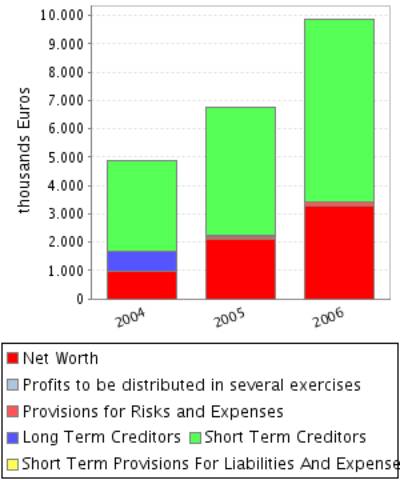
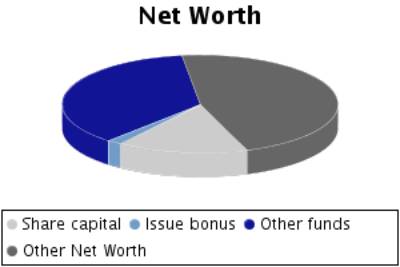
A) SHAREHOLDERS EQUITY |
972,00 |
2.104,00 |
3.264,00 |
|
I. Share capital |
502,00 |
502,00 |
502,00 |
|
II. Issue bonus |
59,00 |
59,00 |
59,00 |
|
III.Revaluation reserve |
|
|
|
|
IV.Reserves |
164,00 |
410,00 |
1.183,00 |
|
Retained earnings |
17,00 |
45,00 |
158,00 |
|
Sinking fund from owner equity |
|
|
|
|
Reserve for the parent company capital |
|
|
|
|
Statutory reserve |
|
|
|
|
Other funds |
147,00 |
365,00 |
1.025,00 |
|
Capital adjustments in Euros |
|
|
|
|
V.Results from previous years |
-35,00 |
|
|
|
Carry Over |
|
|
|
|
Prior years losses |
-35,00 |
|
|
|
Loans from partners for losses compensation |
|
|
|
|
VI.Profit and Losses |
282,00 |
1.133,00 |
1.520,00 |
|
VII.Dividend paid during the year |
|
|
|
|
VIII.Own shares for capital reduction |
|
|
|
|
B) DEFERRED INCOME |
|
|
|
|
Capital grants |
|
|
|
|
Positive change difference |
|
|
|
|
Other deferred income |
|
|
|
|
Fiscal deferred income |
|
|
|
|
C) PROVISIONS FOR LIABILITIES AND EXPENSES |
|
106,00 |
152,00 |
|
Provision for pensions plans |
|
|
|
|
Provision for taxes |
|
|
|
|
Other provisions |
|
106,00 |
152,00 |
|
Reversion fund |
|
|
|
|
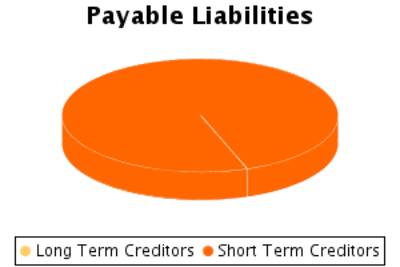
D) LONG TERM LIABILITIES |
692,00 |
12,00 |
|
|
I.Negotiable bonds and other negotiable values |
|
|
|
|
Non convertible securities |
|
|
|
|
Convertible securities |
|
|
|
|
Other convertible debentures |
|
|
|
|
II.Debt with bank entities |
692,00 |
12,00 |
|
|
Long term bank loans |
30,00 |
12,00 |
|
|
Leasing |
662,00 |
|
|
|
III.Debts with associated and affiliated
companies |
|
|
|
|
With affiliated companies |
|
|
|
|
Associated companies |
|
|
|
|
IV. Other creditors |
|
|
|
|
Bills payable |
|
|
|
|
Other debts |
|
|
|
|
Long term deposit and guaranties |
|
|
|
|
Taxes receivable |
|
|
|
|
V. Deferred debts on shares |
|
|
|
|
From affiliated companies |
|
|
|
|
From associated companies |
|
|
|
|
Other companies |
|
|
|
|
VI. Long term debt with creditor |
|
|
|
|
E) SHORT TERM LIABILITIES |
3.196,00 |
4.546,00 |
6.446,00 |
|
I.Negotiable bonds and other negotiable values |
|
|
|
|
Non convertible securities |
|
|
|
|
Convertible securities |
|
|
|
|
Other convertible debentures |
|
|
|
|
Interests from bonds |
|
|
|
|
II.Debt with bank entities |
422,00 |
390,00 |
861,00 |
|
Loans and other debts |
337,00 |
381,00 |
861,00 |
|
Debt interest |
|
|
|
|
Leasing |
85,00 |
9,00 |
|
|
III. Short term debts with associated and
affiliated companies |
|
|
|
|
With affiliated companies |
|
|
|
|
Associated companies |
|
|
|
|
IV. Commercial creditors |
2.539,00 |
3.776,00 |
5.074,00 |
|
Accounts payable |
1.083,00 |
1.385,00 |
2.248,00 |
|
Expenses |
1.456,00 |
2.391,00 |
2.825,00 |
|
Bills payable |
|
|
1,00 |
|
V. Other non-commercial debt |
240,00 |
385,00 |
511,00 |
|
Government |
189,00 |
322,00 |
422,00 |
|
Bills payable |
|
|
|
|
Other debts |
2,00 |
|
|
|
Accounts receivable |
49,00 |
63,00 |
89,00 |
|
Short term deposits and guarantees |
|
|
|
|
VI. Provisions for current assets |
-5,00 |
-5,00 |
|
|
VII. Periodification adjustments |
|
|
|
|
F) SHORT TERM PROVISIONS FOR LIABILITIES AND
EXPENSES |
|
|
|
|
LIABILITIES (A + B + C + D + E + F) |
4.860,00 |
6.768,00 |
9.862,00 |
Liabilities
Composition
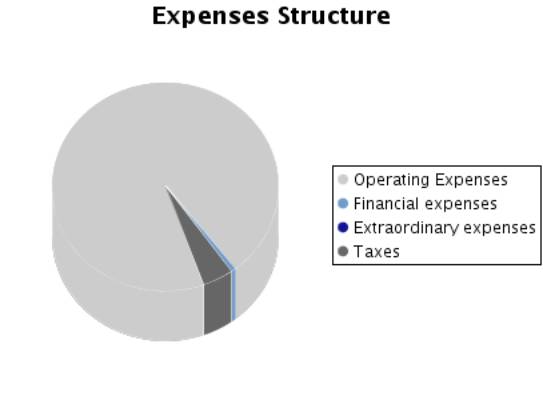
PROFIT AND LOSS ACCOUNT
Itams of the Profit and Loss Account
Figures given in thousands €
|
|
31/12/2004 (12) |
31/12/2005 (12) |
31/12/2006 (12) |
|
A) EXPENSES (A.1 a A.16) |
6.890,00 |
9.756,00 |
12.240,00 |
|
A.1.Reduction in stocks of finished goods and
work in progress |
|
8,00 |
|
|
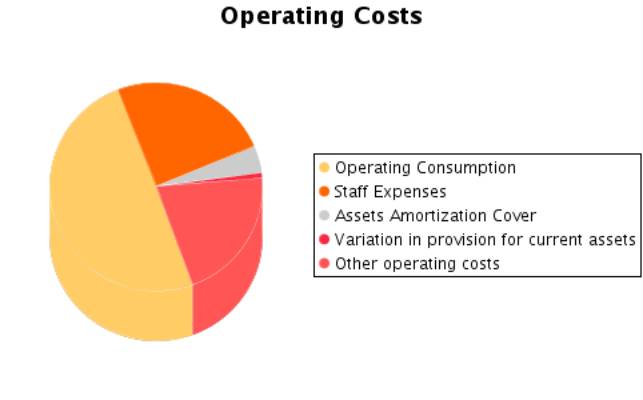
A.2.Supplies |
3.315,00 |
4.977,00 |
5.948,00 |
|
Material consumed |
|
|
|
|
Raw materials consumed |
3.247,00 |
4.912,00 |
5.853,00 |
|
Other expenses |
68,00 |
65,00 |
95,00 |
|
A.3. Labour cost |
2.062,00 |
2.362,00 |
2.773,00 |
|
Wages |
1.706,00 |
1.935,00 |
2.217,00 |
|
Social security expenses |
356,00 |
427,00 |
556,00 |
|
A.4. Assets depreciation |
104,00 |
122,00 |
474,00 |
|
A.5.Variance in the traffic provisions |
9,00 |
25,00 |
98,00 |
|
Variance in provision for inventory |
|
|
75,00 |
|
Variance in provision for bad debts |
9,00 |
25,00 |
23,00 |
|
Variance in provision for other current assets |
|
|
|
|
A.6. Other operating costs |
1.214,00 |
1.889,00 |
2.340,00 |
|
External costs |
1.210,00 |
1.873,00 |
2.331,00 |
|
Taxes |
3,00 |
15,00 |
9,00 |
|
Other day to day expenses |
1,00 |
1,00 |
|
|
Allowance to reversion fund |
|
|
|
|
A.I.OPERATING RESULT
(B.1+B.2+B.3+B.4-A.1-A.2-A.3-A.4-A.5-A.6) |
464,00 |
1.496,00 |
2.023,00 |
|
A.7.Financial expenses and similar |
31,00 |
24,00 |
22,00 |
|
Debts with related companies |
|
|
|
|
Debts with associated companies |
|
|
|
|
Other companies debts By debts with third parties and similar expenses |
31,00 |
24,00 |
22,00 |
|
Losses from financial investments |
|
|
|
|
A.8. Variation in financial investment provision |
|
|
|
|
A.9.Negative exchange difference |
5,00 |
5,00 |
65,00 |
|
A.II.POSITIVE FINANCIAL RESULTS
(B.5+B.6+B.7+B.8-A.7-A.8-A.9) |
|
|
|
|
A.III.PROFIT FROM ORDINARY ACTIVITIES
(A.I+A.II-B.I-B.II) |
432,00 |
1.477,00 |
2.006,00 |
|
A.10. Variation in provision in fixed assets |
|
|
|
|
A.11. Losses in
fixed assets |
|
17,00 |
|
|
A.12. Losses
from own shares and bonds |
|
|
|
|
A.13.
Extraordinary charges |
|
|
2,00 |
|
A.14.Other
exercises’ expenses and losses |
60,00 |
|
|
|
A.IV.POSITIVE
EXTRAORDINARY RESULT (B.9+B.10+B.11+B.12+B.13-A.10-A.11-A.12-A.13-A.14) |
|
|
32,00 |
|
A.V.PROFIT
BEFORE TAXES (A.III+A.IV-B.III-B.IV) |
372,00 |
1.460,00 |
2.038,00 |
|
A.15.Corporate
Taxes |
90,00 |
327,00 |
518,00 |
|
A.16. Other
taxes |
|
|
|
|
A.VI.EXERCISE
RESULT (PROFIT) (A.V-A.14-A.15) |
282,00 |
1.133,00 |
1.520,00 |
|
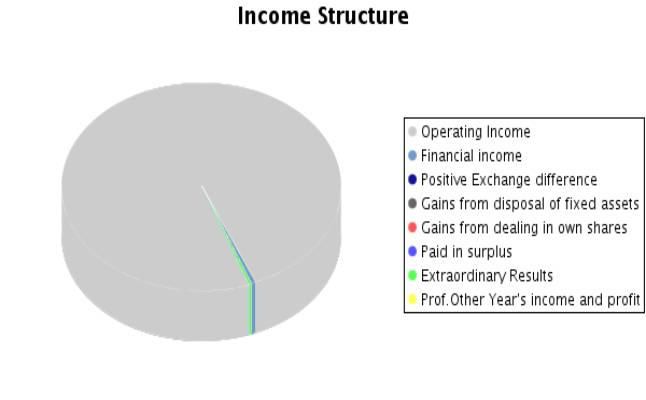
B) INCOMES (B.1 a B13) |
7.172,00 |
10.889,00 |
13.760,00 |
|
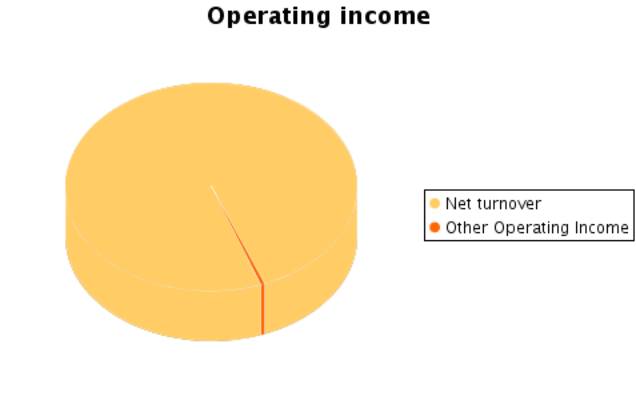
B.1. Turnover |
6.886,00 |
10.857,00 |
13.272,00 |
|
Sales |
6.663,00 |
10.550,00 |
13.023,00 |
|
Services provided |
223,00 |
307,00 |
249,00 |
|
Refunds and sale reminders |
|
|
|
|
B.2.Increase in inventory of finished goods and
works in progress |
257,00 |
|
336,00 |
|
B.3.Expenses capitalized |
|
|
|
|
B.4. Other operating income |
25,00 |
22,00 |
48,00 |
|
Other incomes |
14,00 |
1,00 |
1,00 |
|
Grants |
10,00 |
21,00 |
47,00 |
|
Excess in provision for liabilities and charges |
1,00 |
|
|
|
B.I.OPERATING
LOSSES (A.1+A.2+A.3+A.4+A.5+A.6-B.1-B.2-B.3-B.4) |
|
|
|
|
B.5.Incomes from share participations |
|
|
|
|
From affiliated companies |
|
|
|
|
From associated companies |
|
|
|
|
From other companies |
|
|
|
|
B.6.Income from other securities and credits to
fixed assets |
|
|
5,00 |
|
From affiliated companies |
|
|
|
|
From associated companies |
|
|
|
|
Other companies |
|
|
5,00 |
|
B.7.Other interests and similar |
2,00 |
7,00 |
60,00 |
|
From affiliated companies |
|
|
|
|
From associated companies |
|
|
4,00 |
|
Other Interests |
2,00 |
7,00 |
50,00 |
|
Profits from investments |
|
|
6,00 |
|
B.8. Positive change difference |
2,00 |
3,00 |
5,00 |
|
B.II. NEGATIVE FINANCIAL RESULTS
(A.7+A.8+A.9-B.5-B.6-B.7-B.8) |
32,00 |
19,00 |
17,00 |
|
B.III.LOSSES FROM ORDINARY ACTIVITIES
(B.I+B.II-A.I-A.II) |
|
|
|
|
B.9.B.9. Gains from disposal of fixed assets |
|
|
|
|
B.10.Gains from dealing in own shares |
|
|
|
|
B.11. Paid in surplus |
|
|
|
|
B.12. Extraordinary income |
|
|
34,00 |
|
B.13.Other year’s income and profits |
|
|
|
|
B.IV.NEGATIVE EXTRAORDINARY LOSSES
(A.10+A.11+A.12+A.13+A.14-B.9-B.10-B.11-B.12-B.13) |
60,00 |
17,00 |
|
|
B.V.LOSS BEFORE TAXES (B.III+B.IV-A.III-A.IV) |
|
|
|
|
B.VI.EXERCISE RESULTS (LOSS) (B.V+A.14+A.15) |
|
|
|
Composition of the
Profit and Loss Account
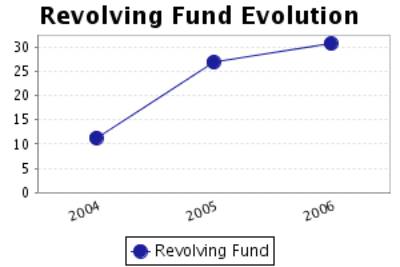
FINANCIAL BALANCE
Here the Main Capital Amounts of the company and the Revolving Fund
Evolution are analysed.
Financial Balance Table
Figures given in thousands €
|
|
31/12/2004 (12) |
% |
31/12/2005 (12) |
% |
31/12/2006 (12) |
% |
|
A) DUE FROM
SHAREHOLDERS FOR UNCALLED CAPITAL |
|
|
|
|
|
|
|
B) FIXED ASSETS |
1.013,00 |
20,84 |
398,00 |
5,88 |
377,00 |
3,82 |
|
C) DEFERRED
EXPENSES |
103,00 |
2,12 |
|
|
|
|
|
D) CURRENT
ASSETS |
3.744,00 |
77,04 |
6.370,00 |
94,12 |
9.485,00 |
96,18 |
|
ASSETS (A + B +
C + D) |
4.860,00 |
|
6.768,00 |
|
9.862,00 |
|
|
|
||||||
|
A) SHAREHOLDERS
EQUITY |
972,00 |
20,00 |
2.104,00 |
31,09 |
3.264,00 |
33,10 |
|
B) DEFERRED INCOME |
|
|
|
|
|
|
|
C) PROVISIONS FOR LIABILITIES AND EXPENSES |
|
|
106,00 |
1,57 |
152,00 |
1,54 |
|
D) LONG TERM LIABILITIES |
692,00 |
14,24 |
12,00 |
0,18 |
|
|
|
E) SHORT TERM LIABILITIES |
3.196,00 |
65,76 |
4.546,00 |
67,17 |
6.446,00 |
65,36 |
|
F) SHORT TERM PROVISIONS FOR LIABILITIES AND EXPENSES |
|
|
|
|
|
|
|
LIABILITIES (A + B + C + D + E + F) |
4.860,00 |
|
6.768,00 |
|
9.862,00 |
|
Financial Balance Composition
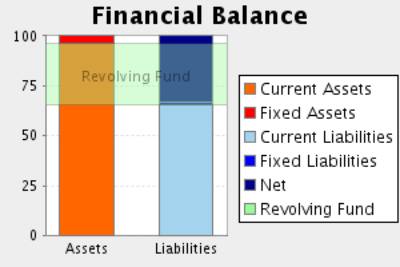
Comments on Financial Balance
In the 2004, the assets of the company were formed in 22,96% of Fixed
Assets and in 77,04% of Current Assets.This assets were financed in 20,00% with
own capitals, and in 14,24% with long term debt and in 65,76% with current
liabilities.
The result of this financial structure is a positive turnover fund of
548,00 Euros, which is equivalent to 11,28% proportion of the company’s
total assets.
In the 2005, the assets of the company were formed in 5,88% of Fixed Assets
and in 94,12% of Current Assets.This assets were financed in 31,09% with own
capitals, and in 1,74% with long term debt and in 67,17% with current
liabilities.
The result of this financial structure is a positive turnover fund of
1.824,00 Euros, which is equivalent to 26,95% proportion of the company’s
total assets.
This measure has increased with respect to the previous exercise in
232,85% having also increased its proportion with respect to the total assets
of the company.
In the 2006, the assets of the company were formed in 3,82% of Fixed
Assets and in 96,18% of Current Assets.This assets were financed in 33,10% with
own capitals, and in 1,54% with long term debt and in 65,36% with current
liabilities.
The result of this financial structure is a positive turnover fund of
3.039,00 Euros, which is equivalent to 30,82% proportion of the company’s
total assets.
This measure has increased with respect to the previous exercise in
66,61% having also increased its proportion with respect to the total assets of
the company
RATIOS
Main Ratios
|
|
31/12/2004 (12) |
31/12/2005 (12) |
31/12/2006 (12) |
|
STRUCTURAL RATIOS |
|
|
|
|
Management fund |
548,00 |
1.824,00 |
3.039,00 |
|
Management Fund Requirement |
-300,00 |
-599,00 |
-1.473,00 |
|
Indebtedness (%) |
80,00 |
68,91 |
66,90 |
|
External Funds on Net Worth |
4,00 |
2,22 |
2,02 |
|
GENERAL ACTIVITY RATIO |
|
|
|
|
Turnover Increase (%) |
7,80 |
57,67 |
22,24 |
|
Added value growth (%) |
37,23 |
51,76 |
34,03 |
|
Cash Flow |
395,00 |
1.280,00 |
2.092,00 |
|
Labour Productivity |
1,28 |
1,70 |
1,94 |
|
Assets turnover |
1,42 |
1,60 |
1,35 |
|
Breakdown Point |
6.078,74 |
8.117,72 |
9.824,10 |
|
Security Margin of the Breakdown Point (%) |
12,04 |
25,38 |
26,24 |
|
ACTIVITY RATIOS |
|
|
|
|
Average Payment Period |
299 |
273 |
325 |
|
Average Collection Period |
50 |
53 |
41 |
|
Inventory Turnover Period |
79 |
64 |
70 |
|
SOLVENCY RATIOS |
|
|
|
|
Payback Capacity |
0,10 |
0,27 |
0,32 |
|
Assets Guarantee |
1,22 |
1,45 |
1,50 |
|
Short Term Debts Proportion (%) |
82,20 |
97,47 |
97,70 |
|
Interest Coverage |
4,32 |
52,92 |
75,09 |
|
LIQUIDITY RATIOS |
|
|
|
|
Current Ratio |
1,17 |
1,40 |
1,47 |
|
Immediate liquidity |
0,40 |
0,62 |
0,83 |
|
Treasury |
848,00 |
2.423,00 |
4.512,00 |
|
Sales on Current Assets |
662 |
614 |
504 |
Results Analysis
Ratios
|
|
31/12/2004 (12) |
31/12/2005 (12) |
31/12/2006 (12) |
|
Economic profitability (%) |
9,55 |
22,10 |
20,51 |
|
Operating Profitability (%) |
6,74 |
13,78 |
15,24 |
|
Equity gearing |
4,66 |
3,18 |
3,00 |
|
Financial profitability (%) |
29,01 |
53,85 |
46,57 |
|
General Profitability (%) |
4,10 |
10,44 |
11,45 |
Comments on the
Results Analysis Ratios
The economic profitability in the year2005 achieved a 22,10% positive
level, due to a 13,78% economic margin and to an assets turnover of1,60%.
The economic profitability in the year has increased from 9,55% up to
22,10%. This growth is due to the economic margin increase, from 6,74% to the
current 13,78Y%, and to the assets turnover index, which in the last period has
achieved 1,60, compared to 1,42 del 2004.
Financial profitability on 2005 achieved a 53,85%.
The company’s financial structure has instigated its economic
profitability with an indebtedness level of 3,18.
The general profitability on 2005 achieved a 10,44%.
The economic profitability in the year2006 achieved a 20,51% positive
level, due to a 15,24% economic margin and to an assets turnover of1,35%.
The economic profitability in the year has reduced from 22,10% up to
20,51% of2006, even if it remains positive. The decrease in assets turnover
from 1,60% to the current level of 1,35has provoked this drop, which has not
been compensated by the parallel increase of the economic margin from 15,24% to
13,78%.
Financial profitability on 2006 achieved a 46,57%.
The company’s financial structure has instigated its economic
profitability with an indebtedness level of 3,00.
The general profitability on 2006 achieved a 11,45%.
SECTORIAL ANÁLYSIS
Large Capital Amounts and Financial Balance
Figures given in %
|
|
COMPANY (2006) |
SECTOR |
DIFFERENCE |
DIFFERENCE RELATIVE |
|
|
|
|
|
|
ASSETS |
|
|
|
|
|
|
|
|
|
|
A) DUE FROM
SHAREHOLDERS FOR UNCALLED CAPITAL |
|
0,00 |
|
|
|
|
|
|
|
|
B) FIXED ASSETS |
3,82 |
28,51 |
-24,69 |
-86,60 |
|
|
|
|
|
|
C) DEFERRED
EXPENSES |
|
0,28 |
|
|
|
|
|
|
|
|
D) CURRENT
ASSETS |
96,18 |
71,21 |
24,97 |
35,06 |
|
|
|
|
|
|
ASSETS (A + B + C + D) |
100 |
100 |
|
|
|
|
|
|
|
|
|
|
|
|
|
|
|
|
|
|
|
|
COMPANY (2006) |
SECTOR |
DIFFERENCE |
DIFFERENCE RELATIVE |
|
|
|
|
|
|
LIABILITIES |
|
|
|
|
|
|
|
|
|
|
A) SHAREHOLDERS
EQUITY |
33,10 |
39,13 |
-6,03 |
-15,40 |
|
|
|
|
|
|
B) DEFERRED
INCOME |
|
0,73 |
|
|
|
|
|
|
|
|
C) PROVISIONS
FOR LIABILITIES AND EXPENSES |
1,54 |
0,44 |
1,10 |
252,40 |
|
|
|
|
|
|
D) LONG TERM
LIABILITIES |
|
9,19 |
|
|
|
|
|
|
|
|
E) SHORT TERM
LIABILITIES |
65,36 |
50,51 |
14,85 |
29,39 |
|
|
|
|
|
|
F) SHORT TERM
PROVISIONS FOR LIABILITIES AND EXPENSES |
|
0,00 |
|
|
|
|
|
|
|
|
LIABILITIES (A +
B + C + D + E + F) |
100 |
100 |
|
|
|
|
|
|
|
Sectorial Financial
Balance Comparison
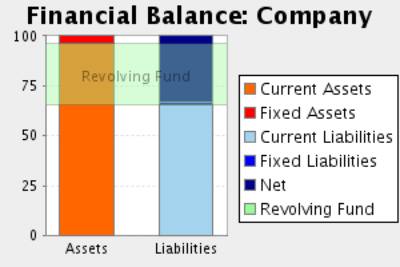
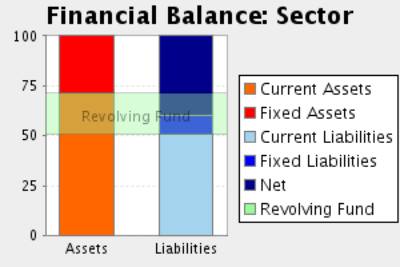
Comments to the Sectorial Analysis
In the 2006, the assets of the company were formed in 3,82% of fixed
assets and in 96,18Current Assets % In the sector, the proportion of fixed
assets was of 28,79%, 86,73% superior, and the proportion of current assets was
of 71,21%, 35,06% inferior.
The assets were financed in the company in 33,10% with own capitals , in
1,54% with fixed liabilities and in 65,36% with current liabilities In the
sector, the self financing represented 39,85%, 16,94% superior. On the other
hand the long term debts represented in the sector an average of 9,63%
financing, with a relative difference of 84,01% favourable to the sectorAnd,
short term liabilities represented in the sector an average of 50,52% financing,
with a relative difference of 29,38% in favour of the company
The result of this company’s financial structure is a turnover fund that
represents 30,82% of the total assets; in the sector, this same proportion is
20,69%, therefore, we can say that the company’s turnover fund is 48,94% higher
than the one in of the sector.
Analytical Account of Results
Figures given in %
|
|
COMPANY (2006) |
SECTOR |
DIFFERENCE |
DIFFERENCE RELATIVE |
|
Turnover |
99,64 |
97,67 |
1,97 |
2,02 |
|
Other operating income |
0,36 |
2,33 |
-1,97 |
-84,54 |
|
Production Value |
100,00 |
100,00 |
0,00 |
0,00 |
|
Operating expenses |
42,13 |
59,07 |
-16,94 |
-28,67 |
|
Other operation expenses |
17,57 |
10,94 |
6,62 |
60,53 |
|
Added value |
40,30 |
29,99 |
10,31 |
34,38 |
|
Labour cost |
20,82 |
19,55 |
1,27 |
6,48 |
|
Gross Economic Result |
19,48 |
10,44 |
9,04 |
86,66 |
|
Assets depreciation |
3,56 |
2,27 |
1,29 |
56,69 |
|
Variation in provision for current assets and bad debt losses |
0,74 |
0,46 |
0,28 |
61,57 |
|
Net Economic Result |
15,19 |
7,71 |
7,48 |
97,09 |
|
Financial income |
0,53 |
0,51 |
0,02 |
3,31 |
|
Financial Charges |
0,65 |
1,03 |
-0,38 |
-36,95 |
|
Variation in financial investment provision |
|
0,00 |
|
|
|
Ordinary Activities Result |
15,06 |
7,19 |
7,87 |
109,34 |
|
Extraordinary income |
0,26 |
0,48 |
-0,21 |
-45,26 |
|
Extraordinary charges |
0,02 |
0,36 |
-0,34 |
-94,49 |
|
Variation in provision in fixed assets |
|
-0,02 |
|
|
|
Results before Taxes |
15,30 |
7,32 |
7,98 |
108,87 |
|
Corporate taxes |
3,89 |
2,25 |
1,64 |
72,74 |
|
Net Result |
11,41 |
5,07 |
6,34 |
124,92 |
|
Assets depreciation |
3,56 |
2,27 |
1,29 |
56,69 |
|
Change of Provisions |
0,74 |
0,44 |
0,30 |
70,11 |
|
Net Self-Financing |
15,71 |
7,78 |
7,93 |
101,95 |
Main Ratios
|
|
COMPANY (2006) |
PTILE25 |
PTILE50 |
PTILE75 |
|
STRUCTURAL RATIOS |
|
|
|
|
|
Management fund |
3.039,00 |
696,62 |
1.843,56 |
4.900,60 |
|
Management Fund Requirement |
-1.473,00 |
-2.054,80 |
235,25 |
1.569,89 |
|
Indebtedness (%) |
66,90 |
43,46 |
59,15 |
76,10 |
|
External Funds on Net Worth |
2,02 |
0,77 |
1,45 |
3,19 |
|
GENERAL ACTIVITY RATIO |
|
|
|
|
|
Turnover Increase (%) |
22,24 |
2,23 |
11,89 |
20,84 |
|
Added value growth (%) |
34,03 |
-2,24 |
7,28 |
16,74 |
|
Cash Flow |
2.092,00 |
518,21 |
1.033,20 |
1.651,58 |
|
Labour Productivity |
1,94 |
1,29 |
1,49 |
1,87 |
|
Assets turnover |
1,35 |
1,02 |
1,27 |
1,68 |
|
Breakdown Point |
9.824,10 |
7.258.015,28 |
11.922.068,67 |
18.386.908,62 |
|
Security Margin of the Breakdown Point (%) |
26,24 |
9,88 |
17,04 |
24,69 |
|
ACTIVITY RATIOS |
|
|
|
|
|
Average Payment Period |
325 |
85 |
127 |
169 |
|
Average Collection Period |
41 |
92 |
108 |
152 |
|
Inventory Turnover Period |
70 |
22 |
42 |
62 |
|
SOLVENCY RATIOS |
|
|
|
|
|
Payback Capacity |
0,32 |
0,07 |
0,16 |
0,31 |
|
Assets Guarantee |
1,50 |
1,29 |
1,68 |
2,29 |
|
Short Term Debts Proportion (%) |
97,70 |
78,86 |
93,13 |
99,98 |
|
Interest Coverage |
75,09 |
3,26 |
11,36 |
36,54 |
|
LIQUIDITY RATIOS |
|
|
|
|
|
Current Ratio |
1,47 |
1,08 |
1,38 |
2,00 |
|
Immediate liquidity |
0,83 |
0,05 |
0,14 |
0,47 |
|
Treasury |
4.512,00 |
-1.194,95 |
56,65 |
1.209,72 |
|
Sales on Current Assets |
504 |
487 |
659 |
834 |
Results Analysis
Ratios
|
|
COMPANY (2006) |
PTILE25 |
PTILE50 |
PTILE75 |
|
Economic profitability (%) |
20,51 |
4,19 |
8,34 |
15,61 |
|
Operating Profitability (%) |
15,24 |
3,30 |
7,26 |
11,34 |
|
Equity gearing |
3,00 |
1,68 |
2,30 |
3,28 |
|
Financial profitability (%) |
46,57 |
7,71 |
15,41 |
24,97 |
|
General Profitability (%) |
11,45 |
2,22 |
4,88 |
7,23 |
NOTES
ABOUT YOUR REQUEST:
The data of your request are correct.
Here is our final report. Even though this company is obliged to
file their balance sheets in the Mercantile Register, no official
balance sheets are available for 2007 .
FOREIGN EXCHANGE
RATES
|
Currency |
Unit
|
Indian Rupees |
|
US Dollar |
1 |
Rs.44.21 |
|
UK Pound |
1 |
Rs.79.76 |
|
Euro |
1 |
Rs.64.72 |
RATING
EXPLANATIONS
|
RATING |
STATUS |
PROPOSED CREDIT LINE |
|
|
>86 |
Aaa |
Possesses an extremely sound financial base with the strongest
capability for timely payment of interest and principal sums |
Unlimited |
|
71-85 |
Aa |
Possesses adequate working capital. No caution needed for credit
transaction. It has above average (strong) capability for payment of interest
and principal sums |
Large |
|
56-70 |
A |
Financial & operational base are regarded healthy. General
unfavourable factors will not cause fatal effect. Satisfactory capability for
payment of interest and principal sums |
Fairly Large |
|
41-55 |
Ba |
Overall operation is considered normal. Capable to meet normal
commitments. |
Satisfactory |
|
26-40 |
B |
Unfavourable & favourable factors carry similar weight in credit
consideration. Capability to overcome financial difficulties seems comparatively
below average. |
Small |
|
11-25 |
Ca |
Adverse factors are apparent. Repayment of interest and principal sums
in default or expected to be in default upon maturity |
Limited with
full security |
|
<10 |
C |
Absolute credit risk exists. Caution needed to be exercised |
Credit not
recommended |
|
NR |
In view of the lack of information, we have no basis upon which to
recommend credit dealings |
No Rating |
|
This score serves as a reference to assess SC’s credit risk
and to set the amount of credit to be extended. It is calculated from a
composite of weighted scores obtained from each of the major sections of this
report. The assessed factors and their relative weights (as indicated through
%) are as follows:
Financial
condition (40%) Ownership
background (20%) Payment
record (10%)
Credit history
(10%) Market trend
(10%) Operational
size (10%)