![]()
MIRA
INFORM REPORT
|
Report Date : |
11.09.2008 |
IDENTIFICATION
DETAILS
|
Name : |
IMPEX QUIMICA SA |
|
|
|
|
Registered Office : |
Period Pau,
S/N (Wtc Almeda Park Ed 8 1 Plt), Cp 08940, Cornella De
Llobregat Barcelona |
|
|
|
|
Country : |
Spain |
|
|
|
|
Financials (as on) : |
31.12.2007 |
|
|
|
|
Date of Incorporation : |
|
|
|
|
|
Legal Form : |
Joint Stock Company |
|
|
|
|
Line of Business : |
RATING &
COMMENTS
|
MIRA’s Rating : |
A |
|
RATING |
STATUS |
PROPOSED CREDIT LINE |
|
|
56-70 |
A |
Financial & operational base are regarded healthy. General
unfavourable factors will not cause fatal effect. Satisfactory capability for
payment of interest and principal sums |
Fairly Large |
|
Maximum Credit Limit : |
1.492.914,07 € |
|
|
|
|
Status : |
Good |
|
|
|
|
Payment Behaviour : |
Regular |
|
|
|
|
Litigation : |
Clear |
FINANCIAL REPORT
IMPEX QUIMICA SA
TAX NUMBER: A61744033
EXECUTIVE SUMMARY
Identification
Current Business Name: IMPEX QUIMICA SA
Other names: NO
Current Address: PERIOD PAU,
S/N (WTC ALMEDA PARK ED 8 1 PLT), CP 08940, CORNELLA DE
LLOBREGAT BARCELONA
Branches: 1
Telephone number: 934099070 Fax: 933392162
URL: www.impexquimica.com Corporate e-mail:
impexquimica@impexquimica.com
Commercial Risk
Credit Appraisal:
1.492.914,07 €
RAI: NO
Legal Actions: NO
Financial Information
Latest Balance sheet sales (2007): 100.869.971,00 € (MERCANTILE REGISTER)
Result: 932.026 €
Total Assets: 44.026.191 €
Social Capital: 601.000,00 €
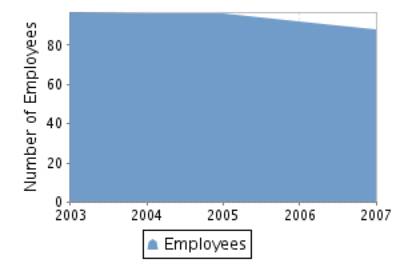
Employees: 97
Commercial Information
Constitution Date: 31/07/1998
Business activity: Wholesale of
industrial chemical products
NACE Code: 5155
International Operations: Imports and
Exports
Corporate Structure
President:
Parent Company:
Other Complementary Information
Latest proceeding published in BORME: 25/08/2008 Registration
of accounts
Latest press article: 21/12/2007 GACETA
NEG (INFORMATION ON LEGAL ANNOUNCE)
Bank Entities: Yes
Credit Appraisal
Maximum Credit
(from 0 a 6,000,000 €)
Favourable to 1.492.914,07 €
Rating Evolution
Financial Situation
Fiscal year2007
|
Treasury |
Excellent |
|
Indebtedness |
Average |
|
Profitability |
Null |
|
Balance |
Excellent |
Performance
|
Legal Actions |
None or Negligible |
|
Business Trajectory |
Excellent |
RAI 
COMPANY NOT REGISTERED IN THE R.A.I.
This company is not registered in the Disputed Bills register (R.A.I.)
DATE AND TIME OF THE CONSULTATION: 01/09/2008
08:09:25
INCIDENTS

Summary
LEGAL ACTIONS: No legal
incidences registered
CLAIM FILED AGAINST THE ADMINISTRATION: No administrative
claims registered.
AFFECTED BY: No significant
element.
FINANCIAL ELEMENTS AND SECTORIAL
COMPARATIVE
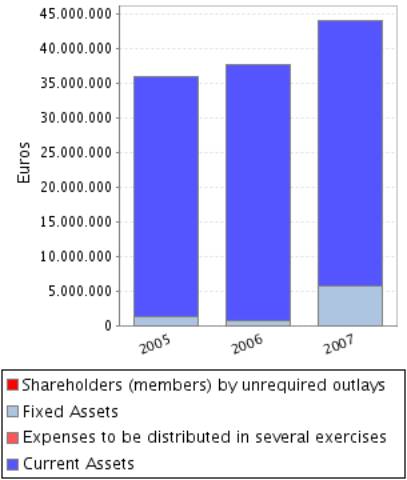
FINANCIAL ELEMENTS
Figures given in €
|
|
2005 (12) |
2006 (12) |
2007 (12) |
% ASSETS |
|
|
|
|
|
|
BALANCE SHEET
ANALYSIS |
|
|
|
|
|
|
|
|
|
|
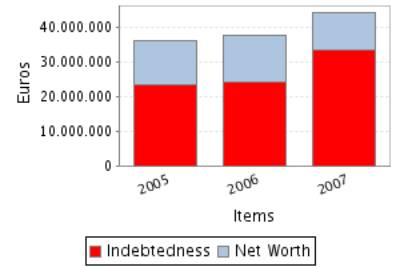
OWN FUNDS |
12.551.388,00 |
13.463.061,00 |
10.595.087,00 |
24,07 |
|
|
|
|
|
|
DEBT |
23.428.258,00 |
24.117.526,00 |
33.431.104,00 |
75,93 |
|
|
|
|
|
|
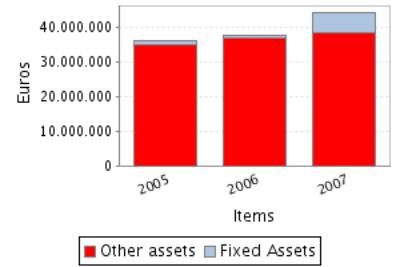
FIXED ASSETS |
1.201.753,00 |
740.573,00 |
5.728.792,00 |
13,01 |
|
|
|
|
|
|
TOTAL ASSETS |
35.979.646,00 |
37.580.587,00 |
44.026.191,00 |
|
|
|
|
|
|
|
|
|
|
|
|
|
|
|
|
|
|
|
2005 (12) |
2006 (12) |
2007 (12) |
% SALES |
|
|
|
|
|
|
PROFIT AND LOSS
ACCOUNT ANALYSIS |
|
|
|
|
|
|
|
|
|
|
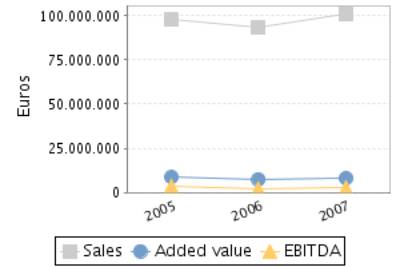
SALES |
97.727.297,00 |
93.068.892,00 |
100.869.971,00 |
|
|
|
|
|
|
|
ADDED VALUE |
8.451.271,00 |
7.401.683,00 |
8.136.099,00 |
8,07 |
|
|
|
|
|
|
EBITDA |
3.211.282,00 |
2.167.852,00 |
2.388.152,00 |
2,37 |
|
|
|
|
|
|
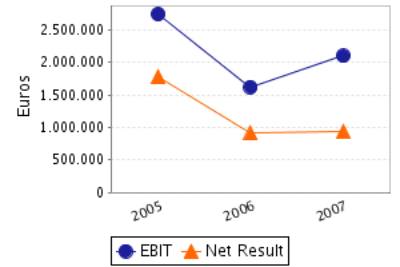
EBIT |
2.742.710,00 |
1.622.510,00 |
2.099.968,00 |
2,08 |
|
|
|
|
|
|
NET RESULT |
1.779.036,00 |
911.673,00 |
932.026,00 |
0,92 |
|
|
|
|
|
Balance Sheets Items
Analysis
Balance Sheet Comments
Total assets of the company grew 4,45% between 2005 and 2006.
In spite of the assets’ growth, the fixed assets decreased 38,38%.
This growth has been financed, on a wider scale, with a Shareholders’
equity increase of 7,26% and in a smaller proportion with an debt increase of
2,94%.
Total assets of the company grew 17,15% between 2006 and 2007.
This growth is a consequence of the fixed assets increase of 673,56%.
This growth has been financed with an indebtedness increase of
38,62%.Moreover, net worth has been reduced in 21,30%, which explains a part of
the indebtedness increase. .
Profit and Loss Account Analysis
Profit and Loss Account Comments
The company’s sales figure decreased in 4,77% between 2005 and 2006.
The company’s EBIT decreased in 40,84% between 2005 and 2006.
This evolution implies a reduction in the company’s operating
profitability.
The result of these variations is a decrease of the company’s Economic
Profitability of 43,36% in the analysed period, being this profitability of
4,32% in the year 2006.
The company’s Net Result decreased in 48,75% between 2005 and 2006.
This evolution, compared to the EBIT’s performance, implies that the
financial and extraordinary activities have had a negative effect in the
company’s Financial Profitability.
The result of these variations is a reduction of the company’s
profitability of 52,22% in the analysed period, being equal to 6,77% in the
year 2006.
The company’s sales figure grew 8,38% between 2006 and 2007.
The company’s EBIT grew 29,43% between 2006 and 2007.
This evolution implies an increase in the company’s operating
profitability.
The result of these variations is an increase of the company’s Economic
Profitability of 10,48% in the analysed period, being this profitability of
4,77% in the year 2007.
The company’s Net Result grew 2,23% between 2006 and 2007.
This evolution, compared to the EBIT’s performance, implies that the
financial and extraordinary activities have had a negative effect in the
company’s Financial Profitability.
The result of these variations is an increase of the company’s Economic
Profitability of 29,91% in the analysed period, being equal to 8,80% in the
year 2007.
ANNUAL FINANCIAL REPORT ADDITIONAL DATA
Source: annual financial report 2007
Results Distribution
Figures given in €
|
DISTRIBUTION
BASE |
DISTRIBUTION TO |
||
|
Profit and Loss |
932.026,00 |
Retained earnings |
0,00 |
|
Carry Over |
0,00 |
Voluntary Reserve |
932.026,00 |
|
Voluntary reserves |
0,00 |
Prior years losses |
0,00 |
|
Reserves |
0,00 |
Carry Over |
0,00 |
|
Other concepts |
0,00 |
Other funds |
0,00 |
|
Total of Amounts to be distributed |
932.026,00 |
Dividends |
0,00 |
|
|
|
Other Applications |
0,00 |
Auditing
Auditors’ opinion: FAVOURABLE
Auditor: KPMG AUDITORES S.L.
COMPARATIVE SECTOR ANALYSIS
Values table
Figures expressed in %
|
|
COMPANY (2007) |
SECTOR |
DIFFERENCE |
DIFFERENCE RELATIVE |
|
|
|
|
|
|
BALANCE SHEET
ANALYSIS: % on the total assets |
|
|
|
|
|
|
|
|
|
|
OWN FUNDS |
24,07 |
40,28 |
-16,21 |
-40,25 |
|
|
|
|
|
|
DEBT |
75,93 |
59,72 |
16,21 |
27,14 |
|
|
|
|
|
|
FIXED ASSETS |
13,01 |
39,26 |
-26,24 |
-66,85 |
|
|
|
|
|
|
|
|
|
|
|
|
|
|
|
|
|
|
COMPANY (2007) |
SECTOR |
DIFFERENCE |
DIFFERENCE RELATIVE |
|
|
|
|
|
|
PROFIT AND LOSS
ACCOUNT ANALYSIS: % on the total operating income |
|
|
|
|
|
|
|
|
|
|
SALES |
99,72 |
99,44 |
0,28 |
0,28 |
|
|
|
|
|
|
ADDED VALUE |
8,04 |
5,38 |
2,66 |
49,37 |
|
|
|
|
|
|
EBIT |
2,08 |
2,14 |
-0,06 |
-2,99 |
|
|
|
|
|
|
NET RESULT |
0,92 |
1,76 |
-0,83 |
-47,53 |
|
|
|
|
|
Sector Composition
Compared sector (NACE): 515
Number of companies: 166
Size (Sales Figure) : > 40.000.000,00
Euros
Comments on the sectorial comparative
Compared to its sector the assets of the companies show an inferior
proportion of fixed assets. Specifically the difference with the sector average
is -26,24% , which means a relative difference of -66,85% .
In liabilities composition the company appeals on a wider scale to self
financing, being the proportion of net worth of 16,21% inferior, which means a
relative difference of 40,25% 16,21% more than the sector, which means a
difference of 27,14% .
The proportion that the sales mean to the company’s total ordinary
income is 99,72%, 0,28% higher than in the sector, which means a relative
difference of 0,28% .
The company’s EBIT was positive and was 2,08% with regard to the total
ordinary income, 0,06% less than the sector, which means a relative difference
of 2,99% .
The company’s capacity to generate operating income is equal to that of
the sector as its ratio EBIT/Sales is also equal.
The company’s net result was positive and equal to 0,92% with regard to
the total ordinary income, 0,83% less than the sector, which means a relative
difference of 47,53% .
The financial and extraordinary results and the tax impact have had a
negative impact on the Net result in the company with a worse behaviour than in
the sector; as a consequence, the company shows a worse Net Result/EBIT ratio
(REBEmpresa vs. REBSector).
ADDRESSES
Current Legal Seat Address:
PERIOD PAU, S/N (WTC ALMEDA PARK ED 8 1 PLT)
08940 CORNELLA DE LLOBREGAT BARCELONA
Previous Seat Address:
STREET LLUCA, 28
08028
BARCELONA
Characteristics of the current address
Type of premises: office
Area: 2350m
Property: owned; with no official confirmation
Local Situation: main
Branches 
|
STREET |
POSTAL CODE |
TOWN |
PROVINCE |
|
STREET FRANCISCO ABRIL 17 |
28007 |
MADRID |
Madrid |
1 branches registered
CORPORATE STRUCTURE
ADMINISTRATIVE LINKS
Main Board members, Directors and Auditor ![]()
|
POSITION |
SURNAMES AND
NAME |
APPOINTMENT DATE |
|
|
PRESIDENT |
AGUILERA ARMENGOL FRANCISCO |
26/12/2007 |
|
|
CHIEF OFFICER |
JORDS COPPYE |
26/12/2007 |
|
|
CHIEF OFFICER |
HANS UDO WENZEL |
26/12/2007 |
|
|
CHIEF OFFICER |
BARIOS BONCOMPTE ANTONIO |
26/12/2007 |
|
|
SECRETARY |
GILABERT GARCIA MARIA PILAR |
26/12/2007 |
|
|
AUDITOR |
APPOINTMENT DATE |
||
|
KPMG AUDITORES SL |
19/01/2006 |
||
Functional Managers
|
POSITION |
SURNAMES AND
NAME |
|
General Manager |
AGUILERA FRANCISCO |
|
Financial Manager |
VARIOS ANTONIO |
|
Human Resources Manager |
PERIS ANTONIO |
|
Exports Manager |
ONTIBEROS FEDERICO |
FINANCIAL LINKS
|
|
BUSINESS NAME |
CIF / COUNTRY |
% |
SOURCE |
DATA INF. |
|
|
AZELIS IBERICA SL. |
B63548861 |
100,00 |
OWN SOURCES |
29/02/2008 |
CREDIT INFORMATION
Constitution Date: 31/07/1998
Foundation Date: 01/01/1969
Business activity 
Activity: Wholesale of industrial chemical products
NACE Code: 5155
NACE Activity: Wholesale of chemical products
Business: IMPORTACION, EXPORTACION Y COMPRAVENTA DE PRODUCTOS
QUIMICOS PARA LAS INDUSTRIAS FARMACEUTICA, COSMETICA, VETERINARIA, ALIMENTACION
Y QUIMICA EN GENERAL.
Employees 
Number of total employees: 97 (2008)
Number of fixed employees: 100,00%
Number of temporary employees: 0,00%
Employees evolution
COMMERCIAL OPERATIONS 
PURCHASES
Payments (estimated):
Import Percentage: 40%
Imports from: .
National Distribution: 60%
SUPPLIERS
|
BUSINESS NAME |
INTERNATIONAL |
|
SARRAPAMIAS S.A |
NO |
|
APSA |
NO |
|
BIOQUIM S.A |
NO |
3 proveedores
SALES
Collection (estimated):
On a credit basis: 100%
Export Percentage: 30%
Exports to: .
National Distribution: 70%
Banks 
|
ENTITY |
BRANCH |
ADDRESS |
TOWN OR CITY |
PROVINCE |
|
CAJA DE AHORROS
Y PENSIONES DE BARCELONA |
|
|
BARCELONA |
|
1 bank entities registered
LEGAL STRUCTURE
Constitution Data
Register Date: 31/07/1998
Register town: Barcelona
Announcement number: 393029
Current structure data 
Current Legal Form: JOINT STOCK COMPANY
Current Capital: 601.000,00 €
Legal Aspects
Obligation to fill in Financial Statements: YES
Chamber census: YES (2006)
Listed on a Stock Exchange: NO
B.O.R.M.E.(Official Companies
Registry Gazette) 
Registered Proceedings
|
PROCEEDINGS |
DATE |
NOTICE NUM. |
TRADE REG. |
|
Change of address |
19/02/2008 |
88302 |
Barcelona |
|
Resignations |
26/12/2007 |
639320 |
Barcelona |
|
Appointments |
26/12/2007 |
639320 |
Barcelona |
|
Resignations |
10/12/2007 |
611822 |
Barcelona |
Other Proceedings published
|
PROCEEDINGS |
DATE |
NOTICE NUM. |
TRADE REG. |
|
Registration of accounts (2007) Individual |
25/08/2008 |
307089 |
Barcelona |
Press articles

21/12/2007 GACETA NEG (INFORMATION ON LEGAL ANNOUNCE)
ESTA SDAD. HA ACORDADO EL 17/12/07 EL TRASLADO DEL DOMICILIO SOCIAL QUE
SE FIJA EN WTC ALMEDA PARK, PLAZA DE LA PAU, S/N, CORNELLA DEL LLOBREGAT
(BARCELONA).
11/06/2007 EXPANSION DE CATALUNA (GENERAL INFORMATION)
EL GRUPO IMPEX QUIMICA, PERTENECIENTE A GRUPO AZELIS, HA PREALQUILADO
1.385 METROS CUADRADOS DE OFICINAS EN LA SEGUNDA FASE DEL WTC ALMEDA PARK, EN
UNA OPERACION ASESORADA POR JONES LANG LASALLE. LA EMPRESA TRASLADARA SU SEDE A
CORNELLA DESDE EL DISTRITO DE LES CORTS.
FINANCIAL INFORMATION
The information on the last account contained in this report is
extracted from the Mercantile Register file of the legal address of the Company
and dated 22/08/2008.
BALANCE SHEET
Assets
Figures given in €
|
|
31/12/2005 (12) |
31/12/2006 (12) |
31/12/2007 (12) |
|
A) DUE FROM SHAREHOLDERS FOR UNCALLED CAPITAL |
|
|
|
|
B) FIXED ASSETS |
1.201.753,00 |
740.573,00 |
5.728.792,00 |
|
I. Incorporation costs |
|
|
|
|
II. Intangible fixed assets |
170.475,00 |
77.972,00 |
69.542,00 |
|
R & D expenses |
|
|
|
|
Concessions,
patents, licences , trademarks |
163.069,00 |
163.069,00 |
157.966,00 |
|
Goodwill |
|
|
|
|
Acquired rights from finance leases |
|
|
|
|
Software |
290.301,00 |
313.006,00 |
346.972,00 |
|
Leasing |
|
|
|
|
Cash advance |
|
|
|
|
Provisions |
|
|
|
|
Depreciation |
-282.895,00 |
-398.103,00 |
-435.396,00 |
|
III. Tangible fixed assets |
695.053,00 |
551.940,00 |
474.204,00 |
|
Property, plant and equipment |
|
|
|
|
Machinery, equipment and other |
728.593,00 |
730.291,00 |
139.823,00 |
|
Other property plant and equipment |
461.937,00 |
452.759,00 |
402.589,00 |
|
Prepaid expenses on fixed assets |
|
|
|
|
Other assets |
862.927,00 |
809.345,00 |
707.424,00 |
|
Provisions |
|
|
|
|
Depreciation |
-1.358.404,00 |
-1.440.455,00 |
-775.632,00 |
|
IV. Financial fixed assets |
336.225,00 |
110.661,00 |
5.185.046,00 |
|
Shares in affiliated companies |
|
|
|
|
Receivables in affiliated companies |
302.156,00 |
77.303,00 |
5.100.000,00 |
|
Shares in associated companies |
|
|
|
|
Loans to associated companies |
|
|
|
|
Securities |
|
|
|
|
Other loans |
800,00 |
|
|
|
Long term deposits and guarantees |
33.269,00 |
33.358,00 |
85.046,00 |
|
Provisions |
|
|
|
|
Taxes receivable |
|
|
|
|
V.Owners equity |
|
|
|
|
VI.Long term trade liabilities |
|
|
|
|
C) DEFERRED EXPENSES |
|
|
|
|
D) CURRENT ASSETS |
34.777.893,00 |
36.840.014,00 |
38.297.399,00 |
|
I. Shareholders by required outlays |
|
|
|
|
II. Stocks |
8.588.817,00 |
8.895.868,00 |
10.463.351,00 |
|
Goods available for sale |
8.553.847,00 |
8.702.033,00 |
10.491.194,00 |
|
Raw material inventory |
18.651,00 |
22.157,00 |
|
|
Work in Progress |
|
|
|
|
Finished goods |
|
|
|
|
Subproducts and recycled materials |
|
|
|
|
Cash advance |
146.508,00 |
271.425,00 |
66.738,00 |
|
Provisions |
-130.189,00 |
-99.747,00 |
-94.581,00 |
|
III. Debtors |
25.780.790,00 |
27.804.962,00 |
27.432.503,00 |
|
Clients |
25.556.444,00 |
27.707.235,00 |
27.455.619,00 |
|
Amounts owned by affiliated companies |
344.369,00 |
232.193,00 |
99.617,00 |
|
Amounts owned by associated companies |
|
|
|
|
Other debts |
93.826,00 |
79.501,00 |
107.109,00 |
|
Staff Expenses |
|
|
|
|
Government |
116.898,00 |
237.074,00 |
309.450,00 |
|
Provisions |
-330.747,00 |
-451.041,00 |
-539.292,00 |
|
IV. Temporary financial investment |
10.052,00 |
|
23.141,00 |
|
Shares in affiliated companies |
|
|
|
|
Receivables in affiliated companies |
10.052,00 |
|
23.141,00 |
|
Shares in associated companies |
|
|
|
|
Loans to associated companies |
|
|
|
|
Short term investment |
|
|
|
|
Other loans |
|
|
|
|
Short Term Deposit and guarantees |
|
|
|
|
Provisions |
|
|
|
|
V. Short-term own shares |
|
|
|
|
VI. Treasury |
375.226,00 |
134.653,00 |
378.404,00 |
|
VII. Periodification adjustments |
23.008,00 |
4.531,00 |
|
|
ASSETS (A + B + C + D) |
35.979.646,00 |
37.580.587,00 |
44.026.191,00 |
Assets composition
Liabilities
Figures given in €
|
|
31/12/2005 (12) |
31/12/2006 (12) |
31/12/2007 (12) |
|
A) SHAREHOLDERS EQUITY |
12.551.388,00 |
13.463.061,00 |
10.595.087,00 |
|
I. Share capital |
601.000,00 |
601.000,00 |
601.000,00 |
|
II. Issue bonus |
8.904.064,00 |
8.904.064,00 |
8.904.064,00 |
|
III.Revaluation reserve |
|
|
|
|
IV.Reserves |
1.267.288,00 |
3.046.324,00 |
157.997,00 |
|
Retained earnings |
120.202,00 |
120.202,00 |
120.202,00 |
|
Sinking fund from owner equity |
|
|
|
|
Reserve for the parent company capital |
|
|
|
|
Statutory reserve |
|
|
|
|
Other funds |
1.147.074,00 |
2.926.110,00 |
37.783,00 |
|
Capital adjustments in Euros |
12,00 |
12,00 |
12,00 |
|
V.Results from previous years |
|
|
|
|
Carry Over |
|
|
|
|
Prior years losses |
|
|
|
|
Loans from
partners for losses compensation |
|
|
|
|
VI.Profit and Losses |
1.779.036,00 |
911.673,00 |
932.026,00 |
|
VII.Dividend paid during the year |
|
|
|
|
VIII.Own shares for capital reduction |
|
|
|
|
B) DEFERRED INCOME |
|
|
|
|
Capital grants |
|
|
|
|
Positive change difference |
|
|
|
|
Other deferred income |
|
|
|
|
Fiscal deferred income |
|
|
|
|
C) PROVISIONS FOR LIABILITIES AND EXPENSES |
67.000,00 |
184.000,00 |
250.170,00 |
|
Provision for pensions plans |
67.000,00 |
184.000,00 |
250.170,00 |
|
Provision for taxes |
|
|
|
|
Other provisions |
|
|
|
|
Reversion fund |
|
|
|
|
D) LONG TERM LIABILITIES |
868.619,00 |
1.237.153,00 |
5.698.061,00 |
|
I.Negotiable
bonds and other negotiable values |
|
|
|
|
Non convertible securities |
|
|
|
|
Convertible securities |
|
|
|
|
Other convertible debentures |
|
|
|
|
II.Debt with bank entities |
|
|
|
|
Long term bank loans |
|
|
|
|
Leasing |
|
|
|
|
III.Debts with associated and affiliated
companies |
868.619,00 |
1.237.153,00 |
5.698.061,00 |
|
With affiliated companies |
868.619,00 |
1.237.153,00 |
5.698.061,00 |
|
Associated companies |
|
|
|
|
IV. Other creditors |
|
|
|
|
Bills payable |
|
|
|
|
Other debts |
|
|
|
|
Long term deposit and guaranties |
|
|
|
|
Taxes receivable |
|
|
|
|
V. Deferred debts on shares |
|
|
|
|
From affiliated companies |
|
|
|
|
From associated companies |
|
|
|
|
Other companies |
|
|
|
|
VI. Long term debt with creditor |
|
|
|
|
E) SHORT TERM LIABILITIES |
22.492.639,00 |
22.696.373,00 |
27.482.873,00 |
|
I.Negotiable bonds and other negotiable values |
|
|
|
|
Non convertible securities |
|
|
|
|
Convertible securities |
|
|
|
|
Other convertible debentures |
|
|
|
|
Interests from bonds |
|
|
|
|
II.Debt with bank entities |
9.761.641,00 |
6.680.196,00 |
11.188.080,00 |
|
Loans and other debts |
9.732.489,00 |
6.654.852,00 |
11.167.948,00 |
|
Debt interest |
29.152,00 |
25.344,00 |
20.132,00 |
|
Leasing |
|
|
|
|
III. Short term
debts with associated and affiliated companies |
408.173,00 |
520.150,00 |
676.865,00 |
|
With affiliated companies |
408.173,00 |
520.150,00 |
676.865,00 |
|
Associated companies |
|
|
|
|
IV. Commercial creditors |
11.361.057,00 |
14.622.128,00 |
14.499.855,00 |
|
Accounts payable |
|
|
|
|
Expenses |
11.361.057,00 |
14.622.128,00 |
14.499.855,00 |
|
Bills payable |
|
|
|
|
V. Other non-commercial debt |
961.768,00 |
873.899,00 |
1.118.073,00 |
|
Government |
308.021,00 |
267.522,00 |
224.324,00 |
|
Bills payable |
|
|
|
|
Other debts |
|
|
|
|
Accounts receivable |
653.747,00 |
606.377,00 |
893.749,00 |
|
Short term deposits and guarantees |
|
|
|
|
VI. Provisions for current assets |
|
|
|
|
VII. Periodification adjustments |
|
|
|
|
F) SHORT TERM PROVISIONS FOR LIABILITIES AND
EXPENSES |
|
|
|
|
LIABILITIES (A + B + C + D + E + F) |
35.979.646,00 |
37.580.587,00 |
44.026.191,00 |
Liabilities
Composition
PROFIT AND LOSS ACCOUNT
Itams of the Profit and Loss Account
Figures given in €
|
|
31/12/2005 (12) |
31/12/2006 (12) |
31/12/2007 (12) |
|
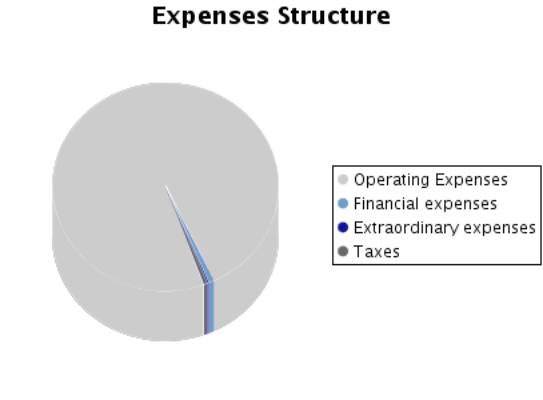
A) EXPENSES (A.1 a A.16) |
96.829.660,00 |
92.789.118,00 |
100.600.441,00 |
|
A.1.Reduction in stocks of finished goods and
work in progress |
|
|
|
|
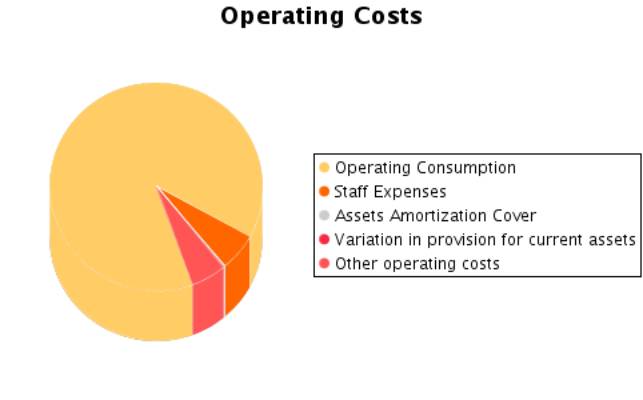
A.2.Supplies |
85.956.025,00 |
81.713.670,00 |
87.648.202,00 |
|
Material consumed |
85.956.025,00 |
81.713.670,00 |
87.648.202,00 |
|
Raw materials consumed |
|
|
|
|
Other expenses |
|
|
|
|
A.3. Labour cost |
5.239.989,00 |
5.233.831,00 |
5.747.947,00 |
|
Wages |
4.322.086,00 |
4.316.499,00 |
4.765.171,00 |
|
Social security expenses |
917.903,00 |
917.332,00 |
982.776,00 |
|
A.4. Assets depreciation |
307.298,00 |
314.352,00 |
205.099,00 |
|
A.5.Variance in the traffic provisions |
161.274,00 |
230.990,00 |
83.085,00 |
|
Variance in provision for inventory |
130.189,00 |
-30.442,00 |
-5.166,00 |
|
Variance in provision for bad debts |
31.085,00 |
261.432,00 |
88.251,00 |
|
Variance in provision for other current assets |
|
|
|
|
A.6. Other operating costs |
3.502.310,00 |
4.215.922,00 |
5.367.744,00 |
|
External costs |
3.462.279,00 |
4.178.730,00 |
5.328.180,00 |
|
Taxes |
40.031,00 |
37.192,00 |
39.564,00 |
|
Other day to day expenses |
|
|
|
|
Allowance to reversion fund |
|
|
|
|
A.I.OPERATING RESULT
(B.1+B.2+B.3+B.4-A.1-A.2-A.3-A.4-A.5-A.6) |
2.742.710,00 |
1.622.510,00 |
2.099.968,00 |
|
A.7.Financial expenses and similar |
466.232,00 |
368.593,00 |
549.861,00 |
|
Debts with related companies |
14.832,00 |
33.572,00 |
125.960,00 |
|
Debts with associated companies |
|
|
|
|
Other companies debts By debts with third parties and similar expenses |
449.755,00 |
335.021,00 |
423.897,00 |
|
Losses from financial investments |
1.645,00 |
|
4,00 |
|
A.8. Variation in financial investment provision |
|
|
|
|
A.9.Negative exchange difference |
336.124,00 |
328.912,00 |
292.543,00 |
|
A.II.POSITIVE FINANCIAL RESULTS
(B.5+B.6+B.7+B.8-A.7-A.8-A.9) |
|
|
|
|
A.III.PROFIT FROM ORDINARY ACTIVITIES
(A.I+A.II-B.I-B.II) |
2.355.593,00 |
1.278.483,00 |
1.610.801,00 |
|
A.10. Variation in provision in fixed assets |
|
|
|
|
A.11. Losses in fixed assets |
152,00 |
126,00 |
292.386,00 |
|
A.12. Losses from own shares and bonds |
|
|
|
|
A.13. Extraordinary charges |
5.909,00 |
3.561,00 |
5.969,00 |
|
A.14.Other exercises’ expenses and losses |
|
|
|
|
A.IV.POSITIVE EXTRAORDINARY RESULT
(B.9+B.10+B.11+B.12+B.13-A.10-A.11-A.12-A.13-A.14) |
277.790,00 |
12.351,00 |
|
|
A.V.PROFIT BEFORE TAXES (A.III+A.IV-B.III-B.IV) |
2.633.383,00 |
1.290.834,00 |
1.339.631,00 |
|
A.15.Corporate Taxes |
854.347,00 |
379.161,00 |
407.605,00 |
|
A.16. Other taxes |
|
|
|
|
A.VI.EXERCISE RESULT (PROFIT) (A.V-A.14-A.15) |
1.779.036,00 |
911.673,00 |
932.026,00 |
|
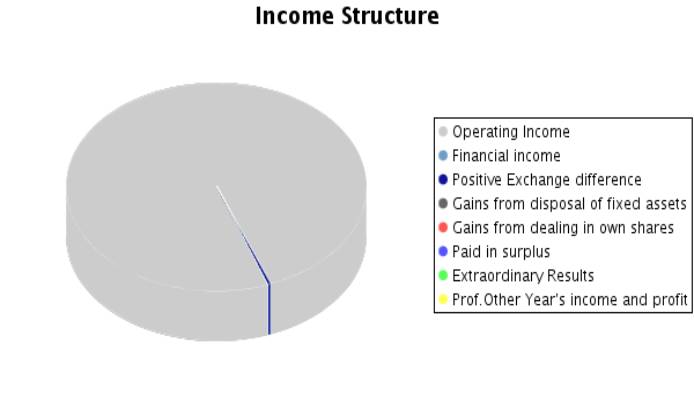
B) INCOMES (B.1 a B13) |
98.608.696,00 |
93.700.791,00 |
101.532.467,00 |
|
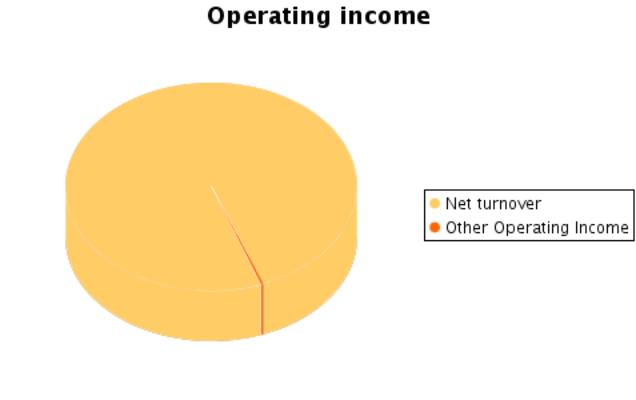
B.1. Turnover |
97.727.297,00 |
93.068.892,00 |
100.869.971,00 |
|
Sales |
97.877.763,00 |
93.183.989,00 |
101.045.509,00 |
|
Services provided |
81,00 |
133,00 |
65,00 |
|
Refunds and sale reminders |
-150.547,00 |
-115.230,00 |
-175.603,00 |
|
B.2.Increase in inventory of finished goods and
works in progress |
|
|
|
|
B.3.Expenses capitalized |
|
|
|
|
B.4. Other operating income |
182.309,00 |
262.383,00 |
282.074,00 |
|
Other incomes |
182.309,00 |
262.383,00 |
260.680,00 |
|
Grants |
|
|
21.394,00 |
|
Excess in provision for liabilities and charges |
|
|
|
|
B.I.OPERATING LOSSES
(A.1+A.2+A.3+A.4+A.5+A.6-B.1-B.2-B.3-B.4) |
|
|
|
|
B.5.Incomes from share participations |
|
|
|
|
From affiliated companies |
|
|
|
|
From associated companies |
|
|
|
|
From other companies |
|
|
|
|
B.6.Income from other securities and credits to
fixed assets |
|
|
|
|
From affiliated companies |
|
|
|
|
From associated companies |
|
|
|
|
Other companies |
|
|
|
|
B.7.Other interests and similar |
45.129,00 |
22.133,00 |
42.863,00 |
|
From affiliated companies |
27.416,00 |
5.867,00 |
25.055,00 |
|
From associated companies |
|
|
|
|
Other Interests |
17.713,00 |
16.266,00 |
17.808,00 |
|
Profits from investments |
|
|
|
|
B.8. Positive change difference |
370.110,00 |
331.345,00 |
310.374,00 |
|
B.II. NEGATIVE FINANCIAL RESULTS
(A.7+A.8+A.9-B.5-B.6-B.7-B.8) |
387.117,00 |
344.027,00 |
489.167,00 |
|
B.III.LOSSES FROM ORDINARY ACTIVITIES
(B.I+B.II-A.I-A.II) |
|
|
|
|
B.9.B.9. Gains from disposal of fixed assets |
|
149,00 |
14,00 |
|
B.10.Gains from dealing in own shares |
|
|
|
|
B.11. Paid in surplus |
|
|
|
|
B.12. Extraordinary income |
283.851,00 |
15.889,00 |
27.171,00 |
|
B.13.Other year’s income and profits |
|
|
|
|
B.IV.NEGATIVE EXTRAORDINARY LOSSES
(A.10+A.11+A.12+A.13+A.14-B.9-B.10-B.11-B.12-B.13) |
|
|
271.170,00 |
|
B.V.LOSS BEFORE TAXES (B.III+B.IV-A.III-A.IV) |
|
|
|
|
B.VI.EXERCISE RESULTS (LOSS) (B.V+A.14+A.15) |
|
|
|
Composition of the
Profit and Loss Account
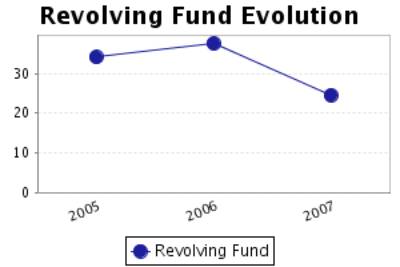
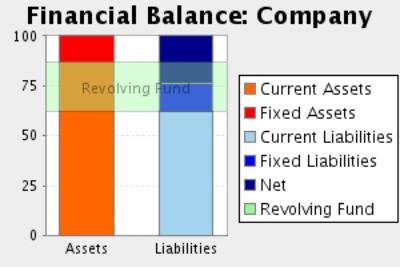
FINANCIAL BALANCE
Here the Main Capital Amounts of the company and the Revolving Fund
Evolution are analysed.
Financial Balance Table
Figures given in €
|
|
31/12/2005 (12) |
% |
31/12/2006 (12) |
% |
31/12/2007 (12) |
% |
|
A) DUE FROM
SHAREHOLDERS FOR UNCALLED CAPITAL |
|
|
|
|
|
|
|
B) FIXED ASSETS |
1.201.753,00 |
3,34 |
740.573,00 |
1,97 |
5.728.792,00 |
13,01 |
|
C) DEFERRED
EXPENSES |
|
|
|
|
|
|
|
D) CURRENT
ASSETS |
34.777.893,00 |
96,66 |
36.840.014,00 |
98,03 |
38.297.399,00 |
86,99 |
|
ASSETS (A + B +
C + D) |
35.979.646,00 |
|
37.580.587,00 |
|
44.026.191,00 |
|
|
|
||||||
|
A) SHAREHOLDERS
EQUITY |
12.551.388,00 |
34,88 |
13.463.061,00 |
35,82 |
10.595.087,00 |
24,07 |
|
B) DEFERRED INCOME |
|
|
|
|
|
|
|
C) PROVISIONS
FOR LIABILITIES AND EXPENSES |
67.000,00 |
0,19 |
184.000,00 |
0,49 |
250.170,00 |
0,57 |
|
D) LONG TERM
LIABILITIES |
868.619,00 |
2,41 |
1.237.153,00 |
3,29 |
5.698.061,00 |
12,94 |
|
E) SHORT TERM
LIABILITIES |
22.492.639,00 |
62,51 |
22.696.373,00 |
60,39 |
27.482.873,00 |
62,42 |
|
F) SHORT TERM
PROVISIONS FOR LIABILITIES AND EXPENSES |
|
|
|
|
|
|
|
LIABILITIES (A +
B + C + D + E + F) |
35.979.646,00 |
|
37.580.587,00 |
|
44.026.191,00 |
|
Financial Balance
Composition
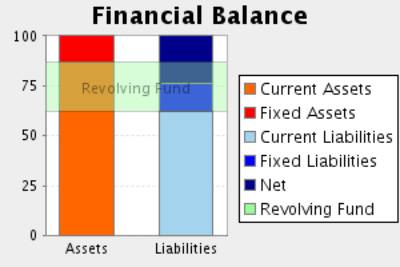
Comments on Financial Balance
In the 2005, the assets of the company were formed in 3,34% of Fixed Assets
and in 96,66% of Current Assets.This assets were financed in 34,88% with own
capitals, and in 2,60% with long term debt and in 62,51% with current
liabilities.
The result of this financial structure is a positive turnover fund of
12.285.254,00 Euros, which is equivalent to 34,15% proportion of the
company’s total assets.
In the 2006, the assets of the company were formed in 1,97% of Fixed
Assets and in 98,03% of Current Assets.This assets were financed in 35,82% with
own capitals, and in 3,78% with long term debt and in 60,39% with current
liabilities.
The result of this financial structure is a positive turnover fund of
14.143.641,00 Euros, which is equivalent to 37,64% proportion of the
company’s total assets.
This measure has increased with respect to the previous exercise in
15,13% having also increased its proportion with respect to the total assets of
the company.
In the 2007, the assets of the company were formed in 13,01% of Fixed
Assets and in 86,99% of Current Assets.This assets were financed in 24,07% with
own capitals, and in 13,51% with long term debt and in 62,42% with current
liabilities.
The result of this financial structure is a positive turnover fund of
10.814.526,00 Euros, which is equivalent to 24,56% proportion of the
company’s total assets.
This measure has diminished with respect to the previous exercise in
23,54% having also diminished its proportion with respect to the total assets
of the company.
RATIOS
Main Ratios
|
|
31/12/2005 (12) |
31/12/2006 (12) |
31/12/2007 (12) |
|
STRUCTURAL RATIOS |
|
|
|
|
Management fund |
12.285.254,00 |
14.143.641,00 |
10.814.526,00 |
|
Management Fund Requirement |
21.661.617,00 |
20.689.184,00 |
21.601.061,00 |
|
Indebtedness (%) |
65,12 |
64,18 |
75,94 |
|
External Funds on Net Worth |
1,87 |
1,79 |
3,16 |
|
GENERAL ACTIVITY RATIO |
|
|
|
|
Turnover Increase (%) |
-3,95 |
-4,77 |
8,38 |
|
Added value growth (%) |
13,04 |
-12,42 |
9,92 |
|
Cash Flow |
2.247.608,00 |
1.457.015,00 |
1.220.210,00 |
|
Labour Productivity |
1,61 |
1,41 |
1,42 |
|
Assets turnover |
2,72 |
2,48 |
2,29 |
|
Breakdown Point |
75.444.567,66 |
80.296.667,01 |
85.422.000,03 |
|
Security Margin of the Breakdown Point (%) |
22,94 |
13,97 |
15,55 |
|
ACTIVITY RATIOS |
|
|
|
|
Average Payment Period |
48 |
64 |
60 |
|
Average Collection Period |
95 |
108 |
98 |
|
Inventory Turnover Period |
32 |
34 |
37 |
|
SOLVENCY RATIOS |
|
|
|
|
Payback Capacity |
0,10 |
0,06 |
0,04 |
|
Assets Guarantee |
1,54 |
1,56 |
1,32 |
|
Short Term Debts Proportion (%) |
96,01 |
94,11 |
82,21 |
|
Interest Coverage |
3,33 |
2,95 |
1,53 |
|
LIQUIDITY RATIOS |
|
|
|
|
Current Ratio |
1,55 |
1,62 |
1,39 |
|
Immediate liquidity |
0,02 |
0,01 |
0,02 |
|
Treasury |
-9.376.363,00 |
-6.545.543,00 |
-10.786.535,00 |
|
Sales on Current Assets |
1.012 |
909 |
948 |
Results Analysis
Ratios
|
|
31/12/2005 (12) |
31/12/2006 (12) |
31/12/2007 (12) |
|
Economic profitability (%) |
7,62 |
4,32 |
4,77 |
|
Operating Profitability (%) |
2,81 |
1,74 |
2,08 |
|
Equity gearing |
2,46 |
2,20 |
3,19 |
|
Financial profitability (%) |
14,17 |
6,77 |
8,80 |
|
General Profitability (%) |
1,82 |
0,98 |
0,92 |
Comments on the
Results Analysis Ratios
The economic profitability in the year2006 achieved a 4,32% positive
level, due to a 1,74% economic margin and to an assets turnover of2,48%.
The economic profitability in the year has reduced from 7,62% up to
4,32% of2006, even if it remains positive. This fall is due to the decrease in
operating profitability, that has passe from 2,81% to 1,74%, as assets turnover
whose index has passed from 2,72 to 2,48%.
Financial profitability on 2006 achieved a 6,77%.
The company’s financial structure has instigated its economic
profitability with an indebtedness level of 2,20.
The general profitability on 2006 achieved a 0,98%.
The economic profitability in the year2007 achieved a 4,77% positive
level, due to a 2,08% economic margin and to an assets turnover of2,29%.
The economic profitability in the year has increased from 4,32% up to
4,77%. This growth is due to the economic margin increase, from 1,74% to the
current 2,08% in spite of the assets turnover drop, which have decreased from
2,48 to 2,29%.
Financial profitability on 2007 achieved a 8,80%.
The company’s financial structure has instigated its economic
profitability with an indebtedness level of 3,19.
The general profitability on 2007 achieved a 0,92%.
SECTORIAL ANÁLYSIS
Large Capital Amounts and Financial Balance
Figures given in %
|
|
COMPANY (2007) |
SECTOR |
DIFFERENCE |
DIFFERENCE RELATIVE |
|
|
|
|
|
|
ASSETS |
|
|
|
|
|
|
|
|
|
|
A) DUE FROM
SHAREHOLDERS FOR UNCALLED CAPITAL |
|
0,00 |
|
|
|
|
|
|
|
|
B) FIXED ASSETS |
13,01 |
39,26 |
-26,25 |
-66,86 |
|
|
|
|
|
|
C) DEFERRED
EXPENSES |
|
0,83 |
|
|
|
|
|
|
|
|
D) CURRENT
ASSETS |
86,99 |
59,91 |
27,08 |
45,20 |
|
|
|
|
|
|
ASSETS (A + B +
C + D) |
100 |
100 |
|
|
|
|
|
|
|
|
|
|
|
|
|
|
|
|
|
|
|
|
COMPANY (2007) |
SECTOR |
DIFFERENCE |
DIFFERENCE RELATIVE |
|
|
|
|
|
|
LIABILITIES |
|
|
|
|
|
|
|
|
|
|
A) SHAREHOLDERS
EQUITY |
24,07 |
40,02 |
-15,95 |
-39,86 |
|
|
|
|
|
|
B) DEFERRED
INCOME |
|
0,25 |
|
|
|
|
|
|
|
|
C) PROVISIONS
FOR LIABILITIES AND EXPENSES |
0,57 |
1,91 |
-1,34 |
-70,13 |
|
|
|
|
|
|
D) LONG TERM
LIABILITIES |
12,94 |
8,00 |
4,94 |
61,83 |
|
|
|
|
|
|
E) SHORT TERM
LIABILITIES |
62,42 |
49,62 |
12,80 |
25,81 |
|
|
|
|
|
|
F) SHORT TERM
PROVISIONS FOR LIABILITIES AND EXPENSES |
|
0,20 |
|
|
|
|
|
|
|
|
LIABILITIES (A +
B + C + D + E + F) |
100 |
100 |
|
|
|
|
|
|
|
Sectorial Financial
Balance Comparison
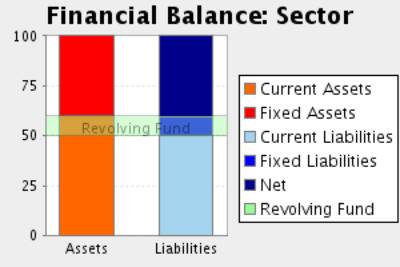
Comments to the Sectorial Analysis
In the 2007, the assets of the company were formed in 13,01% of fixed
assets and in 86,99Current Assets % In the sector, the proportion of fixed
assets was of 40,09%, 67,55% superior, and the proportion of current assets was
of 59,91%, 45,20% inferior.
The assets were financed in the company in 24,07% with own capitals , in
13,51% with fixed liabilities and in 62,42% with current liabilities In the
sector, the self financing represented 40,28%, 40,24% superior. On the other
hand the long term debts represented in the sector an average of 9,90%
financing, with a relative difference of 36,41% in favour of the companyAnd,
short term liabilities represented in the sector an average of 49,82%
financing, with a relative difference of 25,29% in favour of the company
The result of this company’s financial structure is a turnover fund that
represents 24,56% of the total assets; in the sector, this same proportion is
10,09%, therefore, we can say that the company’s turnover fund is 143,43%
higher than the one in of the sector.
Analytical Account of Results
Figures given in %
|
|
COMPANY (2007) |
SECTOR |
DIFFERENCE |
DIFFERENCE RELATIVE |
|
Turnover |
99,72 |
99,44 |
0,28 |
0,28 |
|
Other operating income |
0,28 |
0,56 |
-0,28 |
-49,91 |
|
Production Value |
100,00 |
100,00 |
0,00 |
0,00 |
|
Operating expenses |
86,65 |
87,52 |
-0,87 |
-0,99 |
|
Other operation expenses |
5,31 |
7,10 |
-1,79 |
-25,17 |
|
Added value |
8,04 |
5,38 |
2,65 |
49,30 |
|
Labour cost |
5,68 |
2,37 |
3,31 |
139,46 |
|
Gross Economic Result |
2,36 |
3,01 |
-0,65 |
-21,67 |
|
Assets depreciation |
0,20 |
0,82 |
-0,62 |
-75,64 |
|
Variation in provision for current assets and bad debt losses |
0,08 |
0,05 |
0,03 |
53,85 |
|
Net Economic Result |
2,08 |
2,14 |
-0,06 |
-2,80 |
|
Financial income |
0,35 |
0,79 |
-0,44 |
-55,92 |
|
Financial Charges |
0,83 |
0,48 |
0,35 |
71,49 |
|
Variation in financial investment provision |
|
0,00 |
|
|
|
Ordinary Activities Result |
1,59 |
2,45 |
-0,86 |
-35,05 |
|
Extraordinary income |
0,03 |
0,19 |
-0,16 |
-84,21 |
|
Extraordinary charges |
0,29 |
0,13 |
0,16 |
123,08 |
|
Variation in provision in fixed assets |
|
0,06 |
|
|
|
Results before Taxes |
1,32 |
2,45 |
-1,13 |
-46,10 |
|
Corporate taxes |
0,40 |
0,69 |
-0,29 |
-42,28 |
|
Net Result |
0,92 |
1,76 |
-0,84 |
-47,61 |
|
Assets depreciation |
0,20 |
0,82 |
-0,62 |
-75,64 |
|
Change of Provisions |
0,08 |
0,11 |
-0,03 |
-29,20 |
|
Net Self-Financing |
1,21 |
2,69 |
-1,48 |
-55,02 |
Main Ratios
|
|
COMPANY (2007) |
PTILE25 |
PTILE50 |
PTILE75 |
|
STRUCTURAL RATIOS |
|
|
|
|
|
Management fund |
10.814.526,00 |
2.000,94 |
5.767,84 |
14.304,14 |
|
Management Fund
Requirement |
21.601.061,00 |
-9.292,82 |
-977,36 |
5.397,65 |
|
Indebtedness (%) |
75,94 |
54,88 |
66,33 |
77,50 |
|
External Funds
on Net Worth |
3,16 |
1,22 |
1,97 |
3,44 |
|
GENERAL ACTIVITY
RATIO |
|
|
|
|
|
Turnover Increase (%) |
8,38 |
0,51 |
6,97 |
17,97 |
|
Added value growth (%) |
9,92 |
-17,11 |
-1,23 |
12,22 |
|
Cash Flow |
1.220.210,00 |
1.019,88 |
2.693,90 |
5.671,22 |
|
Labour Productivity |
1,42 |
1,48 |
2,02 |
3,20 |
|
Assets turnover |
2,29 |
1,49 |
1,90 |
2,92 |
|
Breakdown Point |
85.422.000,03 |
40.272.149,61 |
56.058.838,07 |
85.937.635,89 |
|
Security Margin of the Breakdown Point (%) |
15,55 |
9,38 |
19,54 |
34,50 |
|
ACTIVITY RATIOS |
|
|
|
|
|
Average Payment Period |
60 |
21 |
46 |
75 |
|
Average Collection Period |
98 |
54 |
92 |
121 |
|
Inventory Turnover Period |
37 |
15 |
31 |
51 |
|
SOLVENCY RATIOS |
|
|
|
|
|
Payback Capacity |
0,04 |
0,04 |
0,09 |
0,17 |
|
Assets Guarantee |
1,32 |
1,28 |
1,50 |
1,82 |
|
Short Term Debts Proportion (%) |
82,21 |
84,33 |
96,45 |
99,64 |
|
Interest Coverage |
1,53 |
0,91 |
3,60 |
12,50 |
|
LIQUIDITY RATIOS |
|
|
|
|
|
Current Ratio |
1,39 |
1,08 |
1,24 |
1,63 |
|
Immediate liquidity |
0,02 |
0,02 |
0,07 |
0,26 |
|
Treasury |
-10.786.535,00 |
-7.995,37 |
-50,87 |
2.849,99 |
|
Sales on Current Assets |
948 |
713 |
877 |
1.404 |
Results Analysis
Ratios
|
|
COMPANY (2007) |
PTILE25 |
PTILE50 |
PTILE75 |
|
Economic profitability (%) |
4,77 |
2,45 |
5,22 |
10,75 |
|
Operating Profitability (%) |
2,08 |
1,03 |
2,81 |
5,90 |
|
Equity gearing |
3,19 |
1,81 |
2,81 |
4,04 |
|
Financial profitability (%) |
8,80 |
4,50 |
11,86 |
21,27 |
|
General Profitability (%) |
0,92 |
0,65 |
1,78 |
3,90 |
FOREIGN EXCHANGE
RATES
|
Currency |
Unit
|
Indian Rupees |
|
US Dollar |
1 |
Rs.45.77 |
|
UK Pound |
1 |
Rs.80.67 |
|
Euro |
1 |
Rs.64.20 |
RATING
EXPLANATIONS
|
RATING |
STATUS |
PROPOSED CREDIT LINE |
|
|
>86 |
Aaa |
Possesses an extremely sound financial base with the strongest
capability for timely payment of interest and principal sums |
Unlimited |
|
71-85 |
Aa |
Possesses adequate working capital. No caution needed for credit
transaction. It has above average (strong) capability for payment of interest
and principal sums |
Large |
|
56-70 |
A |
Financial & operational base are regarded healthy. General
unfavourable factors will not cause fatal effect. Satisfactory capability for
payment of interest and principal sums |
Fairly Large |
|
41-55 |
Ba |
Overall operation is considered normal. Capable to meet normal
commitments. |
Satisfactory |
|
26-40 |
B |
Unfavourable & favourable factors carry similar weight in credit consideration.
Capability to overcome financial difficulties seems comparatively below
average. |
Small |
|
11-25 |
Ca |
Adverse factors are apparent. Repayment of interest and principal sums
in default or expected to be in default upon maturity |
Limited with
full security |
|
<10 |
C |
Absolute credit risk exists. Caution needed to be exercised |
Credit not
recommended |
|
NR |
In view of the lack of information, we have no basis upon which to
recommend credit dealings |
No Rating |
|
This score serves as a reference to assess SC’s credit risk
and to set the amount of credit to be extended. It is calculated from a
composite of weighted scores obtained from each of the major sections of this
report. The assessed factors and their relative weights (as indicated through
%) are as follows:
Financial
condition (40%) Ownership
background (20%) Payment
record (10%)
Credit history
(10%) Market trend
(10%) Operational
size (10%)