![]()
MIRA
INFORM REPORT
|
Report Date : |
15.09.2008 |
IDENTIFICATION
DETAILS
|
Name : |
BOSSAR S.L. |
|
|
|
|
Registered Office : |
Street Can
Magi (Pg Industrial Santiga), 2, Cp 08210, Barbera Del
Valles Barcelona |
|
|
|
|
Country : |
Spain |
|
|
|
|
Financials (as on) : |
31.12.2006 |
|
|
|
|
Date of Incorporation : |
|
|
|
|
|
Legal Form : |
Limited Liability Company |
|
|
|
|
Line of Business : |
Manufacturer
of Machinery for food Beverages and Tabacco Processing |
RATING &
COMMENTS
|
MIRA’s Rating : |
B |
|
RATING |
STATUS |
PROPOSED CREDIT LINE |
|
|
26-40 |
B |
Unfavourable & favourable factors carry similar weight in credit
consideration. Capability to overcome financial difficulties seems
comparatively below average. |
Small |
|
Status : |
Moderate |
|
|
|
|
Payment Behaviour : |
Slow |
|
|
|
|
Litigation : |
Clear |
FINANCIAL REPORT
BOSSAR S.L.
TAX NUMBER: B62104427
EXECUTIVE SUMMARY
Identification
Current Business Name: BOSSAR S.L.
Other names: YES
Current
Address: STREET CAN
MAGI (PG INDUSTRIAL SANTIGA), 2, CP 08210, BARBERA DEL
VALLES BARCELONA
Telephone number: 902406090 Fax: 902406091
URL: www.bossar.com Corporate e-mail: headquaters@bossar.com
Commercial Risk
Credit Appraisal: Caution
suggested
RAI: YES
Legal Actions: NO
Financial Information
Latest Balance sheet sales (2006): 23.249.923,00 € (MERCANTILE REGISTER)
Result: -2.989.588 €
Total Assets: 39.281.147 €
Social Capital: 8.448.454,00 €
Employees: 100
Commercial Information
Constitution Date: 22/11/1999
Business activity: Mfg. of
machinery for food beverages & tabacco proccessing
NACE Code: 2953
International Operations: Imports and
Exports
Corporate Structure
Chief Officer:
Participations: 5
Other Complementary Information
Latest proceeding published in BORME: 19/08/2008 Resignations
Latest press article: 26/02/2002 CINCO
DIAS (GENERAL INFORMATION)
Bank Entities: Yes
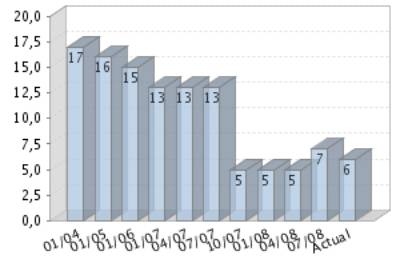
Rating Evolution
Financial Situation
Fiscal year2006
|
Treasury |
Restrained |
|
Indebtedness |
Heavy |
|
Profitability |
Very Negative |
|
Balance |
Weak |
Performance
|
Legal Actions |
Exceptional |
|
Business
Trajectory |
Superior |
RAI 
NUMBER OF ENTRIES FOUND: 2
TOTAL AMOUNT: 494.039,36 €
DATE OF THE LAST ENTRY: 06/10/2007
DATE AND TIME OF THE CONSULTATION: 08/09/2008
08:09:20
Information from the Registro de Aceptaciones Impagados (RAI)- Disputed
Bills register.
It can only be used for information legitimate needs of the consulting
party, in accordance with its social or business activity, in order to grant a
credit or the monitoring or control of the already granted credits and can not
be transmitted or communicated to thirds, nor copied, duplicated, reproduced
nor implemented to any database , owned or external, or reused it in anyway,
direct or indirectly.
INCIDENTS

Summary
LEGAL ACTIONS: No legal incidences registered
CLAIM FILED AGAINST THE ADMINISTRATION: No administrative
claims registered
AFFECTED BY: No significant element.
FINANCIAL ELEMENTS AND SECTORIAL
COMPARATIVE
FINANCIAL ELEMENTS
Figures given in €
|
|
2004 (12) |
2005 (12) |
2006 (12) |
% ASSETS |
|
|
|
|
|
|
BALANCE SHEET
ANALYSIS |
|
|
|
|
|
|
|
|
|
|
OWN FUNDS |
5.773.918,00 |
4.943.144,00 |
1.953.556,00 |
4,97 |
|
|
|
|
|
|
DEBT |
32.017.669,00 |
27.576.151,00 |
37.327.591,00 |
95,03 |
|
|
|
|
|
|
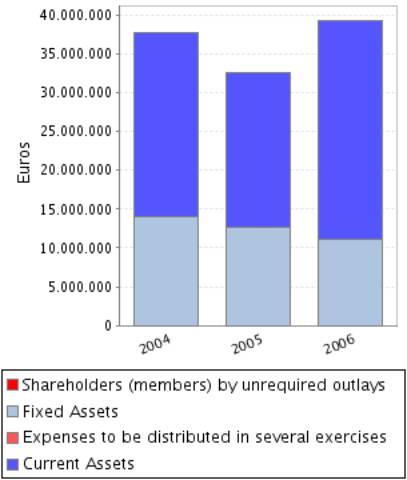
FIXED ASSETS |
13.973.333,00 |
12.591.501,00 |
11.145.809,00 |
28,37 |
|
|
|
|
|
|
TOTAL ASSETS |
37.791.587,00 |
32.519.295,00 |
39.281.147,00 |
|
|
|
|
|
|
|
|
|
|
|
|
|
|
|
|
|
|
|
2004 (12) |
2005 (12) |
2006 (12) |
% SALES |
|
|
|
|
|
|
PROFIT AND LOSS
ACCOUNT ANALYSIS |
|
|
|
|
|
|
|
|
|
|
SALES |
27.586.011,00 |
10.962.357,00 |
23.249.923,00 |
|
|
|
|
|
|
|
ADDED VALUE |
8.002.410,00 |
-274.221,00 |
5.947.443,00 |
25,58 |
|
|
|
|
|
|
EBITDA |
805.241,00 |
-5.678.302,00 |
679.453,00 |
2,92 |
|
|
|
|
|
|
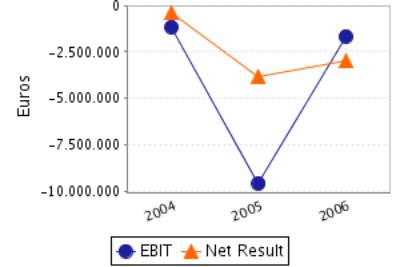
EBIT |
-1.152.370,00 |
-9.562.338,00 |
-1.653.737,00 |
-7,11 |
|
|
|
|
|
|
NET RESULT |
-413.562,00 |
-3.830.776,00 |
-2.989.588,00 |
-12,86 |
|
|
|
|
|
Balance Sheets Items
Analysis
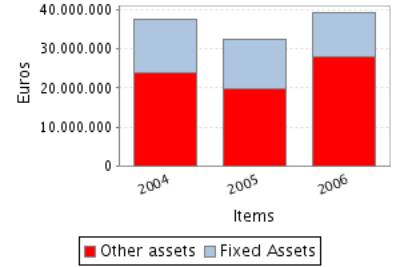
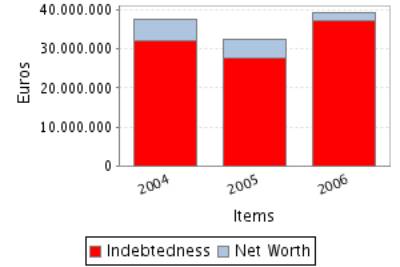
Balance Sheet Comments
Total assets of the company decreased in 13,95% between 2004 and 2005.
This decrease in the amount total assets, has been reflected in a
reduction of the fixed assets of 9,89%.
Assets reduction is explained by net worth decrease of14,39and to
indebtedness reduction of 13,87.
Total assets of the company grew 20,79% between 2005 and 2006.
In spite of the assets’ growth, the fixed assets decreased 11,48%.
This growth has been financed with an indebtedness increase of
35,36%.Moreover, net worth has been reduced in 60,48%, which explains a part of
the indebtedness increase. .
Profit and Loss Account Analysis
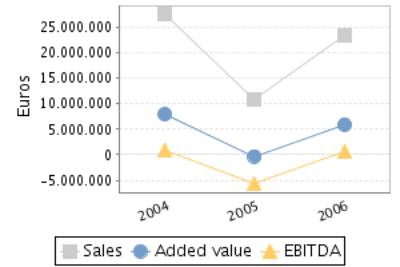
Profit and Loss Account Comments
The company’s sales figure decreased in 60,26% between 2004 and 2005.
The company’s EBIT decreased in 729,80% between 2004 and 2005.
This evolution implies a reduction in the company’s operating
profitability.
The result of these variations is a decrease of the company’s Economic
Profitability of 864,32% in the analysed period, being this profitability of
-29,41% in the year 2005.
The company’s Net Result decreased in 826,29% between 2004 and 2005.
This evolution, compared to the EBIT’s performance, implies that the
financial and extraordinary activities have had a negative effect in the
company’s Financial Profitability.
The result of these variations is a reduction of the company’s
profitability of 981,96% in the analysed period, being equal to -77,50% in the
year 2005.
The company’s sales figure grew 112,09% between 2005 and 2006.
The company’s EBIT grew 82,71% between 2005 and 2006.
This evolution implies a reduction in the company’s operating
profitability.
The result of these variations is an increase of the company’s Economic
Profitability of 85,68% in the analysed period, being this profitability of
-4,21% in the year 2006.
The company’s Net Result grew 21,96% between 2005 and 2006.
This evolution, compared to the EBIT’s performance, implies that the
financial and extraordinary activities have had a negative effect in the
company’s Financial Profitability.
The result of these variations is a reduction of the company’s
profitability of 97,47% in the analysed period, being equal to -153,03% in the
year 2006.
ANNUAL FINANCIAL REPORT
ADDITIONAL DATA
Source: annual financial report 2006
Results Distribution
Figures given in €
|
DISTRIBUTION
BASE |
DISTRIBUTION TO |
||
|
Profit and Loss |
-2.989.588,00 |
Retained earnings |
0,00 |
|
Carry Over |
0,00 |
Voluntary Reserve |
0,00 |
|
Voluntary reserves |
0,00 |
Prior years losses |
-2.989.588,00 |
|
Reserves |
0,00 |
Carry Over |
0,00 |
|
Other concepts |
0,00 |
Other funds |
0,00 |
|
Total of Amounts to be distributed |
-2.989.588,00 |
Dividends |
0,00 |
|
|
|
Other Applications |
0,00 |
Auditing
Auditors’ opinion: FAVOURABLE WITH RESERVATIONS
Auditor: GUILERA VALLS JORGE
Auditing exceptions:
HASTA LA FECHA NO HEMOS RECIBIDO CONFIRMACION DE BOSSAR USA INC., QUE
TAL COMO SE MUESTRA EN LA NOTA 11 DE LA MEMORIA ADJUNTA PRESENTA UNOS SALDOS
DEUDORES Y ACREEDORES DE 6.263.334 Y 1.296.201 EUROS RESPECTIVAMENTE. Y TAMPOCO
HE PODIDO VERIFICAR LA RAZONABILIDAD DE LOS MISMOS POR APLICACION DE OTROS
PROCEDIMIENTOS ALTERNATIVOS. LA SOCIEDAD CON POSTERIORIDAD AL CIERRE DEL
EJERCICIO HA REALIZADO PARTICIPACIONES FINANCIERAS QUE POSEIA AL 31 DE
DICIEMBRE DE 2006, INCURRIENDO EN UNA PERDIDA DE 120 MIL EUROS APROXIMADAMENTE
Y AL NO HABER PROVISION POR DICHO CONCEPTO LAS PERDIDAS DEL EJERCICIO ESTAN
INFRAVALORADAS POR ESTE IMPORTE. LA SOCIEDAD POSEE UNA PARTICIPACION EN UNA
EMPRESA, QUE TAL COMO SE MUESTRA EN LA NOTA 8 DE LA MEMORIA ADJUNTA FIGURA
REGISTRADA POR 60.414 EUROS, LA CUAL PRESENTA UNOS FONDOS PROPIOS NEGATIVOS.
ADICIONALMENTE LA SOCIEDAD MANTIENE CON ESTA EMPRESA UNOS SALDOS DEUDORES Y
ACREEDORES POR UNOS IMPORTES DE 258.771 Y 128.397 EUROS RESPECTIVAMENTE (VER
NOTAS 8 N
COMPARATIVE SECTOR ANALYSIS
Values table
Figures expressed in %
|
|
COMPANY (2006) |
SECTOR |
DIFFERENCE |
DIFFERENCE RELATIVE |
|
|
|
|
|
|
BALANCE SHEET
ANALYSIS: % on the total assets |
|
|
|
|
|
|
|
|
|
|
OWN FUNDS |
4,97 |
42,16 |
-37,19 |
-88,20 |
|
|
|
|
|
|
DEBT |
95,03 |
57,84 |
37,19 |
64,29 |
|
|
|
|
|
|
FIXED ASSETS |
28,37 |
29,21 |
-0,84 |
-2,87 |
|
|
|
|
|
|
|
|
|
|
|
|
|
|
|
|
|
|
COMPANY (2006) |
SECTOR |
DIFFERENCE |
DIFFERENCE RELATIVE |
|
|
|
|
|
|
PROFIT AND LOSS
ACCOUNT ANALYSIS: % on the total operating income |
|
|
|
|
|
|
|
|
|
|
SALES |
97,59 |
98,13 |
-0,54 |
-0,55 |
|
|
|
|
|
|
ADDED VALUE |
24,96 |
29,56 |
-4,60 |
-15,55 |
|
|
|
|
|
|
EBIT |
-6,94 |
6,40 |
-13,34 |
-208,51 |
|
|
|
|
|
|
NET RESULT |
-12,55 |
4,42 |
-16,96 |
-384,23 |
|
|
|
|
|
Sector Composition
Compared sector (NACE): 295
Number of companies: 139
Size (Sales Figure) : 7.000.000,00 - 40.000.000,00 Euros
Comments on the sectorial comparative
Compared to its sector the assets of the companies show an inferior
proportion of fixed assets. Specifically the difference with the sector average
is -0,84% , which means a relative difference of -2,87% .
In liabilities composition the company appeals on a wider scale to self
financing, being the proportion of net worth of 37,19% inferior, which means a
relative difference of 88,20% 37,19% more than the sector, which means a
difference of 64,29% .
The proportion that the sales mean to the company’s total ordinary
income is 97,59%, 0,54% lower than in the sector, which means a relative
difference of 0,55% .
The company’s EBIT was negative and equal to-6,94% with regard to the
total ordinary income, 13,34% less than the sector, which means a relative
difference of 208,51% .
The company’s capacity to generate operating income is equal to that of
the sector as its ratio EBIT/Sales is also equal.
The company’s net result was negative and equal to -12,55% with regard
to the total ordinary income, 16,96% less than the sector, which means a
relative difference of 384,23% .
The financial and extraordinary results and the tax impact have had a
more positive impact on the Net result in the company than in the sector; as a
consequence, the company shows a better Net Result/EBIT ratio.
ADDRESSES
Current Legal Seat Address:
STREET CAN MAGI (PG INDUSTRIAL SANTIGA), 2
08210 BARBERA DEL VALLES BARCELONA
Previous Seat Address:
RONDA SANT PERE, 17
08010
BARCELONA
Characteristics of the current address
Type of premises: office, factory,
warehouse, warehouse
Property: owned; with no official confirmation
Local Situation: main
CORPORATE STRUCTURE
ADMINISTRATIVE LINKS
Main Board members, Directors and Auditor ![]()
|
POSITION |
SURNAMES AND
NAME |
APPOINTMENT DATE |
|
|
CHIEF OFFICER |
CIBERA SANTASUSANA ALFONSO |
04/03/2005 |
|
|
CHIEF OFFICER |
PEYRA TORRELLA JOSE MARIA |
03/09/2007 |
|
|
CHIEF OFFICER |
HANS RUDOLF TEUSCHER NIEVERGELT |
05/09/2007 |
|
|
AUDITOR |
APPOINTMENT DATE |
||
|
BCN AUDITORES SL |
24/01/2008 |
||
|
GUILERA VALLS JORGE |
24/01/2008 |
||
Functional Managers
|
POSITION |
SURNAMES AND
NAME |
|
General Manager |
HANS RUDOLF TEUSCHER NIEVERGELT |
|
General Manager |
TEUSCHER HANS |
|
Financial Manager |
GAGLIARDI MIGUEL |
FINANCIAL LINKS
|
|
BUSINESS NAME |
CIF / COUNTRY |
% |
SOURCE |
DATA INF. |
|
|
MARAKEN S.L. |
B62446786 |
Indet. |
OWN SOURCES |
18/06/2008 |
|
|
BUSINESS NAME |
CIF / COUNTRY |
% |
SOURCE |
DATA INF. |
|
|
KAPALUA S.A. |
A61226619 |
100,00 |
OWN SOURCES |
23/01/2006 |
|
|
BOSSAR USA INC |
ESTADOS UNIDOS |
100,00 |
TRADE REG. |
31/12/2006 |
|
|
BOSSAR PACKAGING MACHINERY SINGAPORE PTE LTD |
SINGAPUR |
100,00 |
TRADE REG. |
31/12/2006 |
|
|
BOSSAR LATINOAMERICA SA |
|
80,00 |
TRADE REG. |
31/12/2006 |
|
|
ASEPTIS SL |
B63575930 |
33,00 |
TRADE REG. |
31/12/2006 |
![]() Company
with solvency rating below 7
Company
with solvency rating below 7
CREDIT INFORMATION
Constitution Date: 22/11/1999
Foundation Date: 01/01/1992
Activity: Mfg. of machinery for food beverages &
tabacco proccessing
NACE Code: 2953
NACE Activity: Manufacture of
machinery for food, beverage and tobacco processing
Business: SE AMPLIA A. ACTIVIDAD DE FABRICACION, COMERCIALIZACION,
DISTRIBUCION, EXPORT-IMPORT, COMPRA Y VENTA DE MAQUINARIA INDUSTRIAL Y SUS
ACCESORIOS, ASI COMO LAS ACTIVIDADES INHERENTES A LA ASISTENCIA TECNICA Y SUS
MANTENIMIE
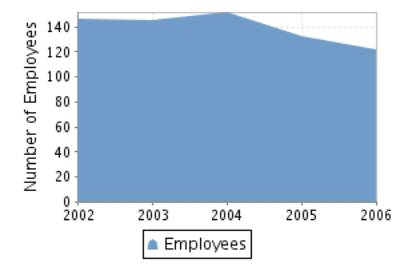
Employees 
Number of total employees: 100 (2008)
Number of fixed employees: 93,44%
Number of temporary employees: 6,56%
Employees evolution
PURCHASES
Payments (estimated):
Imports from: UE, EEUU
SUPPLIERS
|
BUSINESS NAME |
INTERNATIONAL |
|
MARAKEN SA |
NO |
|
BOSSAR PACKAGING
MACHINERY SIMGAPORE PTE LTD |
YES |
|
BOSSAR USA INC |
YES |
|
BOSSA
LATINOAMERICA SA |
NO |
|
BOSSAR USA INC |
NO |
|
MARAKEN SA |
NO |
|
BOSSAR PACKAGING
MACHINERY SINGAPORE PTE LTD |
NO |
|
BOSSAR
LATINOAMERICA SA |
YES |
|
COPACKER SA |
NO |
|
QUIMTEFA SL |
NO |
10 proveedores
SALES
Collection (estimated):
Export Percentage: 90%
Exports to: EE.UU., Unión Europea, Africa, paéses
hispanoamericanos, etc.
CLIENTS
|
BUSINESS NAME |
INTERNATIONAL |
|
MARAKEN SA |
NO |
|
BOSSAR
LATINOAMERICA SA |
NO |
|
COPACKER SA |
NO |
|
MARAKEN SA |
NO |
|
BOSSAR USA INC |
NO |
|
BOSSAR USA INC |
YES |
|
ASEPTIS SL |
NO |
|
BOSSAR LATINOAMERICA
SA |
YES |
|
BOSSAR PACKAGING
MACHINERY SINGAPORE PTE LTD |
YES |
|
BOSSAR PACKAGING
MACHINERY SINGAPORE PTE LTD |
NO |
11 clientes
Banks 
|
ENTITY |
BRANCH |
ADDRESS |
TOWN OR CITY |
PROVINCE |
|
BANCO DE SABADELL, S.A. |
|
|
BARCELONA |
|
|
BANCO SANTANDER, S.A. |
|
|
|
|
|
BANCO DE SABADELL, S.A. |
0042 |
AV GENERALITAT 000068 |
BARBERA DEL VALLES |
Barcelona |
|
COMMERZBANK AKTIENGESELLSCHAFT, S.E. |
0002 |
CONSEJO DE CIENTO 357-359 |
BARCELONA |
Barcelona |
|
BANCO BILBAO VIZCAYA ARGENTARIA, S.A. |
4330 |
BALMES, 1 |
MOLLET DEL VALLES |
Barcelona |
5 bank entities registered
Brands, Signs and Commercial
Names 
FORMER NAMES:
•
ACTIME XXI S.L.
LEGAL STRUCTURE
Constitution Data
Register Date: 22/11/1999
Register town: Barcelona
Announcement number: 1727
Legal form: LIMITED LIABILITY
COMPANY
Social Capital: 3.006 €
Current structure data 
Current Legal Form: LIMITED LIABILITY
COMPANY
Current Capital:
8.448.454,00 €
Legal Aspects
Obligation to fill in Financial
Statements: YES
Chamber census: YES (2006)
Listed on a Stock Exchange: NO
B.O.R.M.E.(Official Companies
Registry Gazette) 
Registered Proceedings
|
PROCEEDINGS |
DATE |
NOTICE NUM. |
TRADE REG. |
|
Resignations |
19/08/2008 |
397960 |
Barcelona |
|
Other statutory acts |
08/04/2008 |
182323 |
Barcelona |
|
Capital decrease |
04/04/2008 |
177890 |
Barcelona |
|
Capital increase |
04/04/2008 |
177890 |
Barcelona |
Other Proceedings published
|
PROCEEDINGS |
DATE |
NOTICE NUM. |
TRADE REG. |
|
Registration of accounts (2006) Individual |
31/03/2008 |
109911 |
Barcelona |
Press articles

26/02/2002 CINCO DIAS (GENERAL INFORMATION)
BOSSAR ULTIMA UN PLAN DE CRECIMIENTO A CINCO AÑOS CONSISTENTE EN
DIVERSIFICAR EL CATALOGO DE PRODUCTOS Y AUMENTAR LA PRESENCIA EN LOS MERCADOS
INTERNACIONALES. LA EMPRESA, QUE EXPORTA EL 90% DE SU FACTURACION, QUIERE
AUMENTAR SU PENETRACION EN ESTADOS UNIDOS, QUE REPRESENTA EL 25% DE LAS VENTAS
EN EL EXTERIOR. DE ESTA FORMA, BOSSAR PREVE PASAR DE LOS 30,86 MM. DE EUROS
REGISTRADOS EN 2001 A 60,10 MM. EN CINCO AÑOS. EL BENEFICIO OPERATIVO BRUTO
CORRESPONDIENTE AL PASADO AÑO ALCANZO 4,03 MM. DE EUROS. LA EMPRESA CUENTA CON
UNA PLANTILLA DE 140 EMPLEADOS. BOSSAR SE HA ENCARAMADO AL PRIMER PUESTO
MUNDIAL DE SU SECTOR EN LOS ULTIMOS DOS AÑOS.
06/03/2001 VANGUARDIA (FINANCIAL INFORMATION)
ESTA CIA. HA INICIADO ESTE AÑO SU ANUNCIADO PLAN DE CRECIMIENTO BASADO
EN LA BUSQUEDA Y CONSOLIDACION DE NUEVOS MERCADOS. BOSSAR INVIRTIO EL PASADO
AÑO UNOS 100 MM. DE PTAS. EN EL DISEÑO Y DESARROLLO DE MAQUINAS CON MAS
VELOCIDAD Y PARA ENVASADOS DE DIFERENTES PRODUCTOS Y PREVE DESTINAR OTROS 200
MM. EN ADAPTAR SUS MODELOS A LAS NECESIDADES DE EMBALAJE DE CADA SECTOR. LAS
EXPORTACIONES DE LA CIA. REPRESENTAN EL 95% DEL NEGOCIO TOTAL REGISTRADO EL
PASADO AÑO. LAS VENTAS ALCANZARON LOS 4.600 MM., UN 47% MAS RESPECTO A 1999.
PARA EL PRESENTE EJERCICIO, PREVE OTRO CRECIMIENTO DEL 20% SUPERANDO CASI LOS
5.600 MM. GABRIEL TALTAVULL OSTENTA EL 53% DEL CAPITAL DE LA CIA.
Complementary Information
El balalance cerrado a 31/12/1999 esta
disponible en INFORMA, pero no
ha sido cargado por tener una duracion inferior a tres meses.
La Junta General de fecha 13/11/00, acordo la fusion por absorcion
de BOSSAR SA NIF:A60161544 por parte de ACTIME XXI SL NIF:B62104427,
segun anuncio publicado en Borme Seccion 2 del 15/11/00.
FINANCIAL INFORMATION
The information on the last account contained in this report is extracted
from the Mercantile Register file of the legal address of the Company and
dated 02/04/2008.
BALANCE SHEET
Assets
Figures given in €
|
|
31/12/2004 (12) |
31/12/2005 (12) |
31/12/2006 (12) |
|
A) DUE FROM SHAREHOLDERS FOR UNCALLED CAPITAL |
|
|
|
|
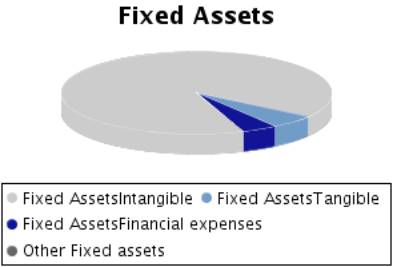
B) FIXED ASSETS |
13.973.333,00 |
12.591.501,00 |
11.145.809,00 |
|
I. Incorporation costs |
21.970,00 |
21.970,00 |
9.416,00 |
|
II. Intangible fixed assets |
12.443.721,00 |
11.291.120,00 |
10.041.253,00 |
|
R & D expenses |
3.649.065,00 |
4.075.457,00 |
4.325.457,00 |
|
Concessions, patents, licences , trademarks |
|
|
|
|
Goodwill |
14.345.329,00 |
14.345.329,00 |
14.345.329,00 |
|
Acquired rights from finance leases |
|
|
|
|
Software |
227.942,00 |
228.616,00 |
237.363,00 |
|
Leasing |
|
|
|
|
Cash advance |
|
|
|
|
Provisions |
|
|
|
|
Depreciation |
-5.778.615,00 |
-7.358.282,00 |
-8.866.896,00 |
|
III. Tangible fixed assets |
1.035.795,00 |
806.564,00 |
622.568,00 |
|
Property, plant and equipment |
|
|
|
|
Machinery, equipment and other |
213.058,00 |
213.058,00 |
213.058,00 |
|
Other property plant and equipment |
1.615.653,00 |
1.615.653,00 |
1.619.429,00 |
|
Prepaid expenses on fixed assets |
|
|
|
|
Other assets |
662.232,00 |
676.696,00 |
704.746,00 |
|
Provisions |
|
|
|
|
Depreciation |
-1.455.148,00 |
-1.698.843,00 |
-1.914.665,00 |
|
IV. Financial fixed assets |
471.847,00 |
471.847,00 |
472.572,00 |
|
Shares in affiliated companies |
415.154,00 |
415.154,00 |
415.154,00 |
|
Receivables in affiliated companies |
38.206,00 |
38.206,00 |
38.206,00 |
|
Shares in associated companies |
|
|
|
|
Loans to associated companies |
|
|
|
|
Securities |
|
|
|
|
Other loans |
18.487,00 |
18.487,00 |
|
|
Long term deposits and guarantees |
|
|
19.212,00 |
|
Provisions |
|
|
|
|
Taxes receivable |
|
|
|
|
V.Owners equity |
|
|
|
|
VI.Long term trade liabilities |
|
|
|
|
C) DEFERRED EXPENSES |
56.167,00 |
43.624,00 |
5.611,00 |
|
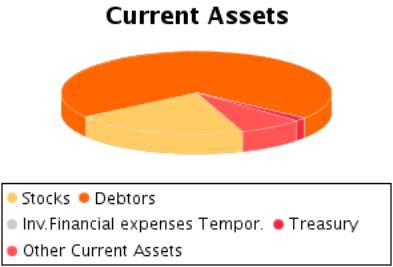
D) CURRENT ASSETS |
23.762.087,00 |
19.884.170,00 |
28.129.727,00 |
|
I. Shareholders by required outlays |
|
|
|
|
II. Stocks |
6.304.665,00 |
5.446.034,00 |
5.869.547,00 |
|
Goods available for sale |
|
|
|
|
Raw material inventory |
2.879.502,00 |
2.947.818,00 |
3.015.123,00 |
|
Work in Progress |
3.329.587,00 |
2.508.035,00 |
3.155.601,00 |
|
Finished goods |
|
|
|
|
Subproducts and recycled materials |
|
|
|
|
Cash advance |
106.693,00 |
1.298,00 |
122.440,00 |
|
Provisions |
-11.117,00 |
-11.117,00 |
-423.617,00 |
|
III. Debtors |
16.758.051,00 |
13.339.667,00 |
19.683.641,00 |
|
Clients |
10.398.196,00 |
7.709.758,00 |
12.270.649,00 |
|
Amounts owned by affiliated companies |
5.796.344,00 |
6.887.063,00 |
8.119.225,00 |
|
Amounts owned by associated companies |
|
|
|
|
Other debts |
1.499.764,00 |
1.697.950,00 |
1.866.899,00 |
|
Staff Expenses |
97.458,00 |
130.617,00 |
210.995,00 |
|
Government |
8.174,00 |
16.838,00 |
502.132,00 |
|
Provisions |
-1.041.885,00 |
-3.102.559,00 |
-3.286.259,00 |
|
IV. Temporary financial investment |
33.485,00 |
50.970,00 |
16.000,00 |
|
Shares in affiliated companies |
|
|
|
|
Receivables in affiliated companies |
|
|
|
|
Shares in associated companies |
|
|
|
|
Loans to associated companies |
33.485,00 |
50.970,00 |
|
|
Short term investment |
|
|
|
|
Other loans |
|
|
16.000,00 |
|
Short Term Deposit and guarantees |
|
|
|
|
Provisions |
|
|
|
|
V. Short-term own shares |
45.153,00 |
19.628,00 |
|
|
VI. Treasury |
620.733,00 |
1.027.871,00 |
388.885,00 |
|
VII. Periodification adjustments |
|
|
2.171.654,00 |
|
ASSETS (A + B + C + D) |
37.791.587,00 |
32.519.295,00 |
39.281.147,00 |
Assets composition
Liabilities
Figures given in €
|
|
31/12/2004 (12) |
31/12/2005 (12) |
31/12/2006 (12) |
|
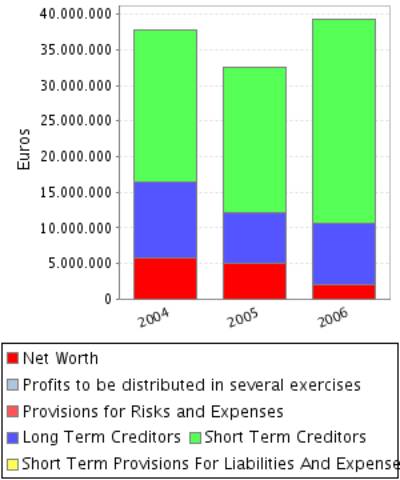
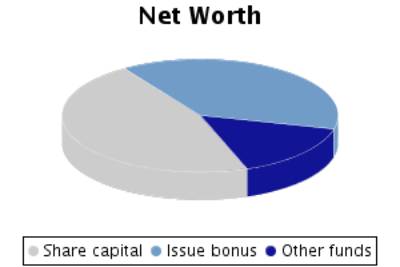
A) SHAREHOLDERS EQUITY |
5.773.918,00 |
4.943.144,00 |
1.953.556,00 |
|
I. Share capital |
4.203.927,00 |
6.111.912,00 |
6.111.912,00 |
|
II. Issue bonus |
3.936.154,00 |
5.028.169,00 |
5.028.169,00 |
|
III.Revaluation reserve |
|
|
|
|
IV.Reserves |
2.042.657,00 |
2.042.657,00 |
2.042.657,00 |
|
Retained earnings |
204.266,00 |
204.266,00 |
204.266,00 |
|
Sinking fund from owner equity |
|
|
|
|
Reserve for the parent company capital |
|
|
|
|
Statutory reserve |
|
|
|
|
Other funds |
1.838.391,00 |
1.838.391,00 |
1.838.391,00 |
|
Capital adjustments in Euros |
|
|
|
|
V.Results from previous years |
-3.995.258,00 |
-4.408.818,00 |
-8.239.594,00 |
|
Carry Over |
|
|
|
|
Prior years losses |
-3.995.258,00 |
-4.408.818,00 |
-8.239.594,00 |
|
Loans from partners for losses compensation |
|
|
|
|
VI.Profit and Losses |
-413.562,00 |
-3.830.776,00 |
-2.989.588,00 |
|
VII.Dividend paid during the year |
|
|
|
|
VIII.Own shares for capital reduction |
|
|
|
|
B) DEFERRED INCOME |
|
|
|
|
Capital grants |
|
|
|
|
Positive change difference |
|
|
|
|
Other deferred income |
|
|
|
|
Fiscal deferred income |
|
|
|
|
C) PROVISIONS FOR LIABILITIES AND EXPENSES |
|
|
|
|
Provision for pensions plans |
|
|
|
|
Provision for taxes |
|
|
|
|
Other provisions |
|
|
|
|
Reversion fund |
|
|
|
|
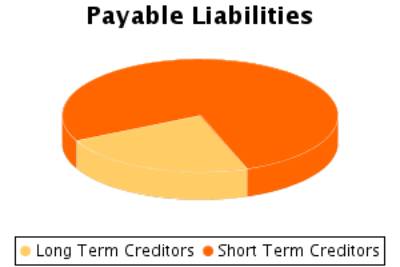
D) LONG TERM LIABILITIES |
10.713.196,00 |
7.196.725,00 |
8.681.125,00 |
|
I.Negotiable bonds and other negotiable values |
|
|
|
|
Non convertible securities |
|
|
|
|
Convertible securities |
|
|
|
|
Other convertible debentures |
|
|
|
|
II.Debt with bank entities |
3.227.519,00 |
3.822.969,00 |
3.386.377,00 |
|
Long term bank loans |
3.227.519,00 |
3.822.969,00 |
3.386.377,00 |
|
Leasing |
|
|
|
|
III.Debts with associated and affiliated
companies |
|
|
3.903.071,00 |
|
With affiliated companies |
|
|
3.903.071,00 |
|
Associated companies |
|
|
|
|
IV. Other creditors |
7.485.677,00 |
3.373.756,00 |
1.391.677,00 |
|
Bills payable |
|
|
|
|
Other debts |
7.485.677,00 |
3.373.756,00 |
1.391.677,00 |
|
Long term deposit and guaranties |
|
|
|
|
Taxes receivable |
|
|
|
|
V. Deferred debts on shares |
|
|
|
|
From affiliated companies |
|
|
|
|
From associated companies |
|
|
|
|
Other companies |
|
|
|
|
VI. Long term debt with creditor |
|
|
|
|
E) SHORT TERM LIABILITIES |
21.304.473,00 |
20.379.426,00 |
28.646.466,00 |
|
I.Negotiable bonds and other negotiable values |
|
|
|
|
Non convertible securities |
|
|
|
|
Convertible securities |
|
|
|
|
Other convertible debentures |
|
|
|
|
Interests from bonds |
|
|
|
|
II.Debt with bank entities |
7.235.506,00 |
5.880.589,00 |
9.682.045,00 |
|
Loans and other debts |
7.131.429,00 |
5.850.594,00 |
9.682.045,00 |
|
Debt interest |
104.077,00 |
29.995,00 |
|
|
Leasing |
|
|
|
|
III. Short term debts with associated and
affiliated companies |
1.281.928,00 |
1.427.759,00 |
11.728.919,00 |
|
With affiliated companies |
1.281.928,00 |
1.427.759,00 |
11.728.919,00 |
|
Associated companies |
|
|
|
|
IV. Commercial creditors |
10.699.552,00 |
10.531.101,00 |
5.099.995,00 |
|
Accounts payable |
680.916,00 |
2.382.481,00 |
1.651.898,00 |
|
Expenses |
10.018.636,00 |
8.148.620,00 |
3.448.097,00 |
|
Bills payable |
|
|
|
|
V. Other non-commercial debt |
2.075.022,00 |
2.527.512,00 |
2.126.254,00 |
|
Government |
1.504.622,00 |
2.108.224,00 |
1.861.264,00 |
|
Bills payable |
|
|
|
|
Other debts |
|
|
|
|
Accounts receivable |
570.400,00 |
419.288,00 |
264.990,00 |
|
Short term deposits and guarantees |
|
|
|
|
VI. Provisions for current assets |
|
|
|
|
VII. Periodification adjustments |
12.465,00 |
12.465,00 |
9.253,00 |
|
F) SHORT TERM PROVISIONS FOR LIABILITIES AND
EXPENSES |
|
|
|
|
LIABILITIES (A + B + C + D + E + F) |
37.791.587,00 |
32.519.295,00 |
39.281.147,00 |
Liabilities
Composition
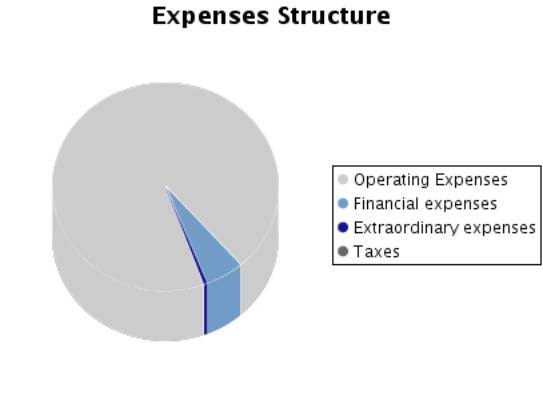
PROFIT AND LOSS ACCOUNT
Itams of the Profit and Loss Account
Figures given in €
|
|
31/12/2004 (12) |
31/12/2005 (12) |
31/12/2006 (12) |
|
A) EXPENSES (A.1 a A.16) |
32.020.627,00 |
22.089.240,00 |
27.809.777,00 |
|
A.1.Reduction in stocks of finished goods and
work in progress |
|
|
|
|
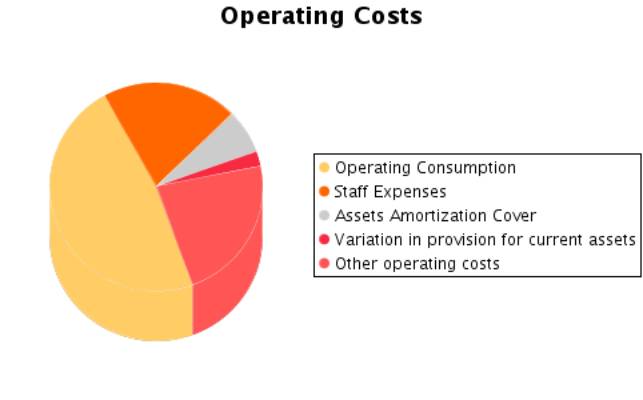
A.2.Supplies |
15.454.994,00 |
6.564.758,00 |
12.826.933,00 |
|
Material consumed |
|
|
|
|
Raw materials consumed |
15.454.994,00 |
6.564.758,00 |
12.826.933,00 |
|
Other expenses |
|
|
|
|
A.3. Labour cost |
7.197.169,00 |
5.404.081,00 |
5.267.990,00 |
|
Wages |
5.860.542,00 |
4.283.974,00 |
4.135.839,00 |
|
Social security expenses |
1.336.627,00 |
1.120.107,00 |
1.132.151,00 |
|
A.4. Assets depreciation |
1.773.911,00 |
1.823.362,00 |
1.736.990,00 |
|
A.5.Variance in the traffic provisions |
183.700,00 |
2.060.674,00 |
596.200,00 |
|
Variance in provision for inventory |
|
|
412.500,00 |
|
Variance in provision for bad debts |
183.700,00 |
2.060.674,00 |
183.700,00 |
|
Variance in provision for other current assets |
|
|
|
|
A.6. Other operating costs |
5.859.184,00 |
5.280.333,00 |
5.764.629,00 |
|
External costs |
5.847.953,00 |
5.246.266,00 |
5.750.055,00 |
|
Taxes |
11.231,00 |
34.067,00 |
14.574,00 |
|
Other day to day expenses |
|
|
|
|
Allowance to reversion fund |
|
|
|
|
A.I.OPERATING
RESULT (B.1+B.2+B.3+B.4-A.1-A.2-A.3-A.4-A.5-A.6) |
|
|
|
|
A.7.Financial expenses and similar |
1.299.097,00 |
521.470,00 |
1.176.819,00 |
|
Debts with related companies |
|
|
|
|
Debts with associated companies |
|
|
|
|
Other companies debts By debts with third parties and similar expenses |
1.299.097,00 |
521.470,00 |
1.176.819,00 |
|
Losses from financial investments |
|
|
|
|
A.8. Variation in financial investment provision |
140.090,00 |
72.661,00 |
|
|
A.9.Negative exchange difference |
|
|
305.141,00 |
|
A.II.POSITIVE
FINANCIAL RESULTS (B.5+B.6+B.7+B.8-A.7-A.8-A.9) |
|
|
|
|
A.III.PROFIT
FROM ORDINARY ACTIVITIES (A.I+A.II-B.I-B.II) |
|
|
|
|
A.10. Variation
in provision in fixed assets |
|
|
|
|
A.11. Losses in
fixed assets |
|
|
|
|
A.12. Losses
from own shares and bonds |
|
|
|
|
A.13.
Extraordinary charges |
112.482,00 |
361.901,00 |
135.075,00 |
|
A.14.Other
exercises’ expenses and losses |
|
|
|
|
A.IV.POSITIVE
EXTRAORDINARY RESULT (B.9+B.10+B.11+B.12+B.13-A.10-A.11-A.12-A.13-A.14) |
1.994.116,00 |
6.229.073,00 |
|
|
A.V.PROFIT
BEFORE TAXES (A.III+A.IV-B.III-B.IV) |
|
|
|
|
A.15.Corporate
Taxes |
|
|
|
|
A.16. Other
taxes |
|
|
|
|
A.VI.EXERCISE
RESULT (PROFIT) (A.V-A.14-A.15) |
|
|
|
|
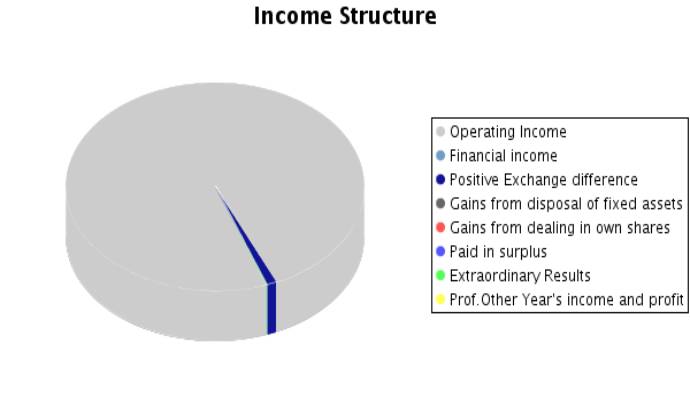
B) INCOMES (B.1
a B13) |
31.607.065,00 |
18.258.464,00 |
24.820.189,00 |
|
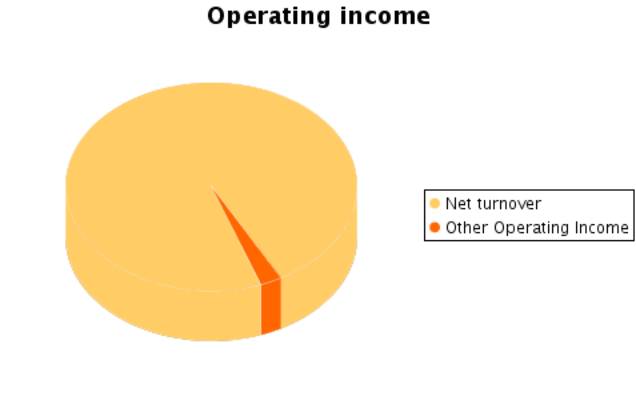
B.1. Turnover |
27.586.011,00 |
10.962.357,00 |
23.249.923,00 |
|
Sales |
27.586.011,00 |
10.962.357,00 |
23.249.923,00 |
|
Services provided |
|
|
|
|
Refunds and sale reminders |
|
|
|
|
B.2.Increase in inventory of finished goods and
works in progress |
884.726,00 |
|
714.872,00 |
|
B.3.Expenses capitalized |
612.000,00 |
426.392,00 |
250.000,00 |
|
B.4. Other operating income |
233.851,00 |
182.121,00 |
324.210,00 |
|
Other incomes |
225.467,00 |
182.121,00 |
324.210,00 |
|
Grants |
8.384,00 |
|
|
|
Excess in provision for liabilities and charges |
|
|
|
|
B.I.OPERATING LOSSES
(A.1+A.2+A.3+A.4+A.5+A.6-B.1-B.2-B.3-B.4) |
1.152.370,00 |
9.562.338,00 |
1.653.737,00 |
|
B.5.Incomes from share participations |
|
|
|
|
From affiliated companies |
|
|
|
|
From associated companies |
|
|
|
|
From other companies |
|
|
|
|
B.6.Income from other securities and credits to
fixed assets |
|
|
|
|
From affiliated companies |
|
|
|
|
From associated companies |
|
|
|
|
Other companies |
|
|
|
|
B.7.Other interests and similar |
19.354,00 |
1.474,00 |
|
|
From affiliated companies |
|
|
|
|
From associated companies |
|
|
|
|
Other Interests |
19.354,00 |
1.474,00 |
|
|
Profits from investments |
|
|
|
|
B.8. Positive change difference |
164.525,00 |
95.146,00 |
260.170,00 |
|
B.II. NEGATIVE FINANCIAL RESULTS
(A.7+A.8+A.9-B.5-B.6-B.7-B.8) |
1.255.308,00 |
497.511,00 |
1.221.790,00 |
|
B.III.LOSSES FROM ORDINARY ACTIVITIES
(B.I+B.II-A.I-A.II) |
2.407.678,00 |
10.059.849,00 |
2.875.527,00 |
|
B.9.B.9. Gains from disposal of fixed assets |
1.009,00 |
|
|
|
B.10.Gains from dealing in own shares |
|
|
|
|
B.11. Paid in surplus |
|
|
|
|
B.12. Extraordinary income |
2.105.589,00 |
6.590.974,00 |
21.014,00 |
|
B.13.Other year’s income and profits |
|
|
|
|
B.IV.NEGATIVE EXTRAORDINARY LOSSES
(A.10+A.11+A.12+A.13+A.14-B.9-B.10-B.11-B.12-B.13) |
|
|
114.061,00 |
|
B.V.LOSS BEFORE TAXES (B.III+B.IV-A.III-A.IV) |
413.562,00 |
3.830.776,00 |
2.989.588,00 |
|
B.VI.EXERCISE RESULTS (LOSS) (B.V+A.14+A.15) |
413.562,00 |
3.830.776,00 |
2.989.588,00 |
Composition of the
Profit and Loss Account
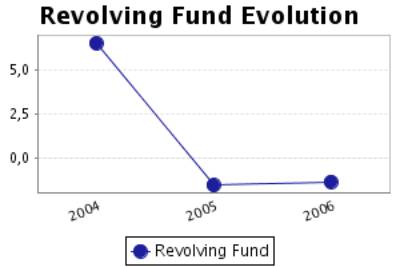
FINANCIAL BALANCE
Here the Main Capital Amounts of the company and the Revolving Fund
Evolution are analysed.
Financial Balance Table
Figures given in €
|
|
31/12/2004 (12) |
% |
31/12/2005 (12) |
% |
31/12/2006 (12) |
% |
|
A) DUE FROM
SHAREHOLDERS FOR UNCALLED CAPITAL |
|
|
|
|
|
|
|
B) FIXED ASSETS |
13.973.333,00 |
36,97 |
12.591.501,00 |
38,72 |
11.145.809,00 |
28,37 |
|
C) DEFERRED
EXPENSES |
56.167,00 |
0,15 |
43.624,00 |
0,13 |
5.611,00 |
0,01 |
|
D) CURRENT
ASSETS |
23.762.087,00 |
62,88 |
19.884.170,00 |
61,15 |
28.129.727,00 |
71,61 |
|
ASSETS (A + B +
C + D) |
37.791.587,00 |
|
32.519.295,00 |
|
39.281.147,00 |
|
|
|
||||||
|
A) SHAREHOLDERS
EQUITY |
5.773.918,00 |
15,28 |
4.943.144,00 |
15,20 |
1.953.556,00 |
4,97 |
|
B) DEFERRED
INCOME |
|
|
|
|
|
|
|
C) PROVISIONS
FOR LIABILITIES AND EXPENSES |
|
|
|
|
|
|
|
D) LONG TERM
LIABILITIES |
10.713.196,00 |
28,35 |
7.196.725,00 |
22,13 |
8.681.125,00 |
22,10 |
|
E) SHORT TERM
LIABILITIES |
21.304.473,00 |
56,37 |
20.379.426,00 |
62,67 |
28.646.466,00 |
72,93 |
|
F) SHORT TERM
PROVISIONS FOR LIABILITIES AND EXPENSES |
|
|
|
|
|
|
|
LIABILITIES (A +
B + C + D + E + F) |
37.791.587,00 |
|
32.519.295,00 |
|
39.281.147,00 |
|
Financial Balance
Composition
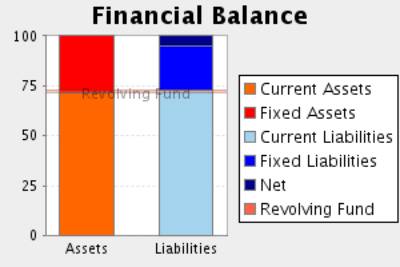
Comments on Financial Balance
In the 2004, the assets of the company were formed in 37,12% of Fixed
Assets and in 62,88% of Current Assets.This assets were financed in 15,28% with
own capitals, and in 28,35% with long term debt and in 56,37% with current
liabilities.
The result of this financial structure is a positive turnover fund of
2.457.614,00 Euros, which is equivalent to 6,50% proportion of the
company’s total assets.
In the 2005, the assets of the company were formed in 38,85% of Fixed
Assets and in 61,15% of Current Assets.This assets were financed in 15,20% with
own capitals, and in 22,13% with long term debt and in 62,67% with current
liabilities.
The result of this financial structure is a negative turnover fund of
-495.256,00 Euros, which is equivalent to -1,52% proportion of the company’s
total assets.
This measure has diminished with respect to the previous exercise in
120,15% having also diminished its proportion with respect to the total assets
of the company.
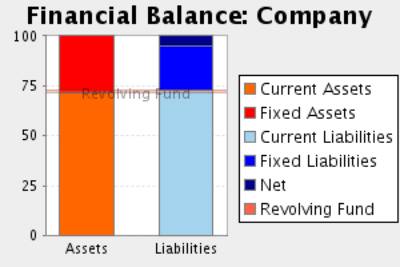
In the 2006, the assets of the company were formed in 28,39% of Fixed
Assets and in 71,61% of Current Assets.This assets were financed in 4,97% with
own capitals, and in 22,10% with long term debt and in 72,93% with current
liabilities.
The result of this financial structure is a negative turnover fund of
-516.739,00 Euros, which is equivalent to -1,32% proportion of the company’s
total assets.
This measure has diminished with respect to the previous exercise in
4,34% having, however, increased its proportion with respect to the total
assets of the company.
RATIOS
Main Ratios
|
|
31/12/2004 (12) |
31/12/2005 (12) |
31/12/2006 (12) |
|
STRUCTURAL RATIOS |
|
|
|
|
Management fund |
2.457.614,00 |
-495.256,00 |
-516.739,00 |
|
Management Fund Requirement |
8.993.749,00 |
4.286.864,00 |
8.760.421,00 |
|
Indebtedness (%) |
84,72 |
84,80 |
95,03 |
|
External Funds on Net Worth |
5,54 |
5,58 |
19,11 |
|
GENERAL ACTIVITY RATIO |
|
|
|
|
Turnover Increase (%) |
-7,07 |
-60,26 |
112,09 |
|
Added value growth (%) |
3,44 |
-103,43 |
2.268,85 |
|
Cash Flow |
1.684.139,00 |
125.921,00 |
-656.398,00 |
|
Labour Productivity |
1,11 |
-0,05 |
1,13 |
|
Assets turnover |
0,73 |
0,34 |
0,59 |
|
Breakdown Point |
30.795.516,92 |
33.672.766,62 |
27.188.085,19 |
|
Security Margin of the Breakdown Point (%) |
-8,31 |
-191,01 |
-14,12 |
|
ACTIVITY RATIOS |
|
|
|
|
Average Payment Period |
264 |
578 |
152 |
|
Average Collection Period |
219 |
438 |
305 |
|
Inventory Turnover Period |
82 |
179 |
91 |
|
SOLVENCY RATIOS |
|
|
|
|
Payback Capacity |
0,05 |
0,00 |
-0,02 |
|
Assets Guarantee |
1,18 |
1,18 |
1,05 |
|
Short Term Debts Proportion (%) |
66,54 |
73,90 |
76,74 |
|
Interest Coverage |
-1,26 |
-12,72 |
-1,40 |
|
LIQUIDITY RATIOS |
|
|
|
|
Current Ratio |
1,12 |
0,98 |
0,98 |
|
Immediate liquidity |
0,03 |
0,05 |
0,01 |
|
Treasury |
-6.581.288,00 |
-4.801.748,00 |
-9.277.160,00 |
|
Sales on Current Assets |
418 |
198 |
298 |
Results Analysis
Ratios
|
|
31/12/2004 (12) |
31/12/2005 (12) |
31/12/2006 (12) |
|
Economic profitability (%) |
-3,05 |
-29,40 |
-4,21 |
|
Operating Profitability (%) |
-4,18 |
-87,23 |
-7,11 |
|
Equity gearing |
13,68 |
6,92 |
34,96 |
|
Financial profitability (%) |
-7,16 |
-77,50 |
-153,03 |
|
General Profitability (%) |
-1,50 |
-34,94 |
-12,86 |
Comments on the
Results Analysis Ratios
The economic profitability in the year2005The economic profitability in
the year -29,40%, derived from a negative operating profitability of
-87,23%.The assets turnover was 0,34%.
The economic profitability in the year has worsen from -3,05% to the
current value, going deeper into the negative values. This evolution means a
dangerous situation for the company.This worsening has been mainly due to the
reduction in operating profitability, from -4,18% to the current value, going
deeper into the negative values. This evolution means a dangerous situation for
the company.-87,23% in spite of a fall in turnover from 0,73to its current
value of 0,34%.
Financial profitability on 2005The economic profitability in the year
-77,50
The company’s financial structure has restrained its financial
profitability with an indebtedness level of 6,92.
The general profitability on 2005The economic profitability in the year
-34,94
The economic profitability in the year2006The economic profitability in
the year -4,21%, derived from a negative operating profitability of -7,11%.The
assets turnover was 0,59%.
The economic profitability in the year has improved from -29,40% up to
the current value, in spite of remaining in negative. This improvement has been
mainly due to the variation in operating profitability, from -87,23% to the
current level of -7,11% having also increased assets turnover to0,34 and 0,59%.
Financial profitability on 2006The economic profitability in the year
-153,03
The company’s financial structure has restrained its financial
profitability with an indebtedness level of 34,96.
The general profitability on 2006The economic profitability in the year
-12,86
SECTORIAL ANÁLYSIS
Large Capital Amounts and Financial Balance
Figures given in %
|
|
COMPANY (2006) |
SECTOR |
DIFFERENCE |
DIFFERENCE RELATIVE |
|
|
|
|
|
|
ASSETS |
|
|
|
|
|
|
|
|
|
|
A) DUE FROM
SHAREHOLDERS FOR UNCALLED CAPITAL |
|
0,11 |
|
|
|
|
|
|
|
|
B) FIXED ASSETS |
28,37 |
29,21 |
-0,84 |
-2,89 |
|
|
|
|
|
|
C) DEFERRED
EXPENSES |
0,01 |
0,52 |
-0,50 |
-98,06 |
|
|
|
|
|
|
D) CURRENT
ASSETS |
71,61 |
70,16 |
1,45 |
2,07 |
|
|
|
|
|
|
ASSETS (A + B +
C + D) |
100 |
100 |
|
|
|
|
|
|
|
|
|
|
|
|
|
|
|
|
|
|
|
|
COMPANY (2006) |
SECTOR |
DIFFERENCE |
DIFFERENCE RELATIVE |
|
|
|
|
|
|
LIABILITIES |
|
|
|
|
|
|
|
|
|
|
A) SHAREHOLDERS
EQUITY |
4,97 |
41,68 |
-36,71 |
-88,08 |
|
|
|
|
|
|
B) DEFERRED INCOME |
|
0,48 |
|
|
|
|
|
|
|
|
C) PROVISIONS
FOR LIABILITIES AND EXPENSES |
|
0,52 |
|
|
|
|
|
|
|
|
D) LONG TERM
LIABILITIES |
22,10 |
10,67 |
11,43 |
107,05 |
|
|
|
|
|
|
E) SHORT TERM
LIABILITIES |
72,93 |
46,65 |
26,28 |
56,35 |
|
|
|
|
|
|
F) SHORT TERM
PROVISIONS FOR LIABILITIES AND EXPENSES |
|
0,00 |
|
|
|
|
|
|
|
|
LIABILITIES (A +
B + C + D + E + F) |
100 |
100 |
|
|
|
|
|
|
|
Sectorial Financial Balance
Comparison
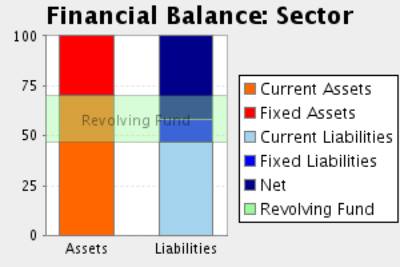
Comments to the Sectorial Analysis
In the 2006, the assets of the company were formed in 28,39% of fixed
assets and in 71,61Current Assets % In the sector, the proportion of fixed
assets was of 29,84%, 4,86% superior, and the proportion of current assets was
of 70,16%, 2,07% inferior.
The assets were financed in the company in 4,97% with own capitals , in
22,10% with fixed liabilities and in 72,93% with current liabilities In the
sector, the self financing represented 42,16%, 88,21% superior. On the other
hand the long term debts represented in the sector an average of 11,19%
financing, with a relative difference of 97,43% in favour of the companyAnd,
short term liabilities represented in the sector an average of 46,65%
financing, with a relative difference of 56,35% in favour of the company
The result of this company’s financial structure is a turnover fund that
represents -1,32% of the total assets; in the sector, this same proportion is
23,51%, therefore, we can say that the company’s turnover fund is 105,61%
smaller than the sector one.
Analytical Account of Results
Figures given in %
|
|
COMPANY (2006) |
SECTOR |
DIFFERENCE |
DIFFERENCE RELATIVE |
|
Turnover |
97,59 |
98,13 |
-0,54 |
-0,55 |
|
Other operating income |
2,41 |
1,87 |
0,54 |
29,01 |
|
Production Value |
100,00 |
100,00 |
0,00 |
0,00 |
|
Operating expenses |
50,84 |
56,74 |
-5,90 |
-10,40 |
|
Other operation expenses |
24,20 |
13,70 |
10,50 |
76,63 |
|
Added value |
24,96 |
29,56 |
-4,60 |
-15,56 |
|
Labour cost |
22,11 |
19,27 |
2,84 |
14,72 |
|
Gross Economic Result |
2,85 |
10,29 |
-7,44 |
-72,30 |
|
Assets depreciation |
7,29 |
3,38 |
3,91 |
115,55 |
|
Variation in provision for current assets and bad debt losses |
2,50 |
0,51 |
1,99 |
392,13 |
|
Net Economic Result |
-6,94 |
6,40 |
-13,34 |
-208,49 |
|
Financial income |
1,09 |
0,74 |
0,35 |
47,90 |
|
Financial Charges |
6,22 |
1,10 |
5,12 |
465,45 |
|
Variation in financial investment provision |
|
0,02 |
|
|
|
Ordinary
Activities Result |
-12,07 |
6,01 |
-18,08 |
-300,73 |
|
Extraordinary
income |
0,09 |
0,63 |
-0,54 |
-85,69 |
|
Extraordinary
charges |
0,57 |
0,49 |
0,08 |
17,28 |
|
Variation in
provision in fixed assets |
|
0,08 |
|
|
|
Results before
Taxes |
-12,55 |
6,08 |
-18,62 |
-306,58 |
|
Corporate taxes |
|
1,66 |
|
|
|
Net Result |
-12,55 |
4,42 |
-16,96 |
-384,26 |
|
Assets depreciation |
7,29 |
3,38 |
3,91 |
115,55 |
|
Change of Provisions |
2,50 |
0,61 |
1,89 |
309,84 |
|
Net Self-Financing |
-2,76 |
8,41 |
-11,17 |
-132,83 |
Main Ratios
|
|
COMPANY (2006) |
PTILE25 |
PTILE50 |
PTILE75 |
|
STRUCTURAL RATIOS |
|
|
|
|
|
Management fund |
-516.739,00 |
847,09 |
2.201,10 |
4.861,69 |
|
Management Fund
Requirement |
8.760.421,00 |
-1.546,50 |
-41,91 |
1.700,90 |
|
Indebtedness (%) |
95,03 |
46,55 |
60,24 |
73,43 |
|
External Funds
on Net Worth |
19,11 |
0,87 |
1,52 |
2,76 |
|
GENERAL ACTIVITY
RATIO |
|
|
|
|
|
Turnover Increase (%) |
112,09 |
-4,69 |
7,48 |
21,22 |
|
Added value growth (%) |
2.268,85 |
-5,78 |
4,96 |
22,37 |
|
Cash Flow |
-656.398,00 |
433,44 |
812,44 |
1.381,49 |
|
Labour Productivity |
1,13 |
1,24 |
1,47 |
1,82 |
|
Assets turnover |
0,59 |
0,85 |
1,10 |
1,42 |
|
Breakdown Point |
27.188.085,19 |
7.640.615,87 |
9.810.569,03 |
14.351.109,24 |
|
Security Margin of the Breakdown Point (%) |
-14,12 |
5,47 |
14,15 |
24,53 |
|
ACTIVITY RATIOS |
|
|
|
|
|
Average Payment Period |
152 |
105 |
150 |
216 |
|
Average Collection Period |
305 |
95 |
131 |
163 |
|
Inventory Turnover Period |
91 |
39 |
61 |
88 |
|
SOLVENCY RATIOS |
|
|
|
|
|
Payback Capacity |
-0,02 |
0,07 |
0,14 |
0,24 |
|
Assets Guarantee |
1,05 |
1,35 |
1,63 |
2,15 |
|
Short Term Debts Proportion (%) |
76,74 |
79,22 |
90,71 |
98,71 |
|
Interest Coverage |
-1,40 |
2,22 |
8,78 |
27,26 |
|
LIQUIDITY RATIOS |
|
|
|
|
|
Current Ratio |
0,98 |
1,16 |
1,45 |
1,94 |
|
Immediate liquidity |
0,01 |
0,05 |
0,19 |
0,50 |
|
Treasury |
-9.277.160,00 |
-1.377,23 |
141,15 |
1.818,74 |
|
Sales on Current Assets |
298 |
424 |
537 |
692 |
Results Analysis
Ratios
|
|
COMPANY (2006) |
PTILE25 |
PTILE50 |
PTILE75 |
|
Economic profitability (%) |
-4,21 |
2,58 |
5,15 |
10,16 |
|
Operating Profitability (%) |
-7,11 |
2,02 |
4,73 |
10,19 |
|
Equity gearing |
34,96 |
1,60 |
2,20 |
3,44 |
|
Financial profitability (%) |
-153,03 |
3,59 |
10,51 |
19,22 |
|
General Profitability (%) |
-12,86 |
1,23 |
3,60 |
7,34 |
NOTES
In spite of investigations using every
source available (public and private), no additional details than those contained
in this report are available.
FOREIGN EXCHANGE
RATES
|
Currency |
Unit
|
Indian Rupees |
|
US Dollar |
1 |
Rs.45.94 |
|
UK Pound |
1 |
Rs.82.84 |
|
Euro |
1 |
Rs.65.95 |
RATING
EXPLANATIONS
|
RATING |
STATUS |
PROPOSED CREDIT LINE |
|
|
>86 |
Aaa |
Possesses an extremely sound financial base with the strongest
capability for timely payment of interest and principal sums |
Unlimited |
|
71-85 |
Aa |
Possesses adequate working capital. No caution needed for credit transaction.
It has above average (strong) capability for payment of interest and
principal sums |
Large |
|
56-70 |
A |
Financial & operational base are regarded healthy. General unfavourable
factors will not cause fatal effect. Satisfactory capability for payment of
interest and principal sums |
Fairly Large |
|
41-55 |
Ba |
Overall operation is considered normal. Capable to meet normal
commitments. |
Satisfactory |
|
26-40 |
B |
Unfavourable & favourable factors carry similar weight in credit
consideration. Capability to overcome financial difficulties seems
comparatively below average. |
Small |
|
11-25 |
Ca |
Adverse factors are apparent. Repayment of interest and principal sums
in default or expected to be in default upon maturity |
Limited with
full security |
|
<10 |
C |
Absolute credit risk exists. Caution needed to be exercised |
Credit not
recommended |
|
NR |
In view of the lack of information, we have no basis upon which to
recommend credit dealings |
No Rating |
|
This score serves as a reference to assess SC’s credit risk
and to set the amount of credit to be extended. It is calculated from a composite
of weighted scores obtained from each of the major sections of this report. The
assessed factors and their relative weights (as indicated through %) are as
follows:
Financial
condition (40%) Ownership
background (20%) Payment
record (10%)
Credit history
(10%) Market trend
(10%) Operational
size (10%)