![]()
MIRA
INFORM REPORT
|
Report Date : |
16.09.2008 |
IDENTIFICATION
DETAILS
|
Name : |
ODEK GENERAL METALURGICA S.L. |
|
|
|
|
Registered Office : |
Street Can Sellares - Industrial Nord Este, 31 08740
Sant Andreu De La Barca Barcelona |
|
|
|
|
Country : |
Spain |
|
|
|
|
Financials (as on) : |
31.12.2006 |
|
|
|
|
Date of Incorporation : |
|
|
|
|
|
Legal Form : |
Limited Liability Company |
|
|
|
|
Line of Business : |
RATING &
COMMENTS
|
MIRA’s Rating : |
A |
|
RATING |
STATUS |
PROPOSED CREDIT LINE |
|
|
56-70 |
A |
Financial & operational base are regarded healthy. General
unfavourable factors will not cause fatal effect. Satisfactory capability for
payment of interest and principal sums |
Fairly Large |
|
Maximum Credit Limit : |
81.136,63 € |
|
|
|
|
Status : |
Good |
|
|
|
|
Payment Behaviour : |
Regular |
|
|
|
|
Litigation : |
Exists |
FINANCIAL REPORT
ODEK GENERAL METALURGICA S.L.
TAX NUMBER: B61873923
EXECUTIVE SUMMARY
Identification
Current Business Name: ODEK GENERAL
METALURGICA S.L.
Other names: NO
Current Address: STREET CAN
SELLARES - INDUSTRIAL NORD ESTE, 31, CP 08740, SANT ANDREU
DE LA BARCA BARCELONA
Telephone number: 902217000 Fax: 936822251
Commercial Risk
Credit Appraisal: 81.136,63 €
RAI: NO
Legal Actions: YES
Financial Information
Latest Balance sheet sales (2006): 1.942.871,20 € (MERCANTILE REGISTER)
Result: 178.537,05 €
Total Assets:
1.964.005,72 €
Social Capital: 1.500.000,00 €
Commercial Information
Constitution Date: 04/02/1999
Business activity: Wholesale of
other products
NACE Code: 5170
International Operations: Imports
Corporate Structure
Sole Administrator:
Parent Company:
Other Complementary Information
Latest proceeding published in BORME: 07/11/2007 Registration
of accounts
Bank Entities: Yes
Credit Appraisal
Maximum Credit
(from 0 a
6,000,000 €)
Favourable to 81.136,63 €
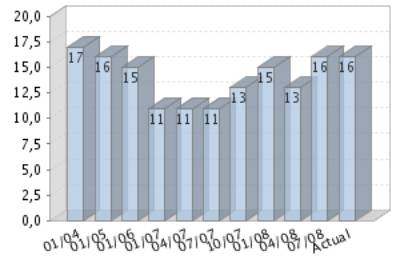
Rating Evolution
Financial Situation
Fiscal year2006
|
Treasury |
Excellent |
|
Indebtedness |
Average |
|
Profitability |
Sufficient |
|
Balance |
Excellent |
Performance
|
Legal Actions |
None or Negligible |
|
Business Trajectory |
Excellent |
RAI 
COMPANY NOT REGISTERED IN THE R.A.I.
This company is not registered in the Disputed Bills register (R.A.I.)
DATE AND TIME OF THE CONSULTATION: 03/09/2008
08:09:15
INCIDENTS

Summary
LEGAL ACTIONS: No legal incidences registered
|
CLAIM FILED
AGAINST THE ADMINISTRATION: 2 ( First: 01/09/2005, last:
24/03/2006 )With the Social Security: |
0 |
|
With the Tax
Authorities: |
0 |
|
With Other
Official bodies: |
2 |
AFFECTED BY: No significant element.
Last claim filed against the administration
Figures expressed in €
WITH OTHER OFFICIAL BODIES
2 claim(s)
Seizures
|
DATE |
ORGANIZATION |
AMOUNT |
|
24/03/2006 |
TOWN/ CITY HALL DE BARCELONA |
|
|
01/09/2005 |
TOWN/ CITY HALL DE BARCELONA |
|
FINANCIAL ELEMENTS AND SECTORIAL
COMPARATIVE
FINANCIAL ELEMENTS
Figures given in €
|
|
2004 (12) |
2005 (12) |
2006 (12) |
% ASSETS |
|
|
|
|
|
|
BALANCE SHEET
ANALYSIS |
|
|
|
|
|
|
|
|
|
|
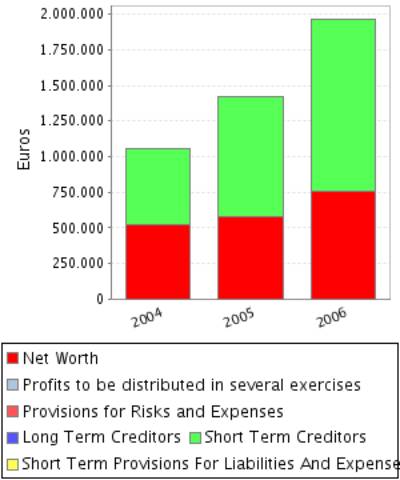
OWN FUNDS |
524.111,20 |
574.032,70 |
752.569,75 |
38,32 |
|
|
|
|
|
|
DEBT |
533.407,60 |
845.492,90 |
1.211.435,97 |
61,68 |
|
|
|
|
|
|
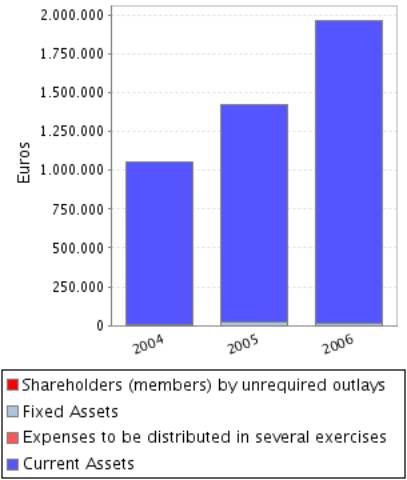
FIXED ASSETS |
7.749,46 |
21.267,65 |
18.535,37 |
0,94 |
|
|
|
|
|
|
TOTAL ASSETS |
1.057.518,80 |
1.419.525,60 |
1.964.005,72 |
|
|
|
|
|
|
|
|
|
|
|
|
|
|
|
|
|
|
|
2004 (12) |
2005 (12) |
2006 (12) |
% SALES |
|
|
|
|
|
|
PROFIT AND LOSS
ACCOUNT ANALYSIS |
|
|
|
|
|
|
|
|
|
|
SALES |
1.347.376,89 |
1.480.596,36 |
1.942.871,20 |
|
|
|
|
|
|
|
ADDED VALUE |
256.763,20 |
150.445,91 |
370.295,91 |
19,06 |
|
|
|
|
|
|
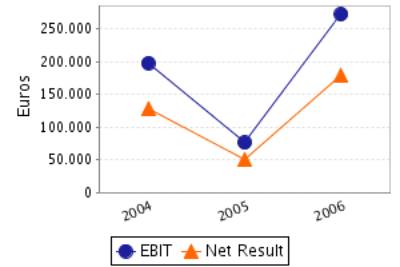
EBITDA |
202.683,43 |
78.961,31 |
272.822,23 |
14,04 |
|
|
|
|
|
|
EBIT |
197.562,65 |
75.866,36 |
272.055,45 |
14,00 |
|
|
|
|
|
|
NET RESULT |
128.439,00 |
49.921,50 |
178.537,05 |
9,19 |
|
|
|
|
|
Balance Sheets Items
Analysis
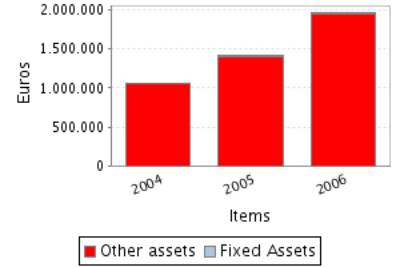
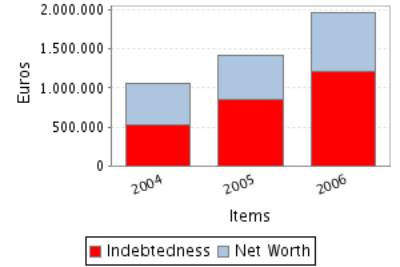
Balance Sheet Comments
Total assets of the company grew 34,23% between 2004 and 2005.
This growth is a consequence of the fixed assets increase of 174,44%.
This growth has been mainly financed with a debt increase of 58,51%.
Nevertheless the net worth increased 9,52%.
Total assets of the company grew 38,36% between 2005 and 2006.
In spite of the assets’ growth, the fixed assets decreased 12,85%.
This growth has been mainly financed with a debt increase of 43,28%.
Nevertheless the net worth increased 31,10%.
Profit and Loss Account Analysis
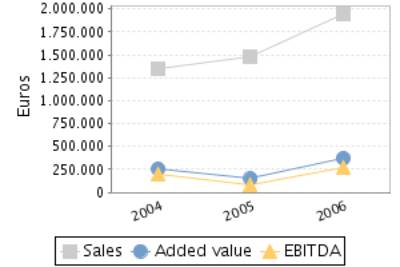
Profit and Loss Account Comments
The company’s sales figure grew 9,89% between 2004 and 2005.
The company’s EBIT decreased in 61,60% between 2004 and 2005.
This evolution implies a reduction in the company’s operating
profitability.
The result of these variations is a decrease of the company’s Economic
Profitability of 71,39% in the analysed period, being this profitability of
5,34% in the year 2005.
The company’s Net Result decreased in 61,13% between 2004 and 2005.
This evolution, compared to the EBIT’s performance, implies that the
financial and extraordinary activities have had a positive effect in the
company’s Financial Profitability.
The result of these variations is a reduction of the company’s
profitability of 64,51% in the analysed period, being equal to 8,70% in the
year 2005.
The company’s sales figure grew 31,22% between 2005 and 2006.
The company’s EBIT grew 258,60% between 2005 and 2006.
This evolution implies an increase in the company’s operating
profitability.
The result of these variations is an increase of the company’s Economic
Profitability of 159,18% in the analysed period, being this profitability of
13,85% in the year 2006.
The company’s Net Result grew 257,64% between 2005 and 2006.
This evolution, compared to the EBIT’s performance, implies that the
financial and extraordinary activities have had a negative effect in the
company’s Financial Profitability.
The result of these variations is an increase of the company’s Economic
Profitability of 172,79% in the analysed period, being equal to 23,72% in the
year 2006.
ANNUAL FINANCIAL REPORT ADDITIONAL DATA
Source: annual financial report 2006
Results Distribution
Figures given in €
|
DISTRIBUTION
BASE |
DISTRIBUTION TO |
||
|
Profit and Loss |
178.537,05 |
Retained earnings |
17.853,70 |
|
Carry Over |
0,00 |
Voluntary Reserve |
160.683,35 |
|
Voluntary reserves |
0,00 |
Prior years losses |
0,00 |
|
Reserves |
0,00 |
Carry Over |
0,00 |
|
Other concepts |
0,00 |
Other funds |
0,00 |
|
Total of Amounts to be distributed |
178.537,05 |
Dividends |
0,00 |
|
|
|
Other Applications |
0,00 |
COMPARATIVE SECTOR
ANALYSIS
Values table
Figures expressed in %
|
|
COMPANY (2006) |
SECTOR |
DIFFERENCE |
DIFFERENCE RELATIVE |
|
|
|
|
|
|
BALANCE SHEET
ANALYSIS: % on the total assets |
|
|
|
|
|
|
|
|
|
|
OWN FUNDS |
38,32 |
36,96 |
1,36 |
3,68 |
|
|
|
|
|
|
DEBT |
61,68 |
63,04 |
-1,36 |
-2,16 |
|
|
|
|
|
|
FIXED ASSETS |
0,94 |
28,79 |
-27,84 |
-96,72 |
|
|
|
|
|
|
|
|
|
|
|
|
|
|
|
|
|
|
COMPANY (2006) |
SECTOR |
DIFFERENCE |
DIFFERENCE RELATIVE |
|
|
|
|
|
|
PROFIT AND LOSS
ACCOUNT ANALYSIS: % on the total operating income |
|
|
|
|
|
|
|
|
|
|
SALES |
99,24 |
98,68 |
0,56 |
0,57 |
|
|
|
|
|
|
ADDED VALUE |
18,91 |
21,48 |
-2,56 |
-11,93 |
|
|
|
|
|
|
EBIT |
13,90 |
4,52 |
9,38 |
207,77 |
|
|
|
|
|
|
NET RESULT |
9,12 |
2,84 |
6,28 |
221,32 |
|
|
|
|
|
Sector Composition
Compared sector (NACE): 517
Number of companies: 2003
Size (Sales Figure) : 0 - 2.800.000,00
Euros
Comments on the sectorial comparative
Compared to its
sector the assets of the companies show an inferior proportion of fixed assets.
Specifically the difference with the sector average is -27,84% , which means a
relative difference of -96,72% .
In liabilities
composition the company appeals on a wider scale to self financing, being the
proportion of net worth of 1,36% superior, which means a relative difference of
3,68% . As a consequence, external financing sources are less used by the
company in 1,36% less than the sector, which means a difference of 2,16% .
The proportion
that the sales mean to the company’s total ordinary income is 99,24%, 0,56%
higher than in the sector, which means a relative difference of 0,57% .
The company’s EBIT
was positive and was 13,90% with regard to the total ordinary income, 9,38%
higher than in the sector, which means a relative difference of 207,77% .
The company’s
capacity to generate operating income is higher than the one of the sector as
its ratio EBIT/Sales is higher (ES Company versus ES Sector).
The company’s net
result was positive and equal to 9,12% with regard to the total ordinary
income, 6,28% higher than in the sector, which means a relative difference of
221,32% .
The financial and extraordinary results and
the tax impact have had a less negative impact on the Net result in the company
than in the sector; as a consequence, the company shows a better Net
Result/EBIT ratio (REBEmpresa vs. REBSector).
ADDRESSES
Current Legal Seat Address:
STREET CAN SELLARES - INDUSTRIAL NORD ESTE, 31
08740 SANT ANDREU DE LA BARCA BARCELONA
Previous Seat Address:
STREET TRAVESSERA DE LES CORTS, 322
08029
BARCELONA
Characteristics
of the current address
Type of premises: office
Property: rented
Local Situation: main
CORPORATE STRUCTURE
ADMINISTRATIVE LINKS
Main Board members, Directors and Auditor ![]()
|
POSITION |
SURNAMES AND
NAME |
APPOINTMENT DATE |
|
SOLE ADMINISTRATOR |
ASENS REBOLLO JOSE |
15/04/1999 |
FINANCIAL LINKS
|
|
BUSINESS NAME |
CIF / COUNTRY |
% |
SOURCE |
DATA INF. |
|
|
SIRVEX S A |
A08396830 |
100,00 |
TRADE REG. |
31/12/2006 |
CREDIT INFORMATION
Constitution Date: 04/02/1999
Business activity 
Activity: Wholesale of other products
NACE Code: 5170
NACE Activity: Other wholesale
Business: LA IMPORTACION Y
EXPORTACION, COMERCIALIZACION Y VENTA AL MAYOR DE ACCESORIOS PARA USO
INDUSTRIAL.
COMMERCIAL OPERATIONS 
PURCHASES
Payments (estimated):
Import Percentage: 80%
Imports from: CEE
SALES
Collection (estimated):
Regional Distribution: 100%
Banks 
|
ENTITY |
BRANCH |
ADDRESS |
TOWN OR CITY |
PROVINCE |
|
BANCO ESPAÑOL DE
CREDITO, S.A. |
2550 |
CL GRAN VIA DE
LES CORTS CATALANES 583 E |
BARCELONA |
Barcelona |
1 bank entities registered
Brands, Signs and Commercial
Names 
Brand name: INOX.POINT (Valid)
Type: DENOMINATIVE Date: 25/05/2005
LEGAL STRUCTURE
Constitution Data
Register Date: 04/02/1999
Register town: Barcelona
Announcement number: 136417
Legal form: LIMITED LIABILITY
COMPANY
Social Capital: 6.010,12 €
Current Legal Form: LIMITED LIABILITY
COMPANY
Current Capital:
1.500.000,00 €
Legal Aspects
Obligation to fill in Financial Statements: YES
Chamber census: YES (2006)
Listed on a Stock Exchange: NO
B.O.R.M.E.(Official Companies Registry Gazette) ![]()
Registered Proceedings
|
PROCEEDINGS |
DATE |
NOTICE NUM. |
TRADE REG. |
|
Capital increase |
20/09/2007 |
479360 |
Barcelona |
|
Change of address |
24/12/2004 |
535086 |
Barcelona |
Other Proceedings published
|
PROCEEDINGS |
DATE |
NOTICE NUM. |
TRADE REG. |
|
Registration of
accounts (2006) Individual |
07/11/2007 |
985200 |
Barcelona |
|
Registration of
accounts (2005) Individual |
11/12/2006 |
983569 |
Barcelona |
|
Registration of
accounts (2004) Individual |
04/10/2005 |
654322 |
Barcelona |
FINANCIAL INFORMATION
The information on the last account contained in this report is extracted
from the Mercantile Register file of the legal address of the Company and
dated 07/10/2007.
BALANCE SHEET
Assets
Figures given in €
|
|
31/12/2004 (12) |
31/12/2005 (12) |
31/12/2006 (12) |
|
A) DUE FROM SHAREHOLDERS FOR UNCALLED CAPITAL |
|
|
|
|
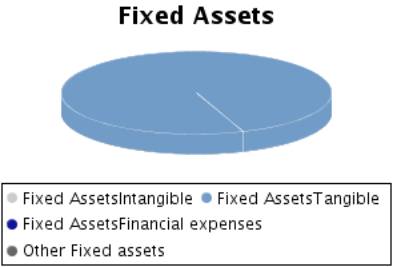
B) FIXED ASSETS |
7.749,46 |
21.267,65 |
18.535,37 |
|
I. Incorporation costs |
|
|
|
|
II. Intangible fixed assets |
|
|
|
|
III. Tangible fixed assets |
7.749,46 |
21.267,65 |
18.535,37 |
|
IV. Financial fixed assets |
|
|
|
|
V.Owners equity |
|
|
|
|
VI.Long term trade liabilities |
|
|
|
|
C) DEFERRED EXPENSES |
|
|
|
|
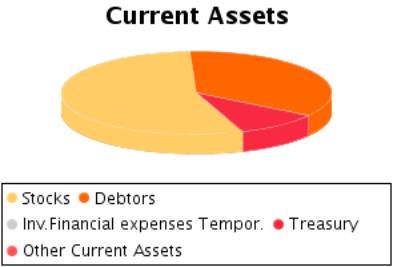
D) CURRENT ASSETS |
1.049.769,34 |
1.398.257,95 |
1.945.470,35 |
|
I. Shareholders by required outlays |
|
|
|
|
II. Stocks |
443.019,80 |
745.600,00 |
1.065.950,42 |
|
III. Debtors |
375.314,11 |
463.451,58 |
683.641,50 |
|
IV. Temporary financial investment |
|
|
|
|
V. Short-term own shares |
|
|
|
|
VI. Treasury |
231.435,43 |
189.206,37 |
195.878,43 |
|
VII. Periodification adjustments |
|
|
|
|
ASSETS (A + B + C + D) |
1.057.518,80 |
1.419.525,60 |
1.964.005,72 |
Assets composition
Liabilities
Figures given in €
|
|
31/12/2004 (12) |
31/12/2005 (12) |
31/12/2006 (12) |
|
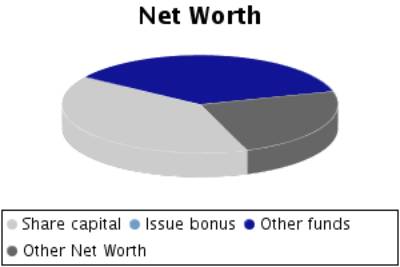
A) SHAREHOLDERS EQUITY |
524.111,20 |
574.032,70 |
752.569,75 |
|
I. Share capital |
300.000,00 |
300.000,00 |
300.000,00 |
|
II. Issue bonus |
|
|
|
|
III.Revaluation reserve |
|
|
|
|
IV.Reserves |
95.672,20 |
224.111,20 |
274.032,70 |
|
Capital adjustments in Euros |
0,12 |
0,12 |
0,12 |
|
Sundry reserves |
95.672,08 |
224.111,08 |
274.032,58 |
|
V.Results from previous years |
|
|
|
|
VI.Profit and Losses |
128.439,00 |
49.921,50 |
178.537,05 |
|
VII.Dividend paid during the year |
|
|
|
|
VIII.Own shares for capital reduction |
|
|
|
|
B) DEFERRED INCOME |
|
|
|
|
C) PROVISIONS FOR LIABILITIES AND EXPENSES |
|
|
|
|
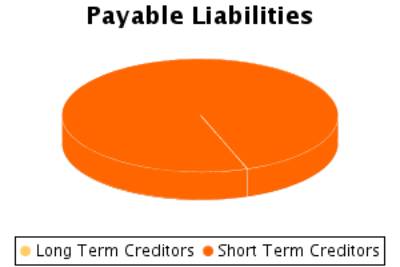
D) LONG TERM LIABILITIES |
|
|
|
|
E) SHORT TERM LIABILITIES |
533.407,60 |
845.492,90 |
1.211.435,97 |
|
F) SHORT TERM PROVISIONS FOR LIABILITIES AND
EXPENSES |
|
|
|
|
LIABILITIES (A + B + C + D + E + F) |
1.057.518,80 |
1.419.525,60 |
1.964.005,72 |
Liabilities
Composition
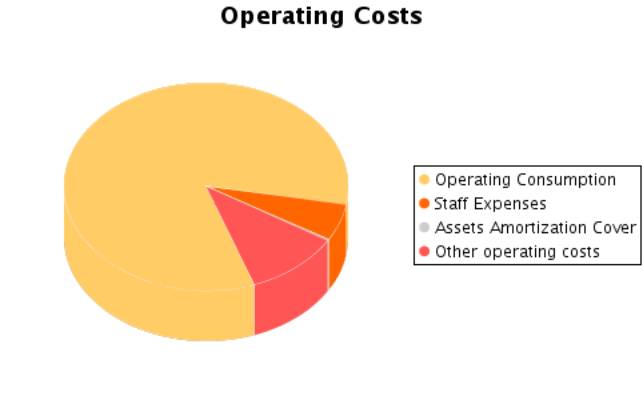
PROFIT AND LOSS ACCOUNT
Itams of the Profit and Loss Account
Figures given in €
|
|
31/12/2004 (12) |
31/12/2005 (12) |
31/12/2006 (12) |
|
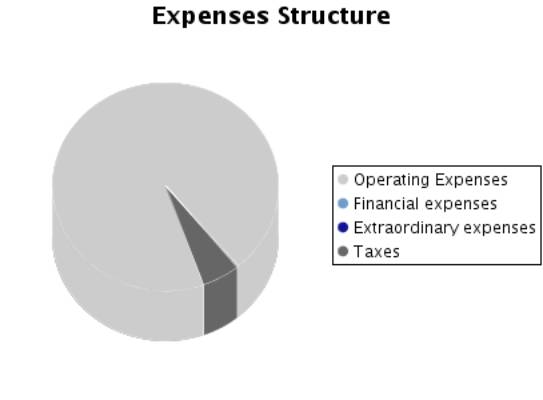
A) EXPENSES (A.1 a A.15) |
1.231.098,21 |
1.445.757,12 |
1.784.050,50 |
|
A.1.Operating costs |
999.127,12 |
1.196.347,39 |
1.405.173,12 |
|
A.2. Labour cost |
54.079,77 |
71.484,60 |
97.473,68 |
|
Wages |
43.410,68 |
55.331,63 |
75.964,70 |
|
Social security expenses |
10.669,09 |
16.152,97 |
21.508,98 |
|
A.3. Assets depreciation |
1.032,20 |
1.647,51 |
2.732,28 |
|
A.4. Variation in provision for current assets |
4.088,58 |
1.447,44 |
-1.965,50 |
|
A.5. Other operating costs |
102.259,05 |
146.123,27 |
182.368,48 |
|
A.I. OPERATING RESULT (B.1-A.1-A.2-A.3-A.4-A.5) |
197.562,65 |
75.866,36 |
272.055,45 |
|
A.6.Financial expenses and similar |
1.181,15 |
1.819,27 |
2.126,37 |
|
Debts with related companies |
|
|
|
|
Debts with associated companies |
|
|
|
|
Other companies debts By debts with third parties and similar expenses |
1.181,15 |
1.819,27 |
2.126,37 |
|
Losses from financial investments |
|
|
|
|
A.7. Variation
in financial investment provision |
|
|
|
|
A.8.Negative exchange difference |
|
0,13 |
0,01 |
|
A.II.POSITIVE
FINANCIAL RESULTS (B.2+B.3-A.6-A.7-A.8) |
194,22 |
891,70 |
2.621,54 |
|
A.III.PROFIT
FROM ORDINARY ACTIVITIES (A.I+A.II-B.I-B.II) |
197.756,87 |
76.758,06 |
274.676,99 |
|
A.9. Variation in
provision in fixed assets |
|
|
|
|
A.10. Losses in fixed assets |
|
|
|
|
A.11. Losses from own shares and bonds |
|
|
|
|
A.12. Extraordinary charges |
170,88 |
6,70 |
6,73 |
|
A.13.Other
exercises’ expenses and losses |
|
|
|
|
A.IV.POSITIVE EXTRAORDINARY
RESULT (B.4+B.5+B.6+B.7+B.8-A.9-A.10-A.11-A.12-A.13) |
|
44,25 |
|
|
A.V.PROFIT
BEFORE TAXES (A.III+A.IV-B.III-B.IV) |
197.598,46 |
76.802,31 |
274.672,38 |
|
A.14.Corporate
Taxes |
69.159,46 |
26.880,81 |
96.135,33 |
|
A.15. Other
taxes |
|
|
|
|
A.VI.EXERCISE
RESULT (PROFIT) (A.V-A.14-A.15) |
128.439,00 |
49.921,50 |
178.537,05 |
|
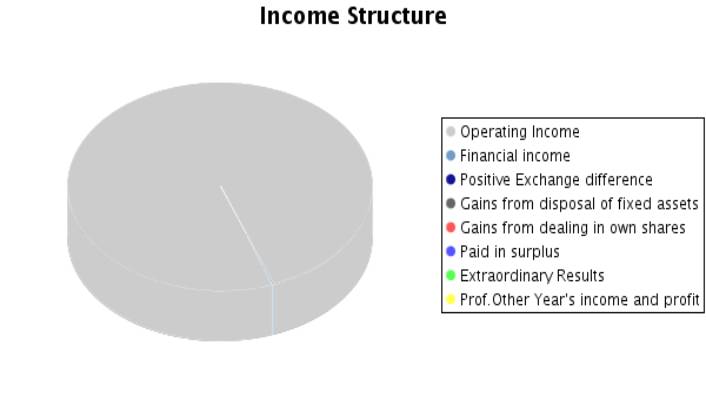
B) INCOMES (B.1
a B.8) |
1.359.537,21 |
1.495.678,62 |
1.962.587,55 |
|
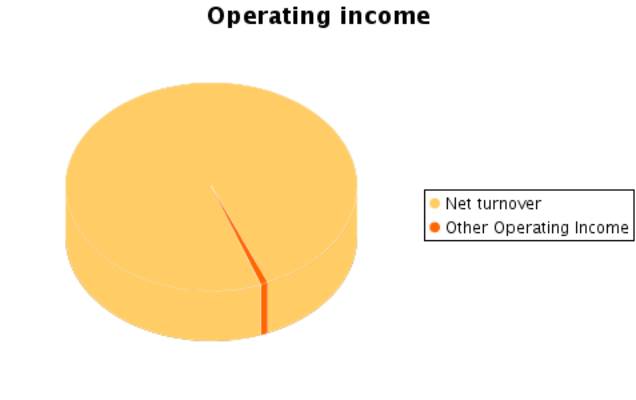
B.1.Operating
income |
1.358.149,37 |
1.492.916,57 |
1.957.837,51 |
|
Turnover |
1.347.376,89 |
1.480.596,36 |
1.942.871,20 |
|
Other operating
income |
10.772,48 |
12.320,21 |
14.966,31 |
|
B.I.OPERATING
LOSSES (A.1+A.2+A.3+A.4+A.5-B.1) |
|
|
|
|
B.2.Financial
Income |
1.375,37 |
2.711,10 |
4.747,92 |
|
From affiliated
companies |
|
|
|
|
From associated
companies |
|
|
|
|
Other |
1.375,37 |
2.711,10 |
4.747,92 |
|
Gains from investments |
|
|
|
|
B.3. Positive change difference |
|
|
|
|
B.II. NEGATIVE FINANCIAL RESULTS
(A.6+A.7+A.8-B.2-B.3) |
|
|
|
|
B.III.LOSSES FROM
ORDINARY ACTIVITIES (B.I+B.II-A.I-A.II) |
|
|
|
|
B.4.B.9. Gains
from disposal of fixed assets |
|
|
|
|
B.5.Gains from
dealing in own shares |
|
|
|
|
B.6. Paid in
surplus |
|
|
|
|
B.7.
Extraordinary income |
12,47 |
50,95 |
2,12 |
|
B.8.Other year’s
income and profits |
|
|
|
|
B.IV.NEGATIVE
EXTRAORDINARY LOSSES (A.9+A.10+A.11+A.12+A.13-B.4-B.5-B.6-B.7-B.8) |
158,41 |
|
4,61 |
|
B.V.LOSS BEFORE
TAXES (B.III+B.IV-A.III-A.IV) |
|
|
|
|
B.VI.EXERCISE
RESULTS (LOSS) (B.V+A.14+A.15) |
|
|
|
Composition of the
Profit and Loss Account
FINANCIAL BALANCE
Here the Main Capital Amounts of the company and the Revolving Fund
Evolution are analysed.
Financial Balance Table
Figures given in €
|
|
31/12/2004 (12) |
% |
31/12/2005 (12) |
% |
31/12/2006 (12) |
% |
|
A) DUE FROM
SHAREHOLDERS FOR UNCALLED CAPITAL |
|
|
|
|
|
|
|
B) FIXED ASSETS |
7.749,46 |
0,73 |
21.267,65 |
1,50 |
18.535,37 |
0,94 |
|
C) DEFERRED EXPENSES |
|
|
|
|
|
|
|
D) CURRENT
ASSETS |
1.049.769,34 |
99,27 |
1.398.257,95 |
98,50 |
1.945.470,35 |
99,06 |
|
ASSETS (A + B +
C + D) |
1.057.518,80 |
|
1.419.525,60 |
|
1.964.005,72 |
|
|
|
||||||
|
A) SHAREHOLDERS
EQUITY |
524.111,20 |
49,56 |
574.032,70 |
40,44 |
752.569,75 |
38,32 |
|
B) DEFERRED
INCOME |
|
|
|
|
|
|
|
C) PROVISIONS
FOR LIABILITIES AND EXPENSES |
|
|
|
|
|
|
|
D) LONG TERM
LIABILITIES |
|
|
|
|
|
|
|
E) SHORT TERM
LIABILITIES |
533.407,60 |
50,44 |
845.492,90 |
59,56 |
1.211.435,97 |
61,68 |
|
F) SHORT TERM
PROVISIONS FOR LIABILITIES AND EXPENSES |
|
|
|
|
|
|
|
LIABILITIES (A +
B + C + D + E + F) |
1.057.518,80 |
|
1.419.525,60 |
|
1.964.005,72 |
|
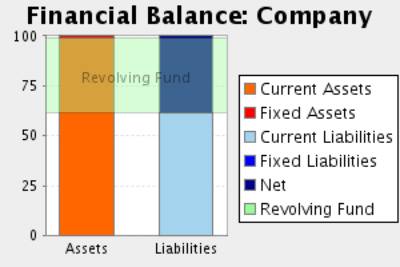
Financial Balance
Composition
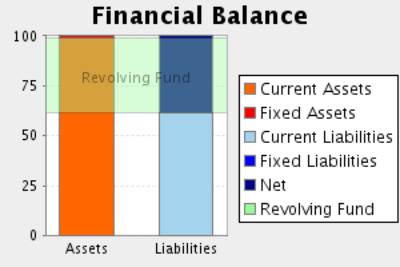
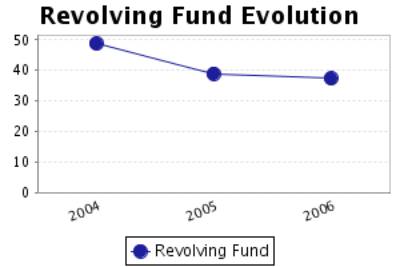
Comments on Financial Balance
In the 2004, the assets of the company were formed in 0,73% of Fixed
Assets and in 99,27% of Current Assets.This assets were financed in 49,56% with
own capitals and in 50,44% with current liabilities.
The result of this financial structure is a positive turnover fund of
516.361,74 Euros, which is equivalent to 48,83% proportion of the
company’s total assets.
In the 2005, the assets of the company were formed in 1,50% of Fixed
Assets and in 98,50% of Current Assets.This assets were financed in 40,44% with
own capitals and in 59,56% with current liabilities.
The result of this financial structure is a positive turnover fund of
552.765,05 Euros, which is equivalent to 38,94% proportion of the
company’s total assets.
This measure has increased with respect to the previous exercise in
7,05% having, however, diminished its proportion with respect to the total
assets of the company.
In the 2006, the assets of the company were formed in 0,94% of Fixed
Assets and in 99,06% of Current Assets.This assets were financed in 38,32% with
own capitals and in 61,68% with current liabilities.
The result of this financial structure is a positive turnover fund of
734.034,38 Euros, which is equivalent to 37,37% proportion of the
company’s total assets.
This measure has increased with respect to the previous exercise in
32,79% having, however, diminished its proportion with respect to the total
assets of the company.
RATIOS
Main Ratios
|
|
31/12/2004 (12) |
31/12/2005 (12) |
31/12/2006 (12) |
|
STRUCTURAL RATIOS |
|
|
|
|
Management fund |
516.361,74 |
552.765,05 |
734.034,38 |
|
Indebtedness (%) |
50,44 |
59,56 |
61,68 |
|
External Funds on Net Worth |
1,02 |
1,47 |
1,61 |
|
GENERAL ACTIVITY RATIO |
|
|
|
|
Turnover Increase (%) |
80,30 |
9,89 |
31,22 |
|
Added value growth (%) |
163,63 |
-41,41 |
146,13 |
|
Cash Flow |
133.559,78 |
53.016,45 |
179.303,83 |
|
Labour Productivity |
4,75 |
2,10 |
3,80 |
|
Assets turnover |
1,27 |
1,04 |
0,99 |
|
Breakdown Point |
610.787,36 |
1.111.008,56 |
994.069,31 |
|
Security Margin of the Breakdown Point (%) |
55,03 |
25,58 |
49,23 |
|
ACTIVITY RATIOS |
|
|
|
|
Average Collection Period |
100 |
113 |
127 |
|
Inventory Turnover Period |
118 |
181 |
198 |
|
SOLVENCY RATIOS |
|
|
|
|
Payback Capacity |
0,25 |
0,06 |
0,15 |
|
Assets Guarantee |
1,98 |
1,68 |
1,62 |
|
Short Term Debts Proportion (%) |
100,00 |
100,00 |
100,00 |
|
Interest Coverage |
111,90 |
27,62 |
82,09 |
|
LIQUIDITY RATIOS |
|
|
|
|
Current Ratio |
1,97 |
1,65 |
1,61 |
|
Immediate liquidity |
0,43 |
0,22 |
0,16 |
|
Sales on Current Assets |
462 |
381 |
360 |
Results Analysis
Ratios
|
|
31/12/2004 (12) |
31/12/2005 (12) |
31/12/2006 (12) |
|
Economic profitability (%) |
18,68 |
5,34 |
13,85 |
|
Operating Profitability (%) |
14,66 |
5,12 |
14,00 |
|
Equity gearing |
2,02 |
2,50 |
2,64 |
|
Financial profitability (%) |
24,51 |
8,70 |
23,72 |
|
General Profitability (%) |
9,53 |
3,37 |
9,19 |
Comments on the
Results Analysis Ratios
The economic
profitability in the year2005 achieved a 5,34% positive level, due to a 5,12%
economic margin and to an assets turnover of1,04%.
The economic
profitability in the year has reduced from 18,68% up to 5,34% of2005, even if it
remains positive. This fall is due to the decrease in operating profitability,
that has passe from 14,66% to 5,12%, as assets turnover whose index has passed
from 1,27 to 1,04%.
Financial
profitability on 2005 achieved a 8,70%.
The company’s
financial structure has instigated its economic profitability with an
indebtedness level of 2,50.
The general
profitability on 2005 achieved a 3,37%.
The economic
profitability in the year2006 achieved a 13,85% positive level, due to a 14,00%
economic margin and to an assets turnover of0,99%.
The economic
profitability in the year has increased from 5,34% up to 13,85%. This growth is
due to the economic margin increase, from 5,12% to the current 14,00% in spite
of the assets turnover drop, which have decreased from 1,04 to 0,99%.
Financial
profitability on 2006 achieved a 23,72%.
The company’s
financial structure has instigated its economic profitability with an
indebtedness level of 2,64.
The general profitability on 2006 achieved a
9,19%.
SECTORIAL ANÁLYSIS
Large Capital Amounts and Financial Balance
Figures given in %
|
|
COMPANY (2006) |
SECTOR |
DIFFERENCE |
DIFFERENCE RELATIVE |
|
|
|
|
|
|
ASSETS |
|
|
|
|
|
|
|
|
|
|
A) DUE FROM
SHAREHOLDERS FOR UNCALLED CAPITAL |
|
0,09 |
|
|
|
|
|
|
|
|
B) FIXED ASSETS |
0,94 |
28,79 |
-27,85 |
-96,73 |
|
|
|
|
|
|
C) DEFERRED
EXPENSES |
|
0,54 |
|
|
|
|
|
|
|
|
D) CURRENT
ASSETS |
99,06 |
70,59 |
28,47 |
40,33 |
|
|
|
|
|
|
ASSETS (A + B +
C + D) |
100 |
100 |
|
|
|
|
|
|
|
|
|
|
|
|
|
|
|
|
|
|
|
|
COMPANY (2006) |
SECTOR |
DIFFERENCE |
DIFFERENCE RELATIVE |
|
|
|
|
|
|
LIABILITIES |
|
|
|
|
|
|
|
|
|
|
A) SHAREHOLDERS
EQUITY |
38,32 |
36,82 |
1,51 |
4,09 |
|
|
|
|
|
|
B) DEFERRED INCOME |
|
0,14 |
|
|
|
|
|
|
|
|
C) PROVISIONS
FOR LIABILITIES AND EXPENSES |
|
0,09 |
|
|
|
|
|
|
|
|
D) LONG TERM
LIABILITIES |
|
13,55 |
|
|
|
|
|
|
|
|
E) SHORT TERM
LIABILITIES |
61,68 |
49,22 |
12,46 |
25,33 |
|
|
|
|
|
|
F) SHORT TERM
PROVISIONS FOR LIABILITIES AND EXPENSES |
|
0,18 |
|
|
|
|
|
|
|
|
LIABILITIES (A +
B + C + D + E + F) |
100 |
100 |
|
|
|
|
|
|
|
Sectorial Financial
Balance Comparison
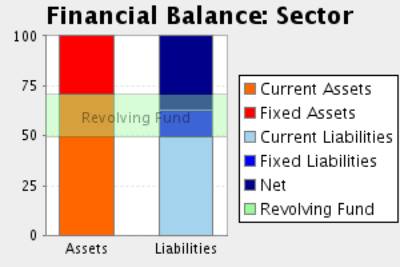
Comments to the Sectorial Analysis
In the 2006, the assets of the company were formed in 0,94% of fixed
assets and in 99,06Current Assets % In the sector, the proportion of fixed assets
was of 29,41%, 96,80% superior, and the proportion of current assets was of
70,59%, 40,33% inferior.
The assets were financed in the company in 38,32% with own capitals and
in 61,68% with current liabilities In the sector, the self financing represented
36,96%, 3,68% inferior. On the other hand the long term debts represented in
the sector an average of 49,40% financing, with a relative difference of 24,86%
in favour of the company
The result of this company’s financial structure is a turnover fund that
represents 37,37% of the total assets; in the sector, this same proportion is
21,19%, therefore, we can say that the company’s turnover fund is 76,35% higher
than the one in of the sector.
Analytical Account of Results
Figures given in %
|
|
COMPANY (2006) |
SECTOR |
DIFFERENCE |
DIFFERENCE RELATIVE |
|
Turnover |
99,24 |
98,68 |
0,56 |
0,57 |
|
Other operating income |
0,76 |
1,32 |
-0,56 |
-42,60 |
|
Production Value |
100,00 |
100,00 |
0,00 |
0,00 |
|
Operating expenses |
71,77 |
64,82 |
6,95 |
10,73 |
|
Other operation expenses |
9,31 |
13,71 |
-4,40 |
-32,09 |
|
Added value |
18,91 |
21,48 |
-2,57 |
-11,94 |
|
Labour cost |
4,98 |
14,93 |
-9,95 |
-66,64 |
|
Gross Economic Result |
13,93 |
6,55 |
7,38 |
112,70 |
|
Assets depreciation |
0,14 |
1,82 |
-1,68 |
-92,30 |
|
Variation in provision for current assets and bad debt losses |
-0,10 |
0,22 |
-0,32 |
-146,30 |
|
Net Economic Result |
13,90 |
4,52 |
9,39 |
207,86 |
|
Financial income |
0,24 |
0,30 |
-0,06 |
-20,27 |
|
Financial Charges |
0,11 |
1,15 |
-1,04 |
-90,40 |
|
Variation in financial investment provision |
|
0,01 |
|
|
|
Ordinary
Activities Result |
14,03 |
3,66 |
10,37 |
283,54 |
|
Extraordinary
income |
0,00 |
0,54 |
-0,54 |
-100,00 |
|
Extraordinary
charges |
0,00 |
0,26 |
-0,26 |
-100,00 |
|
Variation in
provision in fixed assets |
|
0,00 |
|
|
|
Results before
Taxes |
14,03 |
3,94 |
10,09 |
256,45 |
|
Corporate taxes |
4,91 |
1,10 |
3,81 |
347,18 |
|
Net Result |
9,12 |
2,84 |
6,28 |
221,35 |
|
Assets
depreciation |
0,14 |
1,82 |
-1,68 |
-92,30 |
|
Change of Provisions |
-0,10 |
0,23 |
-0,33 |
-143,29 |
|
Net Self-Financing |
9,16 |
4,89 |
4,27 |
87,44 |
Main Ratios
|
|
COMPANY (2006) |
PTILE25 |
PTILE50 |
PTILE75 |
|
STRUCTURAL RATIOS |
|
|
|
|
|
Management fund |
734.034,38 |
13,06 |
73,12 |
204,37 |
|
Indebtedness (%) |
61,68 |
48,91 |
69,84 |
84,39 |
|
External Funds on Net Worth |
1,61 |
0,96 |
2,32 |
5,40 |
|
GENERAL ACTIVITY
RATIO |
|
|
|
|
|
Turnover
Increase (%) |
31,22 |
-8,70 |
2,38 |
14,23 |
|
Added value
growth (%) |
146,13 |
-9,09 |
3,24 |
17,45 |
|
Cash Flow |
179.303,83 |
8,74 |
22,97 |
54,37 |
|
Labour
Productivity |
3,80 |
1,18 |
1,34 |
1,69 |
|
Assets turnover |
0,99 |
0,99 |
1,46 |
2,07 |
|
Breakdown Point |
994.069,31 |
297.821,21 |
618.229,46 |
1.102.128,96 |
|
Security Margin
of the Breakdown Point (%) |
49,23 |
4,01 |
9,37 |
18,22 |
|
ACTIVITY RATIOS |
|
|
|
|
|
Average Collection Period |
127 |
45 |
82 |
126 |
|
Inventory Turnover Period |
198 |
13 |
42 |
94 |
|
SOLVENCY RATIOS |
|
|
|
|
|
Payback Capacity |
0,15 |
0,04 |
0,08 |
0,17 |
|
Assets Guarantee |
1,62 |
1,17 |
1,42 |
2,03 |
|
Short Term Debts Proportion (%) |
100,00 |
71,60 |
93,38 |
100,00 |
|
Interest Coverage |
82,09 |
1,17 |
3,98 |
14,09 |
|
LIQUIDITY RATIOS |
|
|
|
|
|
Current Ratio |
1,61 |
1,08 |
1,35 |
1,95 |
|
Immediate liquidity |
0,16 |
0,05 |
0,17 |
0,47 |
|
Sales on Current Assets |
360 |
496 |
720 |
1.017 |
Results Analysis
Ratios
|
|
COMPANY (2006) |
PTILE25 |
PTILE50 |
PTILE75 |
|
Economic profitability (%) |
13,85 |
1,90 |
4,56 |
8,69 |
|
Operating Profitability (%) |
14,00 |
1,29 |
3,10 |
6,36 |
|
Equity gearing |
2,64 |
1,40 |
2,25 |
4,04 |
|
Financial profitability (%) |
23,72 |
3,35 |
8,92 |
17,75 |
|
General Profitability (%) |
9,19 |
0,54 |
1,48 |
3,86 |
FOREIGN EXCHANGE
RATES
|
Currency |
Unit
|
Indian Rupees |
|
US Dollar |
1 |
Rs.46.34. |
|
UK Pound |
1 |
Rs.82.96 |
|
Euro |
1 |
Rs.65.82 |
RATING
EXPLANATIONS
|
RATING |
STATUS |
PROPOSED CREDIT LINE |
|
|
>86 |
Aaa |
Possesses an extremely sound financial base with the strongest
capability for timely payment of interest and principal sums |
Unlimited |
|
71-85 |
Aa |
Possesses adequate working capital. No caution needed for credit transaction.
It has above average (strong) capability for payment of interest and
principal sums |
Large |
|
56-70 |
A |
Financial & operational base are regarded healthy. General unfavourable
factors will not cause fatal effect. Satisfactory capability for payment of
interest and principal sums |
Fairly Large |
|
41-55 |
Ba |
Overall operation is considered normal. Capable to meet normal
commitments. |
Satisfactory |
|
26-40 |
B |
Unfavourable & favourable factors carry similar weight in credit
consideration. Capability to overcome financial difficulties seems
comparatively below average. |
Small |
|
11-25 |
Ca |
Adverse factors are apparent. Repayment of interest and principal sums
in default or expected to be in default upon maturity |
Limited with
full security |
|
<10 |
C |
Absolute credit risk exists. Caution needed to be exercised |
Credit not
recommended |
|
NR |
In view of the lack of information, we have no basis upon which to
recommend credit dealings |
No Rating |
|
This score serves as a reference to assess SC’s credit risk
and to set the amount of credit to be extended. It is calculated from a composite
of weighted scores obtained from each of the major sections of this report. The
assessed factors and their relative weights (as indicated through %) are as
follows:
Financial
condition (40%) Ownership
background (20%) Payment
record (10%)
Credit history
(10%) Market trend
(10%) Operational
size (10%)