![]()
MIRA
INFORM REPORT
|
Report Date : |
18.09.2008 |
IDENTIFICATION
DETAILS
|
Name : |
VOLPAK S.A. |
|
|
|
|
Registered Office : |
Street Can
Vinyalets - Pg Can Vinyalets, 4, Cp 08130, Santa Perpetua
De Mogoda Barcelona |
|
|
|
|
Country : |
Spain |
|
|
|
|
Financials (as on) : |
30.11.2007 |
|
|
|
|
Date of Incorporation : |
|
|
|
|
|
Legal Form : |
Joint Stock Company |
|
|
|
|
Line of Business : |
Manufacturer of Machinery |
RATING &
COMMENTS
|
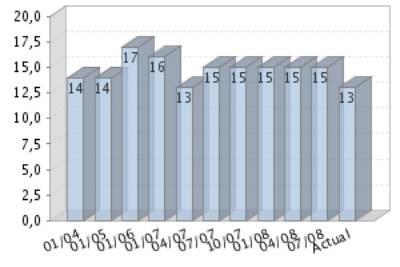
MIRA’s Rating : |
Ba |
|
RATING |
STATUS |
PROPOSED CREDIT LINE |
|
|
41-55 |
Ba |
Overall operation is considered normal. Capable to meet normal
commitments. |
Satisfactory |
|
Maximum Credit Limit : |
1.100.002,40 € |
|
|
|
|
Status : |
Satisfactory |
|
|
|
|
Payment Behaviour : |
Regular |
|
|
|
|
Litigation : |
Clear |
FINANCIAL REPORT
VOLPAK S.A.
TAX NUMBER: A80280407
EXECUTIVE SUMMARY
Identification
Current Business Name: VOLPAK S.A.
Commercial Name: ENFLEX
Other names: YES
Current Address: STREET CAN
VINYALETS - PG CAN VINYALETS, 4, CP 08130, SANTA PERPETUA
DE MOGODA BARCELONA
Branches: 1
Telephone number: 935446700 Fax: 935741136
URL: www.volpak.com
Commercial Risk
Credit Appraisal:
1.100.002,40 €
RAI: NO
Legal Actions: NO
Financial Information
Latest Balance sheet sales (2007): 42.411.013,00 € (MERCANTILE REGISTER)
Result: -672.521 €
Total Assets: 50.301.562 €
Social Capital: 9.900.000,00 €
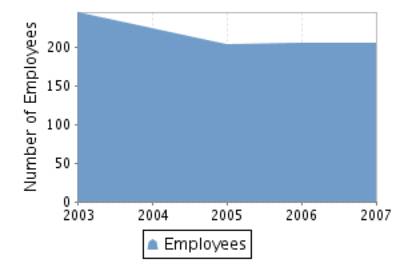
Employees: 206
Commercial Information
Constitution Date: 27/02/1992
Business activity: Mfg. of
machinery nec.
NACE Code: 2924
International Operations: Imports and
Exports
Corporate Structure
President:
Parent Company:
Participations: 3
Other Complementary Information
Latest proceeding published in BORME: 15/07/2008 Registration
of accounts
Latest press article: 30/03/2003 VANGUARDIA (BRANCHES
INFORMATION)
Bank Entities: Yes
Credit Appraisal
Maximum Credit
(from 0 a 6,000,000 €)
Favourable to 1.100.002,40 €
Rating Evolution
Financial Situation
Fiscal year2007
|
Treasury |
Average |
|
Indebtedness |
Average |
|
Profitability |
Unfavourable |
|
Balance |
Good |
Performance
|
Legal Actions |
None or Negligible |
|
Business Trajectory |
Excellent |
RAI 
COMPANY NOT REGISTERED IN THE R.A.I.
This company is not registered in the Disputed Bills register (R.A.I.)
DATE AND TIME OF THE CONSULTATION: 14/08/2008
10:08:57
INCIDENTS

Summary
LEGAL ACTIONS: No legal
incidences registered
CLAIM FILED AGAINST THE ADMINISTRATION: No administrative
claims registered
AFFECTED BY: No significant
element.
FINANCIAL ELEMENTS AND SECTORIAL
COMPARATIVE
FINANCIAL ELEMENTS
Figures given in €
|
|
2005 (12) |
2006 (12) |
2007 (12) |
% ASSETS |
|
|
|
|
|
|
BALANCE SHEET
ANALYSIS |
|
|
|
|
|
|
|
|
|
|
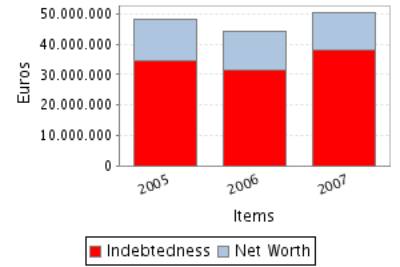
OWN FUNDS |
13.626.602,00 |
13.029.227,00 |
12.380.952,00 |
24,61 |
|
|
|
|
|
|
DEBT |
34.772.145,00 |
31.337.976,00 |
37.920.610,00 |
75,39 |
|
|
|
|
|
|
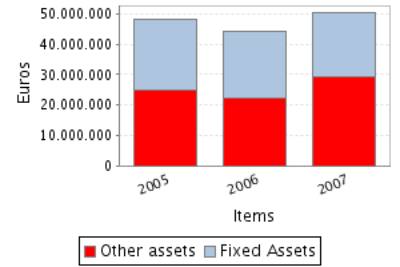
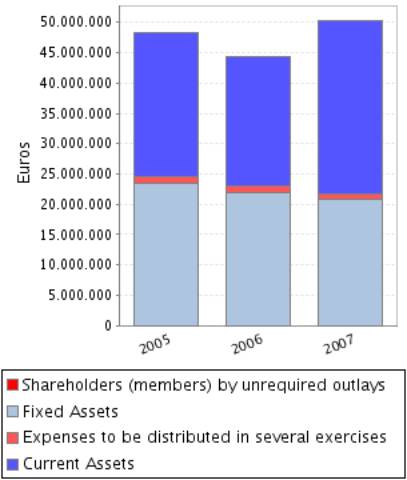
FIXED ASSETS |
23.435.102,00 |
22.005.475,00 |
20.877.155,00 |
41,50 |
|
|
|
|
|
|
TOTAL ASSETS |
48.398.747,00 |
44.367.203,00 |
50.301.562,00 |
|
|
|
|
|
|
|
|
|
|
|
|
|
|
|
|
|
|
|
2005 (12) |
2006 (12) |
2007 (12) |
% SALES |
|
|
|
|
|
|
PROFIT AND LOSS
ACCOUNT ANALYSIS |
|
|
|
|
|
|
|
|
|
|
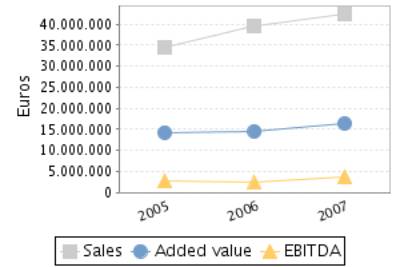
SALES |
34.591.082,00 |
39.670.406,00 |
42.411.013,00 |
|
|
|
|
|
|
|
ADDED VALUE |
14.271.285,00 |
14.509.867,00 |
16.414.828,00 |
38,70 |
|
|
|
|
|
|
EBITDA |
2.833.820,00 |
2.293.487,00 |
3.819.183,00 |
9,01 |
|
|
|
|
|
|
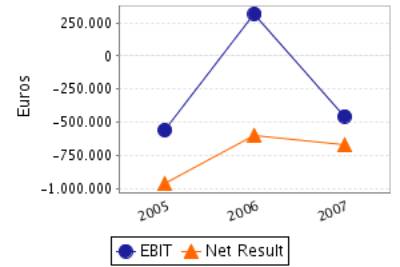
EBIT |
-558.717,00 |
317.080,00 |
-454.790,00 |
-1,07 |
|
|
|
|
|
|
NET RESULT |
-964.807,00 |
-597.375,00 |
-672.521,00 |
-1,59 |
|
|
|
|
|
Balance Sheets Items
Analysis
Balance Sheet Comments
Total assets of the company decreased in 8,33% between 2005 and 2006.
This decrease in the amount total assets, has been reflected in a
reduction of the fixed assets of 6,10%.
Assets reduction is partly explained by the net worth decrease of4,38%
nevertheless, the decrease of 9,88% in the indebtedness explains mainly this
reduction.
Total assets of the company grew 13,38% between 2006 and 2007.
In spite of the assets’ growth, the fixed assets decreased 5,13%.
This growth has been financed with an indebtedness increase of
21,01%.Moreover, net worth has been reduced in 4,98%, which explains a part of
the indebtedness increase. .
Profit and Loss Account Analysis
Profit and Loss Account Comments
The company’s sales figure grew 14,68% between 2005 and 2006.
The company’s EBIT grew 156,75% between 2005 and 2006.
This evolution implies an increase in the company’s operating
profitability.
The result of these variations is an increase of the company’s Economic
Profitability of 161,91% in the analysed period, being this profitability of
0,71% in the year 2006.
The company’s Net Result grew 38,08% between 2005 and 2006.
This evolution, compared to the EBIT’s performance, implies that the
financial and extraordinary activities have had a negative effect in the
company’s Financial Profitability.
The result of these variations is an increase of the company’s Economic
Profitability of 35,24% in the analysed period, being equal to -4,58% in the
year 2006.
The company’s sales figure grew 6,91% between 2006 and 2007.
The company’s EBIT decreased in 243,43% between 2006 and 2007.
This evolution implies a reduction in the company’s operating
profitability.
The result of these variations is a decrease of the company’s Economic
Profitability of 226,50% in the analysed period, being this profitability of
-0,90% in the year 2007.
The company’s Net Result decreased in 12,58% between 2006 and 2007.
This evolution, compared to the EBIT’s performance, implies that the
financial and extraordinary activities have had a positive effect in the
company’s Financial Profitability.
The result of these variations is a reduction of the company’s
profitability of 18,47% in the analysed period, being equal to -5,43% in the
year 2007.
ANNUAL FINANCIAL REPORT
ADDITIONAL DATA
Source: annual financial report 2007
Results Distribution
Figures given in €
|
DISTRIBUTION
BASE |
DISTRIBUTION TO |
||
|
Profit and Loss |
-672.521,00 |
Retained earnings |
0,00 |
|
Carry Over |
0,00 |
Voluntary Reserve |
0,00 |
|
Voluntary reserves |
0,00 |
Prior years losses |
-672.521,00 |
|
Reserves |
0,00 |
Carry Over |
0,00 |
|
Other concepts |
0,00 |
Other funds |
0,00 |
|
Total of Amounts to be distributed |
-672.521,00 |
Dividends |
0,00 |
|
|
|
Other Applications |
0,00 |
Auditing
Auditors’ opinion: FAVOURABLE
Auditor: KPMG AUDITORES S.L.
COMPARATIVE SECTOR ANALYSIS
Values table
Figures expressed in %
|
|
COMPANY (2007) |
SECTOR |
DIFFERENCE |
DIFFERENCE RELATIVE |
|
|
|
|
|
|
BALANCE SHEET
ANALYSIS: % on the total assets |
|
|
|
|
|
|
|
|
|
|
OWN FUNDS |
24,61 |
38,72 |
-14,11 |
-36,44 |
|
|
|
|
|
|
DEBT |
75,39 |
61,28 |
14,11 |
23,02 |
|
|
|
|
|
|
FIXED ASSETS |
41,50 |
30,02 |
11,48 |
38,26 |
|
|
|
|
|
|
|
|
|
|
|
|
|
|
|
|
|
|
COMPANY (2007) |
SECTOR |
DIFFERENCE |
DIFFERENCE RELATIVE |
|
|
|
|
|
|
PROFIT AND LOSS
ACCOUNT ANALYSIS: % on the total operating income |
|
|
|
|
|
|
|
|
|
|
SALES |
98,93 |
97,83 |
1,10 |
1,12 |
|
|
|
|
|
|
ADDED VALUE |
38,29 |
32,42 |
5,87 |
18,09 |
|
|
|
|
|
|
EBIT |
-1,06 |
9,46 |
-10,52 |
-111,22 |
|
|
|
|
|
|
NET RESULT |
-1,57 |
7,42 |
-8,98 |
-121,15 |
|
|
|
|
|
Sector Composition
Compared sector (NACE): 292
Number of companies: 21
Size (Sales Figure) : > 40.000.000,00
Euros
Comments on the sectorial comparative
Compared to its sector the assets of the companies show a greater
proportion of fixed assets. Specifically the difference with the sector average
is 11,48% , which means a relative difference of 38,26% .
In liabilities composition the company appeals on a wider scale to self
financing, being the proportion of net worth of 14,11% inferior, which means a
relative difference of 36,44% 14,11% more than the sector, which means a
difference of 23,02% .
The proportion that the sales mean to the company’s total ordinary
income is 98,93%, 1,10% higher than in the sector, which means a relative
difference of 1,12% .
The company’s EBIT was negative and equal to-1,06% with regard to the
total ordinary income, 10,52% less than the sector, which means a relative
difference of 111,22% .
The company’s capacity to generate operating income is equal to that of
the sector as its ratio EBIT/Sales is also equal.
The company’s net result was negative and equal to -1,57% with regard to
the total ordinary income, 8,98% less than the sector, which means a relative
difference of 121,15% .
The financial and extraordinary results and the tax impact have had a
more positive impact on the Net result in the company than in the sector; as a
consequence, the company shows a better Net Result/EBIT ratio.
ADDRESSES
Current Legal Seat Address:
TREET CAN VINYALETS - PG CAN VINYALETS, 4
08130 SANTA PERPETUA DE MOGODA BARCELONA
Previous Seat Address:
STREET VALLES - PG URVASA, S/N
08130
SANTA PERPETUA DE MOGODA BARCELONA
Characteristics of the current address
Type of premises: office
Property: rented
Local Situation: main
Branches 
|
STREET |
POSTAL CODE |
TOWN |
PROVINCE |
|
STREET INDUSTRIA 11 |
08760 |
MARTORELL |
Barcelona |
1 branches registered
CORPORATE STRUCTURE
ADMINISTRATIVE LINKS
Main Board members, Directors and Auditor ![]()
|
POSITION |
SURNAMES AND
NAME |
APPOINTMENT DATE |
|
|
PRESIDENT |
CASIRAGHI MARCO |
30/06/2000 |
|
|
CHIEF OFFICER |
GUBAU TORNE JOSEP |
30/06/2000 |
|
|
CHIEF OFFICER |
ETTORE BANDIERI |
18/08/2005 |
|
|
CHIEF OFFICER |
JORDANA GISBERT JORDI |
18/08/2005 |
|
|
CHIEF OFFICER |
GIANCARLO DE MARTIS |
09/02/2006 |
|
|
AUDITOR |
APPOINTMENT DATE |
||
|
KPMG AUDITORES SL |
21/02/2008 |
||
Functional Managers
|
POSITION |
SURNAMES AND
NAME |
|
Financial Manager |
ANTONELL MASSUET ANDREU |
|
Commercial Manager |
MOLLER JAVIER |
|
Exports Manager |
MOLLER JAVIER |
FINANCIAL LINKS
|
|
BUSINESS NAME |
CIF / COUNTRY |
% |
SOURCE |
DATA INF. |
|
|
COESIA S.P.A |
ITALY |
100,00 |
OWN SOURCES |
21/07/2008 |
|
|
BUSINESS NAME |
CIF / COUNTRY |
% |
SOURCE |
DATA INF. |
|
|
VOLPAK BENELUX BV |
PAÍSES BAJOS |
100,00 |
BORME II |
09/10/1998 |
|
|
VOLPAK FRANCE S.A.R.L. |
FRANCIA |
99,00 |
TRADE REG. |
31/12/2002 |
|
|
VOLPAK TECHGEN PACKAGING MACHINERIES COMPANY LTD. |
CHINA |
51,00 |
TRADE REG. |
30/11/2007 |
CREDIT INFORMATION
Constitution Date: 27/02/1992
Foundation Date: 01/01/1992
Founder / Origin: LA TITULAR ES AL
FUNDADORA INICIAL DEL NEGOCIO
Business activity 
Activity: Mfg. of machinery nec.
NACE Code: 2924
NACE Activity: Manufacture of
other general purpose machinery n.e.c.
Business: COMERCIALIZACION DE MAQUINARIA PARA
EMBALAJE.
Employees 
Number of total employees: 206 (2008)
Number of fixed employees: 99,02%
Number of temporary employees: 0,98%
Employees evolution
SUPPLIERS
|
BUSINESS NAME |
INTERNATIONAL |
|
ACMA SPA
CORNIANI |
NO |
|
ACMA GD USA |
YES |
|
ACMA SPA |
NO |
|
GD JIDOKIKAI |
NO |
|
GD AUTOMATISCHE GMBH |
NO |
|
GD GMBH |
YES |
|
LAETHUS GMBH |
YES |
|
GD JIDOKIKAI
TOKIO |
YES |
|
GD SPA |
YES |
|
GD PACKAGING
MACHINERY INC |
NO |
23 proveedores
SALES
Collection (estimated):
Export Percentage: 97%
CLIENTS
|
BUSINESS NAME |
INTERNATIONAL |
|
G D M SPA |
NO |
|
GD DO BRASIL
LTDA |
YES |
|
GD JIDOKIKAI |
YES |
|
ENFLEX SA |
NO |
|
ACMA SPA |
NO |
|
ACMA USA |
NO |
|
ACMA USA INC |
YES |
|
GD SPA |
YES |
|
ACMA GD USA |
YES |
|
ACMA GD |
YES |
20 clientes
Banks 
|
ENTITY |
BRANCH |
ADDRESS |
TOWN OR CITY |
PROVINCE |
|
BANCO ESPAÑOL DE CREDITO, S.A. |
|
|
|
|
|
DEUTSCHE BANK, S.A.E. |
|
|
|
|
|
BANCO DE SABADELL, S.A. |
5154 |
PZ SANT ROC 000020 |
SABADELL |
Barcelona |
|
DEUTSCHE BANK A.G., S.E. |
0002 |
PASEO DE GRACIA,111 12 |
BARCELONA |
Barcelona |
|
BANCO DE SABADELL, S.A. |
0022 |
C RAMBLA 000003 |
SANTA PERPETUA DE MOGODA |
Barcelona |
6 bank entities registered
Brands, Signs and Commercial
Names 
FORMER NAMES:
•
VOLPAK SA
•
G D IBERICA MAQUINAS AUTOMATICAS SA
Brand name: THE CAP (Valid)
Type: JOINT Date: 18/04/2008
Brand name: YOUPAK (Valid)
Type: DENOMINATIVE Date: 28/12/2007
LEGAL STRUCTURE
Constitution Data
Register Date: 27/02/1992
Register town: Madrid
Announcement number: 118862
Legal form: JOINT STOCK
COMPANY
Current Legal Form: JOINT STOCK
COMPANY
Current Capital:
9.900.000,00 €
Legal Aspects
Obligation to fill in Financial
Statements: YES
Chamber census: YES (2006)
Listed on a Stock Exchange: NO
B.O.R.M.E.(Official Companies
Registry Gazette) 
Registered Proceedings
|
PROCEEDINGS |
DATE |
NOTICE NUM. |
TRADE REG. |
|
Appointments |
21/02/2008 |
95251 |
Barcelona |
|
Change of statutes |
08/02/2008 |
67310 |
Barcelona |
|
Appointments |
28/01/2008 |
41354 |
Barcelona |
Other Proceedings published
|
PROCEEDINGS |
DATE |
NOTICE NUM. |
TRADE REG. |
|
Registration of
accounts (2007) Individual |
15/07/2008 |
205422 |
Barcelona |
|
Registration of
accounts (2006) Individual |
23/05/2007 |
181118 |
Barcelona |
Press articles

30/03/2003 VANGUARDIA (BRANCHES INFORMATION)
ESTA SDAD. DEL SECTOR DE LA MAQUINARIA PARA EL ENVASE Y EL EMBALAJE,
INAUGURO EL 29/03/03 SU NUEVA PLANTA SITUADA EN EL POLIGONO DE CAN VINYALETS.
LA INVERSION EN ESTA NUEVA PLANTA, QUE CUENTA CON UNA SUPERFICIE DE 12.000
METROS CUADRADOS EDIFICADOS, SE HA ELEVADO A 12 MM. DE EUROS.
10/01/2003 CINCO DIAS (APPOINTMENTS AND RESIGNATIONS)
JORDI MONLLONCH EZQUERRA HA SIDO NOMBRADO DIRECTOR DE LA DIVISION DE
PRODUCTOS ENFLEX DE LA CIA. VOLPAK.
Complementary Information
zSegun BORME (SECCION SEGUNDA) de fecha
9/10/98, la sociedad ha
absorbido a VOLPAK SA nif A08615403, BALAGUER MAQUINARIA DE ENVASES Y
EMBALAJE SL nif B58427881 y AUTOMATISMOS Y TECNOLOGIA SA nif A58041062
modificando su razon social 15/1/1999 por el de VOLPAK SA.
FINANCIAL INFORMATION
The information on the last account contained in this report is
extracted from the Mercantile Register file of the legal address of the Company
and dated 18/08/2008.
BALANCE SHEET
Assets
Figures given in €
|
|
30/11/2005 (12) |
30/11/2006 (12) |
30/11/2007 (12) |
|
A) DUE FROM SHAREHOLDERS FOR UNCALLED CAPITAL |
|
|
|
|
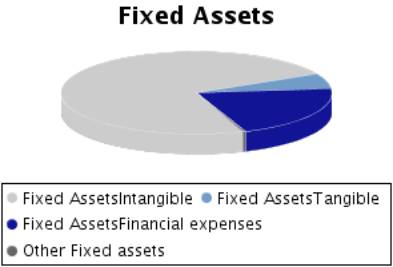
B) FIXED ASSETS |
23.435.102,00 |
22.005.475,00 |
20.877.155,00 |
|
I. Incorporation costs |
6.266,00 |
102.082,00 |
66.687,00 |
|
II. Intangible fixed assets |
17.831.155,00 |
16.612.021,00 |
15.228.326,00 |
|
R & D expenses |
317.112,00 |
317.112,00 |
317.112,00 |
|
Concessions,
patents, licences , trademarks |
32.770,00 |
32.770,00 |
32.770,00 |
|
Goodwill |
19.536.710,00 |
19.536.710,00 |
19.536.710,00 |
|
Acquired rights from finance leases |
|
|
|
|
Software |
1.723.319,00 |
1.930.773,00 |
2.032.772,00 |
|
Leasing |
12.231.570,00 |
12.231.570,00 |
12.056.818,00 |
|
Cash advance |
|
|
|
|
Provisions |
|
|
|
|
Depreciation |
-16.010.326,00 |
-17.436.914,00 |
-18.747.856,00 |
|
III. Tangible fixed assets |
1.326.748,00 |
1.202.129,00 |
1.240.553,00 |
|
Property, plant and equipment |
893.625,00 |
893.625,00 |
893.625,00 |
|
Machinery, equipment and other |
400.822,00 |
415.567,00 |
603.365,00 |
|
Other property plant and equipment |
489.613,00 |
503.970,00 |
505.025,00 |
|
Prepaid expenses on fixed assets |
|
|
|
|
Other assets |
1.407.043,00 |
1.236.746,00 |
1.320.663,00 |
|
Provisions |
|
|
|
|
Depreciation |
-1.864.355,00 |
-1.847.779,00 |
-2.082.125,00 |
|
IV. Financial fixed assets |
4.270.933,00 |
4.089.243,00 |
4.341.589,00 |
|
Shares in affiliated companies |
|
255.000,00 |
331.500,00 |
|
Receivables in affiliated companies |
|
|
|
|
Shares in associated companies |
|
|
|
|
Loans to associated companies |
|
|
|
|
Securities |
|
|
|
|
Other loans |
|
|
|
|
Long term deposits and guarantees |
28.846,00 |
18.623,00 |
15.213,00 |
|
Provisions |
|
|
|
|
Taxes receivable |
4.242.087,00 |
3.815.620,00 |
3.994.876,00 |
|
V.Owners equity |
|
|
|
|
VI.Long term trade liabilities |
|
|
|
|
C) DEFERRED EXPENSES |
1.079.452,00 |
959.488,00 |
921.352,00 |
|
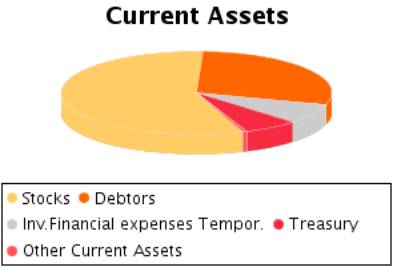
D) CURRENT ASSETS |
23.884.193,00 |
21.402.240,00 |
28.503.055,00 |
|
I. Shareholders by required outlays |
|
|
|
|
II. Stocks |
12.016.973,00 |
11.704.513,00 |
16.053.973,00 |
|
Goods available for sale |
|
40.012,00 |
40.012,00 |
|
Raw material inventory |
7.451.643,00 |
8.502.368,00 |
9.279.549,00 |
|
Work in Progress |
5.994.624,00 |
3.890.216,00 |
6.332.190,00 |
|
Finished goods |
4.370.716,00 |
5.434.530,00 |
7.573.462,00 |
|
Subproducts and recycled materials |
|
|
|
|
Cash advance |
122.533,00 |
197.698,00 |
414.739,00 |
|
Provisions |
-5.922.543,00 |
-6.360.311,00 |
-7.585.979,00 |
|
III. Debtors |
4.564.170,00 |
5.456.021,00 |
8.227.634,00 |
|
Clients |
5.151.654,00 |
6.141.851,00 |
8.198.988,00 |
|
Amounts owned by affiliated companies |
730.377,00 |
261.252,00 |
797.303,00 |
|
Amounts owned by associated companies |
|
|
|
|
Other debts |
35.860,00 |
18.006,00 |
17.833,00 |
|
Staff Expenses |
|
18.728,00 |
11.667,00 |
|
Government |
429.732,00 |
252.543,00 |
1.064.137,00 |
|
Provisions |
-1.783.453,00 |
-1.236.359,00 |
-1.862.294,00 |
|
IV. Temporary financial investment |
3.920.519,00 |
2.315.308,00 |
2.204.103,00 |
|
Shares in affiliated companies |
|
|
|
|
Receivables in affiliated companies |
|
|
|
|
Shares in associated companies |
|
|
|
|
Loans to associated companies |
|
|
|
|
Short term investment |
|
596,00 |
100.000,00 |
|
Other loans |
3.920.519,00 |
2.314.712,00 |
2.104.103,00 |
|
Short Term Deposit and guarantees |
|
|
|
|
Provisions |
|
|
|
|
V. Short-term own shares |
|
|
|
|
VI. Treasury |
3.316.560,00 |
1.907.898,00 |
1.881.527,00 |
|
VII. Periodification adjustments |
65.971,00 |
18.500,00 |
135.818,00 |
|
ASSETS (A + B + C + D) |
48.398.747,00 |
44.367.203,00 |
50.301.562,00 |
Assets composition
Liabilities
Figures given in €
|
|
30/11/2005 (12) |
30/11/2006 (12) |
30/11/2007 (12) |
|
A) SHAREHOLDERS EQUITY |
13.626.602,00 |
13.029.227,00 |
12.356.706,00 |
|
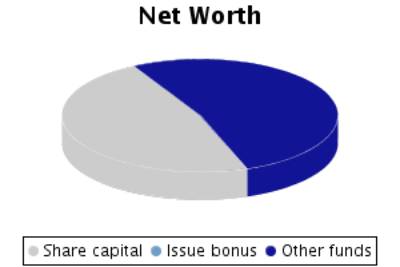
I. Share capital |
9.900.000,00 |
9.900.000,00 |
9.900.000,00 |
|
II. Issue bonus |
|
|
|
|
III.Revaluation reserve |
|
|
|
|
IV.Reserves |
10.892.720,00 |
10.892.720,00 |
10.892.720,00 |
|
Retained earnings |
961.452,00 |
961.452,00 |
961.452,00 |
|
Sinking fund from owner equity |
|
|
|
|
Reserve for the parent company capital |
|
|
|
|
Statutory reserve |
|
|
|
|
Other funds |
9.931.268,00 |
9.931.268,00 |
9.931.268,00 |
|
Capital adjustments in Euros |
|
|
|
|
V.Results from previous years |
-6.201.311,00 |
-7.166.118,00 |
-7.763.493,00 |
|
Carry Over |
|
|
|
|
Prior years losses |
-6.201.311,00 |
-7.166.118,00 |
-7.763.493,00 |
|
Loans from partners for losses compensation |
|
|
|
|
VI.Profit and Losses |
-964.807,00 |
-597.375,00 |
-672.521,00 |
|
VII.Dividend paid during the year |
|
|
|
|
VIII.Own shares for capital reduction |
|
|
|
|
B) DEFERRED INCOME |
|
|
24.246,00 |
|
Capital grants |
|
|
|
|
Positive change difference |
|
|
18.471,00 |
|
Other deferred income |
|
|
5.775,00 |
|
Fiscal deferred income |
|
|
|
|
C) PROVISIONS FOR LIABILITIES AND EXPENSES |
439.955,00 |
51.515,00 |
51.515,00 |
|
Provision for pensions plans |
|
|
|
|
Provision for taxes |
|
|
|
|
Other provisions |
439.955,00 |
51.515,00 |
51.515,00 |
|
Reversion fund |
|
|
|
|
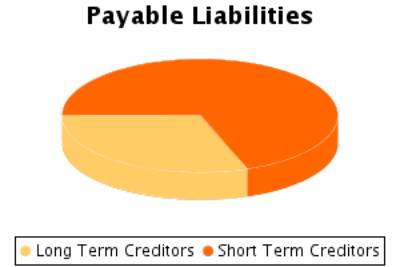
D) LONG TERM LIABILITIES |
15.502.958,00 |
14.715.149,00 |
11.594.846,00 |
|
I.Negotiable bonds and other negotiable values |
|
|
|
|
Non convertible securities |
|
|
|
|
Convertible securities |
|
|
|
|
Other convertible debentures |
|
|
|
|
II.Debt with bank entities |
9.502.958,00 |
8.715.149,00 |
7.594.846,00 |
|
Long term bank loans |
666.910,00 |
1.148.840,00 |
1.267.799,00 |
|
Leasing |
8.836.048,00 |
7.566.309,00 |
6.327.047,00 |
|
III.Debts with associated and affiliated
companies |
6.000.000,00 |
6.000.000,00 |
4.000.000,00 |
|
With affiliated companies |
6.000.000,00 |
6.000.000,00 |
4.000.000,00 |
|
Associated companies |
|
|
|
|
IV. Other creditors |
|
|
|
|
Bills payable |
|
|
|
|
Other debts |
|
|
|
|
Long term deposit and guaranties |
|
|
|
|
Taxes receivable |
|
|
|
|
V. Deferred debts on shares |
|
|
|
|
From affiliated companies |
|
|
|
|
From associated companies |
|
|
|
|
Other companies |
|
|
|
|
VI. Long term debt with creditor |
|
|
|
|
E) SHORT TERM LIABILITIES |
18.829.232,00 |
16.571.312,00 |
26.274.249,00 |
|
I.Negotiable bonds and other negotiable values |
|
|
|
|
Non convertible securities |
|
|
|
|
Convertible securities |
|
|
|
|
Other convertible debentures |
|
|
|
|
Interests from bonds |
|
|
|
|
II.Debt with bank entities |
2.457.121,00 |
2.707.101,00 |
3.362.763,00 |
|
Loans and other debts |
1.088.239,00 |
1.288.990,00 |
1.890.446,00 |
|
Debt interest |
|
3.316,00 |
|
|
Leasing |
1.368.882,00 |
1.414.795,00 |
1.472.317,00 |
|
III. Short term debts with associated and
affiliated companies |
2.359.261,00 |
430.564,00 |
908.885,00 |
|
With affiliated companies |
2.359.261,00 |
430.564,00 |
908.885,00 |
|
Associated companies |
|
|
|
|
IV. Commercial creditors |
11.396.556,00 |
10.946.315,00 |
17.962.988,00 |
|
Accounts payable |
4.840.739,00 |
3.014.564,00 |
7.960.141,00 |
|
Expenses |
6.408.116,00 |
7.745.239,00 |
9.722.725,00 |
|
Bills payable |
147.701,00 |
186.512,00 |
280.122,00 |
|
V. Other non-commercial debt |
1.663.755,00 |
1.706.062,00 |
2.470.426,00 |
|
Government |
545.256,00 |
603.912,00 |
697.217,00 |
|
Bills payable |
|
|
|
|
Other debts |
|
642,00 |
215,00 |
|
Accounts receivable |
1.118.499,00 |
1.101.508,00 |
1.772.994,00 |
|
Short term deposits and guarantees |
|
|
|
|
VI. Provisions for current assets |
939.737,00 |
772.825,00 |
1.560.742,00 |
|
VII. Periodification adjustments |
12.802,00 |
8.445,00 |
8.445,00 |
|
F) SHORT TERM PROVISIONS FOR LIABILITIES AND
EXPENSES |
|
|
|
|
LIABILITIES (A + B + C + D + E + F) |
48.398.747,00 |
44.367.203,00 |
50.301.562,00 |
Liabilities
Composition
PROFIT AND LOSS ACCOUNT
Itams of the Profit and Loss Account
Figures given in €
|
|
30/11/2005 (12) |
30/11/2006 (12) |
30/11/2007 (12) |
|
A) EXPENSES (A.1 a A.16) |
37.691.123,00 |
41.082.632,00 |
48.529.887,00 |
|
A.1.Reduction in stocks of finished goods and
work in progress |
|
1.040.594,00 |
|
|
A.2.Supplies |
13.363.964,00 |
15.187.859,00 |
21.213.909,00 |
|
Material consumed |
|
|
|
|
Raw materials consumed |
13.149.610,00 |
14.968.566,00 |
20.910.389,00 |
|
Other expenses |
214.354,00 |
219.293,00 |
303.520,00 |
|
A.3. Labour cost |
11.437.465,00 |
12.216.380,00 |
12.595.645,00 |
|
Wages |
9.088.227,00 |
9.661.981,00 |
9.974.706,00 |
|
Social security expenses |
2.349.238,00 |
2.554.399,00 |
2.620.939,00 |
|
A.4. Assets depreciation |
1.774.909,00 |
1.649.632,00 |
1.602.876,00 |
|
A.5.Variance in the traffic provisions |
1.617.628,00 |
326.775,00 |
2.671.097,00 |
|
Variance in provision for inventory |
1.221.578,00 |
437.768,00 |
1.225.668,00 |
|
Variance in provision for bad debts |
603.646,00 |
55.919,00 |
657.512,00 |
|
Variance in provision for other current assets |
-207.596,00 |
-166.912,00 |
787.917,00 |
|
A.6. Other operating costs |
8.824.621,00 |
9.444.379,00 |
9.822.121,00 |
|
External costs |
8.790.221,00 |
9.402.540,00 |
9.684.427,00 |
|
Taxes |
34.400,00 |
41.839,00 |
137.694,00 |
|
Other day to day expenses |
|
|
|
|
Allowance to reversion fund |
|
|
|
|
A.I.OPERATING
RESULT (B.1+B.2+B.3+B.4-A.1-A.2-A.3-A.4-A.5-A.6) |
|
317.080,00 |
|
|
A.7.Financial expenses and similar |
539.556,00 |
551.702,00 |
601.081,00 |
|
Debts with related companies |
185.433,00 |
183.112,00 |
172.787,00 |
|
Debts with associated companies |
|
|
|
|
Other companies debts By debts with third parties and similar expenses |
354.123,00 |
368.590,00 |
428.294,00 |
|
Losses from financial investments |
|
|
|
|
A.8. Variation in financial investment provision |
|
|
|
|
A.9.Negative exchange difference |
75.227,00 |
17.862,00 |
91.544,00 |
|
A.II.POSITIVE
FINANCIAL RESULTS (B.5+B.6+B.7+B.8-A.7-A.8-A.9) |
|
|
|
|
A.III.PROFIT
FROM ORDINARY ACTIVITIES (A.I+A.II-B.I-B.II) |
|
|
|
|
A.10. Variation
in provision in fixed assets |
|
|
|
|
A.11. Losses in
fixed assets |
92.471,00 |
20.361,00 |
|
|
A.12. Losses
from own shares and bonds |
|
|
|
|
A.13.
Extraordinary charges |
420.861,00 |
18.560,00 |
14.296,00 |
|
A.14.Other
exercises’ expenses and losses |
62.627,00 |
|
203.928,00 |
|
A.IV.POSITIVE
EXTRAORDINARY RESULT (B.9+B.10+B.11+B.12+B.13-A.10-A.11-A.12-A.13-A.14) |
|
85.894,00 |
|
|
A.V.PROFIT
BEFORE TAXES (A.III+A.IV-B.III-B.IV) |
|
11.153,00 |
|
|
A.15.Corporate
Taxes |
-518.206,00 |
608.528,00 |
-286.610,00 |
|
A.16. Other
taxes |
|
|
|
|
A.VI.EXERCISE
RESULT (PROFIT) (A.V-A.14-A.15) |
|
|
|
|
B) INCOMES (B.1
a B13) |
36.726.316,00 |
40.485.257,00 |
47.857.366,00 |
|
B.1. Turnover |
34.591.082,00 |
39.670.406,00 |
42.411.013,00 |
|
Sales |
32.696.734,00 |
37.698.012,00 |
40.021.936,00 |
|
Services
provided |
1.894.348,00 |
1.972.394,00 |
2.389.077,00 |
|
Refunds and sale
reminders |
|
|
|
|
B.2.Increase in
inventory of finished goods and works in progress |
1.217.013,00 |
|
4.580.906,00 |
|
B.3.Expenses
capitalized |
|
|
|
|
B.4. Other
operating income |
651.775,00 |
512.293,00 |
458.939,00 |
|
Other incomes |
631.389,00 |
511.519,00 |
425.286,00 |
|
Grants |
20.386,00 |
774,00 |
31.828,00 |
|
Excess in
provision for liabilities and charges |
|
|
1.825,00 |
|
B.I.OPERATING
LOSSES (A.1+A.2+A.3+A.4+A.5+A.6-B.1-B.2-B.3-B.4) |
558.717,00 |
|
454.790,00 |
|
B.5.Incomes from
share participations |
|
|
|
|
From affiliated
companies |
|
|
|
|
From associated
companies |
|
|
|
|
From other
companies |
|
|
|
|
B.6.Income from
other securities and credits to fixed assets |
75.379,00 |
96.190,00 |
151.183,00 |
|
From affiliated
companies |
|
|
|
|
From associated
companies |
|
|
|
|
Other companies |
75.379,00 |
96.190,00 |
151.183,00 |
|
B.7.Other
interests and similar |
36.474,00 |
16.295,00 |
28.609,00 |
|
From affiliated
companies |
|
|
|
|
From associated
companies |
|
|
|
|
Other Interests |
36.474,00 |
16.295,00 |
28.609,00 |
|
Profits from investments |
|
|
|
|
B.8. Positive change difference |
92.133,00 |
65.258,00 |
105.376,00 |
|
B.II. NEGATIVE FINANCIAL RESULTS
(A.7+A.8+A.9-B.5-B.6-B.7-B.8) |
410.797,00 |
391.821,00 |
407.457,00 |
|
B.III.LOSSES FROM ORDINARY ACTIVITIES
(B.I+B.II-A.I-A.II) |
969.514,00 |
74.741,00 |
862.247,00 |
|
B.9.B.9. Gains from disposal of fixed assets |
3.000,00 |
300,00 |
3.416,00 |
|
B.10.Gains from dealing in own shares |
|
|
|
|
B.11. Paid in surplus |
|
|
|
|
B.12. Extraordinary income |
18.035,00 |
993,00 |
43.355,00 |
|
B.13.Other year’s income and profits |
41.425,00 |
123.522,00 |
74.569,00 |
|
B.IV.NEGATIVE EXTRAORDINARY LOSSES
(A.10+A.11+A.12+A.13+A.14-B.9-B.10-B.11-B.12-B.13) |
513.499,00 |
|
96.884,00 |
|
B.V.LOSS BEFORE TAXES (B.III+B.IV-A.III-A.IV) |
1.483.013,00 |
|
959.131,00 |
|
B.VI.EXERCISE RESULTS (LOSS) (B.V+A.14+A.15) |
964.807,00 |
597.375,00 |
672.521,00 |
Composition of the
Profit and Loss Account
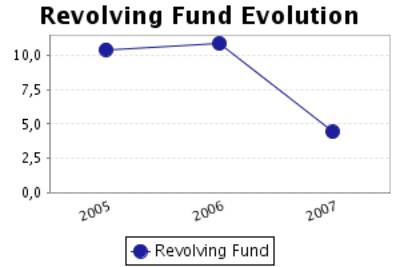
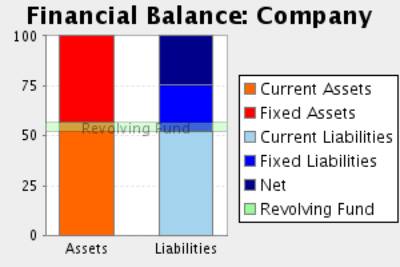
FINANCIAL BALANCE
Here the Main Capital Amounts of the company and the Revolving Fund
Evolution are analysed.
Financial Balance Table
Figures given in €
|
|
30/11/2005 (12) |
% |
30/11/2006 (12) |
% |
30/11/2007 (12) |
% |
|
A) DUE FROM
SHAREHOLDERS FOR UNCALLED CAPITAL |
|
|
|
|
|
|
|
B) FIXED ASSETS |
23.435.102,00 |
48,42 |
22.005.475,00 |
49,60 |
20.877.155,00 |
41,50 |
|
C) DEFERRED
EXPENSES |
1.079.452,00 |
2,23 |
959.488,00 |
2,16 |
921.352,00 |
1,83 |
|
D) CURRENT
ASSETS |
23.884.193,00 |
49,35 |
21.402.240,00 |
48,24 |
28.503.055,00 |
56,66 |
|
ASSETS (A + B +
C + D) |
48.398.747,00 |
|
44.367.203,00 |
|
50.301.562,00 |
|
|
|
||||||
|
A) SHAREHOLDERS
EQUITY |
13.626.602,00 |
28,15 |
13.029.227,00 |
29,37 |
12.356.706,00 |
24,57 |
|
B) DEFERRED
INCOME |
|
|
|
|
24.246,00 |
0,05 |
|
C) PROVISIONS
FOR LIABILITIES AND EXPENSES |
439.955,00 |
0,91 |
51.515,00 |
0,12 |
51.515,00 |
0,10 |
|
D) LONG TERM
LIABILITIES |
15.502.958,00 |
32,03 |
14.715.149,00 |
33,17 |
11.594.846,00 |
23,05 |
|
E) SHORT TERM
LIABILITIES |
18.829.232,00 |
38,90 |
16.571.312,00 |
37,35 |
26.274.249,00 |
52,23 |
|
F) SHORT TERM
PROVISIONS FOR LIABILITIES AND EXPENSES |
|
|
|
|
|
|
|
LIABILITIES (A +
B + C + D + E + F) |
48.398.747,00 |
|
44.367.203,00 |
|
50.301.562,00 |
|
Financial Balance
Composition
Comments on Financial Balance
In the 2005, the assets of the company were formed in 50,65% of Fixed
Assets and in 49,35% of Current Assets.This assets were financed in 28,15% with
own capitals, and in 32,94% with long term debt and in 38,90% with current
liabilities.
The result of this financial structure is a positive turnover fund of
5.054.961,00 Euros, which is equivalent to 10,44% proportion of the
company’s total assets.
In the 2006, the assets of the company were formed in 51,76% of Fixed
Assets and in 48,24% of Current Assets.This assets were financed in 29,37% with
own capitals, and in 33,28% with long term debt and in 37,35% with current
liabilities.
The result of this financial structure is a positive turnover fund of
4.830.928,00 Euros, which is equivalent to 10,89% proportion of the
company’s total assets.
This measure has diminished with respect to the previous exercise in
4,43% having, however, increased its proportion with respect to the total
assets of the company.
In the 2007, the assets of the company were formed in 43,34% of Fixed
Assets and in 56,66% of Current Assets.This assets were financed in 24,61% with
own capitals, and in 23,15% with long term debt and in 52,23% with current
liabilities.
The result of this financial structure is a positive turnover fund of
2.228.806,00 Euros, which is equivalent to 4,43% proportion of the
company’s total assets.
This measure has diminished with respect to the previous exercise in
53,86% having also diminished its proportion with respect to the total assets
of the company.
RATIOS
Main Ratios
|
|
30/11/2005 (12) |
30/11/2006 (12) |
30/11/2007 (12) |
|
STRUCTURAL RATIOS |
|
|
|
|
Management fund |
5.054.961,00 |
4.830.928,00 |
2.228.806,00 |
|
Management Fund Requirement |
275.003,00 |
3.314.823,00 |
1.505.939,00 |
|
Indebtedness (%) |
71,84 |
70,63 |
75,39 |
|
External Funds on Net Worth |
2,55 |
2,40 |
3,06 |
|
GENERAL ACTIVITY RATIO |
|
|
|
|
Turnover Increase (%) |
6,46 |
14,68 |
6,91 |
|
Added value growth (%) |
-3,29 |
1,67 |
13,13 |
|
Cash Flow |
2.427.730,00 |
1.379.032,00 |
3.601.452,00 |
|
Labour Productivity |
1,25 |
1,19 |
1,30 |
|
Assets turnover |
0,72 |
0,89 |
0,84 |
|
Breakdown Point |
36.095.422,96 |
39.650.804,56 |
43.613.057,67 |
|
Security Margin of the Breakdown Point (%) |
-2,42 |
1,32 |
-1,73 |
|
ACTIVITY RATIOS |
|
|
|
|
Average Payment Period |
338 |
243 |
389 |
|
Average Collection Period |
48 |
50 |
70 |
|
Inventory Turnover Period |
125 |
106 |
136 |
|
SOLVENCY RATIOS |
|
|
|
|
Payback Capacity |
0,07 |
0,04 |
0,10 |
|
Assets Guarantee |
1,36 |
1,38 |
1,30 |
|
Short Term Debts Proportion (%) |
54,15 |
52,88 |
69,29 |
|
Interest Coverage |
1,75 |
1,95 |
-2,31 |
|
LIQUIDITY RATIOS |
|
|
|
|
Current Ratio |
1,27 |
1,29 |
1,08 |
|
Immediate liquidity |
0,38 |
0,26 |
0,16 |
|
Treasury |
4.779.958,00 |
1.516.105,00 |
722.867,00 |
|
Sales on Current Assets |
521 |
667 |
536 |
Results Analysis
Ratios
|
|
30/11/2005 (12) |
30/11/2006 (12) |
30/11/2007 (12) |
|
Economic profitability (%) |
-1,15 |
0,72 |
-0,90 |
|
Operating Profitability (%) |
-1,62 |
0,80 |
-1,07 |
|
Equity gearing |
6,16 |
-0,80 |
7,70 |
|
Financial profitability (%) |
-7,08 |
-4,58 |
-5,43 |
|
General Profitability (%) |
-2,79 |
-1,51 |
-1,59 |
Comments on the
Results Analysis Ratios
The economic profitability in the year2006 achieved a 0,72% positive
level, due to a 0,80% economic margin and to an assets turnover of0,89%.
The economic profitability in the year has passed from a negative level
of -1,15% to its positive current value. This evolution is due to the obtaining
of positive operating profitability of 0,80% in comparison with the previous
negative level of -1,62%. Assets turnover has maintained stable in this period,
with an index of 0,89%.
Financial profitability on 2006The economic profitability in the year
-4,58
The company’s financial structure has endangered its profitability with
an indebtedness level -0,80.
The general profitability on 2006The economic profitability in the year
-1,51
The economic profitability in the year2007The economic profitability in
the year -0,90%, derived from a negative operating profitability of -1,07%.The
assets turnover was 0,84%.
The economic profitability in the year from a positive level of 0,72% to
its current negative level. This evolution is due to the obtaining of a
negative operating profitability of -1,07% in comparison with the current
positive value of 0,80%. Assets turnover has maintained stable in this period,
with an index of 0,84%.
Financial profitability on 2007The economic profitability in the year
-5,43
The company’s financial structure has restrained its financial
profitability with an indebtedness level of 7,70.
The general profitability on 2007The economic profitability in the year
-1,59
SECTORIAL ANÁLYSIS
Large Capital Amounts and Financial Balance
Figures given in %
|
|
COMPANY (2007) |
SECTOR |
DIFFERENCE |
DIFFERENCE RELATIVE |
|
|
|
|
|
|
ASSETS |
|
|
|
|
|
|
|
|
|
|
A) DUE FROM
SHAREHOLDERS FOR UNCALLED CAPITAL |
|
0,00 |
|
|
|
|
|
|
|
|
B) FIXED ASSETS |
41,50 |
30,02 |
11,48 |
38,25 |
|
|
|
|
|
|
C) DEFERRED
EXPENSES |
1,83 |
0,07 |
1,76 |
2.514,29 |
|
|
|
|
|
|
D) CURRENT
ASSETS |
56,66 |
69,91 |
-13,25 |
-18,95 |
|
|
|
|
|
|
ASSETS (A + B + C + D) |
100 |
100 |
|
|
|
|
|
|
|
|
|
|
|
|
|
|
|
|
|
|
|
|
COMPANY (2007) |
SECTOR |
DIFFERENCE |
DIFFERENCE RELATIVE |
|
|
|
|
|
|
LIABILITIES |
|
|
|
|
|
|
|
|
|
|
A) SHAREHOLDERS
EQUITY |
24,57 |
38,00 |
-13,43 |
-35,35 |
|
|
|
|
|
|
B) DEFERRED
INCOME |
0,05 |
0,72 |
-0,67 |
-93,06 |
|
|
|
|
|
|
C) PROVISIONS
FOR LIABILITIES AND EXPENSES |
0,10 |
0,74 |
-0,64 |
-86,39 |
|
|
|
|
|
|
D) LONG TERM
LIABILITIES |
23,05 |
7,31 |
15,74 |
215,45 |
|
|
|
|
|
|
E) SHORT TERM
LIABILITIES |
52,23 |
53,23 |
-1,00 |
-1,88 |
|
|
|
|
|
|
F) SHORT TERM
PROVISIONS FOR LIABILITIES AND EXPENSES |
|
0,00 |
|
|
|
|
|
|
|
|
LIABILITIES (A + B + C + D + E + F) |
100 |
100 |
|
|
|
|
|
|
|
Sectorial Financial
Balance Comparison
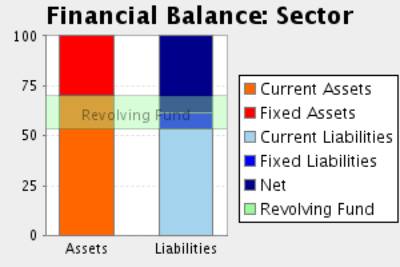
Comments to the Sectorial Analysis
In the 2007, the assets of the company were formed in 43,34% of fixed
assets and in 56,66Current Assets % In the sector, the proportion of fixed assets
was of 30,09%, 44,04% inferior, and the proportion of current assets was of
69,91%, 18,95% superior.
The assets were financed in the company in 24,61% with own capitals , in
23,15% with fixed liabilities and in 52,23% with current liabilities In the sector,
the self financing represented 38,72%, 36,44% superior. On the other hand the
long term debts represented in the sector an average of 8,04% financing, with a
relative difference of 187,86% in favour of the companyAnd, short term
liabilities represented in the sector an average of 53,24% financing, with a
relative difference of 1,89% favourable to the sector
The result of this company’s financial structure is a turnover fund that
represents 4,43% of the total assets; in the sector, this same proportion is
16,68%, therefore, we can say that the company’s turnover fund is 73,43%
smaller than the sector one.
Analytical Account of Results
Figures given in %
|
|
COMPANY (2007) |
SECTOR |
DIFFERENCE |
DIFFERENCE RELATIVE |
|
Turnover |
98,93 |
97,83 |
1,10 |
1,12 |
|
Other operating income |
1,07 |
2,17 |
-1,10 |
-50,65 |
|
Production Value |
100,00 |
100,00 |
0,00 |
0,00 |
|
Operating expenses |
38,80 |
54,98 |
-16,18 |
-29,43 |
|
Other operation expenses |
22,91 |
12,60 |
10,31 |
81,88 |
|
Added value |
38,29 |
32,42 |
5,87 |
18,09 |
|
Labour cost |
29,38 |
20,18 |
9,20 |
45,59 |
|
Gross Economic Result |
8,91 |
12,24 |
-3,33 |
-27,22 |
|
Assets depreciation |
3,74 |
2,40 |
1,34 |
56,09 |
|
Variation in provision for current assets and bad debt losses |
6,23 |
0,39 |
5,84 |
1.493,35 |
|
Net Economic Result |
-1,06 |
9,46 |
-10,52 |
-111,21 |
|
Financial income |
0,67 |
0,99 |
-0,32 |
-32,25 |
|
Financial Charges |
1,62 |
0,84 |
0,78 |
93,78 |
|
Variation in financial investment provision |
|
0,00 |
|
|
|
Ordinary
Activities Result |
-2,01 |
9,61 |
-11,62 |
-120,91 |
|
Extraordinary
income |
0,28 |
1,22 |
-0,94 |
-76,95 |
|
Extraordinary
charges |
0,51 |
1,01 |
-0,50 |
-49,65 |
|
Variation in
provision in fixed assets |
|
0,07 |
|
|
|
Results before Taxes |
-2,24 |
9,75 |
-11,99 |
-122,98 |
|
Corporate taxes |
-0,67 |
2,33 |
-3,00 |
-128,74 |
|
Net Result |
-1,57 |
7,42 |
-8,99 |
-121,17 |
|
Assets depreciation |
3,74 |
2,40 |
1,34 |
56,09 |
|
Change of Provisions |
6,23 |
0,46 |
5,78 |
1.269,23 |
|
Net Self-Financing |
8,40 |
10,27 |
-1,87 |
-18,18 |
Main Ratios
|
|
COMPANY (2007) |
PTILE25 |
PTILE50 |
PTILE75 |
|
STRUCTURAL RATIOS |
|
|
|
|
|
Management fund |
2.228.806,00 |
7.466,61 |
12.147,76 |
20.593,00 |
|
Management Fund
Requirement |
1.505.939,00 |
-8.845,55 |
2.361,83 |
10.033,00 |
|
Indebtedness (%) |
75,39 |
46,34 |
58,44 |
66,78 |
|
External Funds
on Net Worth |
3,06 |
0,86 |
1,41 |
2,01 |
|
GENERAL ACTIVITY
RATIO |
|
|
|
|
|
Turnover Increase (%) |
6,91 |
1,89 |
7,22 |
16,32 |
|
Added value growth (%) |
13,13 |
-3,71 |
6,86 |
13,43 |
|
Cash Flow |
3.601.452,00 |
3.747,90 |
5.320,72 |
9.900,10 |
|
Labour Productivity |
1,30 |
1,40 |
1,84 |
1,91 |
|
Assets turnover |
0,84 |
0,88 |
1,03 |
1,33 |
|
Breakdown Point |
43.613.057,67 |
40.326.991,55 |
55.720.589,25 |
85.900.996,76 |
|
Security Margin
of the Breakdown Point (%) |
-1,73 |
13,02 |
18,89 |
26,90 |
|
ACTIVITY RATIOS |
|
|
|
|
|
Average Payment
Period |
389 |
79 |
119 |
200 |
|
Average
Collection Period |
70 |
100 |
142 |
166 |
|
Inventory
Turnover Period |
136 |
29 |
40 |
78 |
|
SOLVENCY RATIOS |
|
|
|
|
|
Payback Capacity |
0,10 |
0,08 |
0,19 |
0,26 |
|
Assets Guarantee |
1,30 |
1,49 |
1,71 |
2,13 |
|
Short Term Debts
Proportion (%) |
69,29 |
81,65 |
93,97 |
99,30 |
|
Interest
Coverage |
-2,31 |
7,20 |
18,65 |
48,67 |
|
LIQUIDITY RATIOS |
|
|
|
|
|
Current Ratio |
1,08 |
1,28 |
1,46 |
1,68 |
|
Immediate liquidity |
0,16 |
0,05 |
0,17 |
0,29 |
|
Treasury |
722.867,00 |
-3.357,21 |
1.897,80 |
8.188,73 |
|
Sales on Current Assets |
536 |
438 |
611 |
694 |
Results Analysis
Ratios
|
|
COMPANY (2007) |
PTILE25 |
PTILE50 |
PTILE75 |
|
Economic profitability (%) |
-0,90 |
4,88 |
7,78 |
12,38 |
|
Operating Profitability (%) |
-1,07 |
4,95 |
7,58 |
9,27 |
|
Equity gearing |
7,70 |
1,77 |
2,22 |
2,98 |
|
Financial profitability (%) |
-5,43 |
9,15 |
12,43 |
18,79 |
|
General Profitability (%) |
-1,59 |
2,96 |
5,35 |
8,04 |
FOREIGN EXCHANGE
RATES
|
Currency |
Unit
|
Indian Rupees |
|
US Dollar |
1 |
Rs.46.71 |
|
UK Pound |
1 |
Rs.83.57 |
|
Euro |
1 |
Rs.65.90 |
RATING EXPLANATIONS
|
RATING |
STATUS |
PROPOSED CREDIT LINE |
|
|
>86 |
Aaa |
Possesses an extremely sound financial base with the strongest
capability for timely payment of interest and principal sums |
Unlimited |
|
71-85 |
Aa |
Possesses adequate working capital. No caution needed for credit
transaction. It has above average (strong) capability for payment of interest
and principal sums |
Large |
|
56-70 |
A |
Financial & operational base are regarded healthy. General unfavourable
factors will not cause fatal effect. Satisfactory capability for payment of
interest and principal sums |
Fairly Large |
|
41-55 |
Ba |
Overall operation is considered normal. Capable to meet normal
commitments. |
Satisfactory |
|
26-40 |
B |
Unfavourable & favourable factors carry similar weight in credit
consideration. Capability to overcome financial difficulties seems
comparatively below average. |
Small |
|
11-25 |
Ca |
Adverse factors are apparent. Repayment of interest and principal sums
in default or expected to be in default upon maturity |
Limited with
full security |
|
<10 |
C |
Absolute credit risk exists. Caution needed to be exercised |
Credit not
recommended |
|
NR |
In view of the lack of information, we have no basis upon which to
recommend credit dealings |
No Rating |
|
This score serves as a reference to assess SC’s credit risk
and to set the amount of credit to be extended. It is calculated from a composite
of weighted scores obtained from each of the major sections of this report. The
assessed factors and their relative weights (as indicated through %) are as
follows:
Financial
condition (40%) Ownership
background (20%) Payment
record (10%)
Credit history
(10%) Market trend
(10%) Operational
size (10%)