![]()
MIRA
INFORM REPORT
|
Report Date : |
25.09.2008 |
IDENTIFICATION
DETAILS
|
Name : |
MODA MONTREAL SL. |
|
|
|
|
Registered Office : |
Street Doctor
Allart, 25 - 27, Cp 38003, Santa Cruz De
Tenerife Tenerife |
|
|
|
|
Country : |
Spain |
|
|
|
|
Financials (as on) : |
31.12.2007 |
|
|
|
|
Date of Incorporation : |
|
|
|
|
|
Legal Form : |
Limited Liability Company |
|
|
|
|
Line of Business : |
RATING &
COMMENTS
|
MIRA’s Rating : |
B |
|
RATING |
STATUS |
PROPOSED CREDIT LINE |
|
|
26-40 |
B |
Unfavourable & favourable factors carry similar weight in credit
consideration. Capability to overcome financial difficulties seems
comparatively below average. |
Small |
|
Status : |
Moderate |
|
|
|
|
Payment Behaviour : |
Sow |
|
|
|
|
Litigation : |
Clear |
FINANCIAL REPORT
MODA MONTREAL SL.
TAX NUMBER: B38725180
EXECUTIVE SUMMARY
Identification
Current Business Name: MODA MONTREAL SL.
Commercial Name: MOMU
Other names: NO
Current Address: STREET DOCTOR
ALLART, 25 - 27, CP 38003, SANTA CRUZ DE TENERIFE TENERIFE
Branches: 6
Telephone number: 922243485 Fax: 922244712
URL: www.momuwoman.com Corporate e-mail: ceeme@momuwoman.com
Commercial Risk
RAI: NO
Legal Actions: NO
Financial Information
Latest Balance sheet sales (2007): 2.238.853,97 € (MERCANTILE REGISTER)
Result: 2.954,77 €
Total Assets: 1.699.314,15 €
Social Capital: 60.000,00 €
Employees: 15
Commercial Information
Constitution Date: 04/04/2003
Business activity: Retail sale
of clothes
NACE Code: 5242
International Operations: Imports
Corporate Structure
Sole Administrator:
LALWANI
PRIMLANI SURESH HARIRAM
Other Complementary Information
Latest proceeding published in BORME: 26/08/2008 Registration
of accounts
Bank Entities: Yes
Rating Evolution
Financial Situation
Fiscal year2007
|
Treasury |
Limited |
|
Indebtedness |
Heavy |
|
Profitability |
Null |
|
Balance |
Very Degraded |
Performance
|
Legal Actions |
None or Negligible |
|
Business
Trajectory |
Excellent |
RAI 
COMPANY NOT REGISTERED IN THE R.A.I.
This company is not registered in the Disputed Bills register (R.A.I.)
DATE AND TIME OF THE CONSULTATION: 17/09/2008
14:09:41
INCIDENTS

Summary
LEGAL ACTIONS: No legal
incidences registered
CLAIM FILED AGAINST THE ADMINISTRATION: No administrative
claims registered
AFFECTED BY: No significant
element.
FINANCIAL ELEMENTS AND SECTORIAL
COMPARATIVE
FINANCIAL ELEMENTS
Figures given in €
|
|
2005 (12) |
2006 (12) |
2007 (12) |
% ASSETS |
|
|
|
|
|
|
BALANCE SHEET
ANALYSIS |
|
|
|
|
|
|
|
|
|
|
OWN FUNDS |
65.716,95 |
69.512,09 |
72.466,86 |
4,26 |
|
|
|
|
|
|
DEBT |
1.391.477,39 |
1.508.076,83 |
1.626.847,29 |
95,74 |
|
|
|
|
|
|
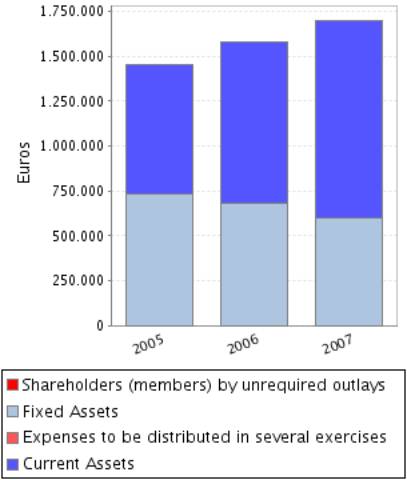
FIXED ASSETS |
735.351,66 |
682.522,11 |
596.988,95 |
35,13 |
|
|
|
|
|
|
TOTAL ASSETS |
1.457.194,34 |
1.577.588,92 |
1.699.314,15 |
|
|
|
|
|
|
|
|
|
|
|
|
|
|
|
|
|
|
|
2005 (12) |
2006 (12) |
2007 (12) |
% SALES |
|
|
|
|
|
|
PROFIT AND LOSS
ACCOUNT ANALYSIS |
|
|
|
|
|
|
|
|
|
|
SALES |
2.348.600,27 |
2.386.500,83 |
2.238.853,97 |
|
|
|
|
|
|
|
ADDED VALUE |
519.462,84 |
579.977,38 |
597.634,72 |
26,69 |
|
|
|
|
|
|
EBITDA |
90.599,21 |
106.807,66 |
98.730,27 |
4,41 |
|
|
|
|
|
|
EBIT |
8.400,42 |
20.382,50 |
12.007,77 |
0,54 |
|
|
|
|
|
|
NET RESULT |
3.740,26 |
3.795,14 |
2.954,77 |
0,13 |
|
|
|
|
|
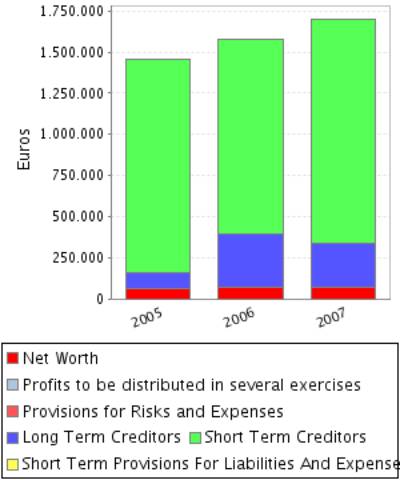
Balance Sheets Items
Analysis
Balance Sheet Comments
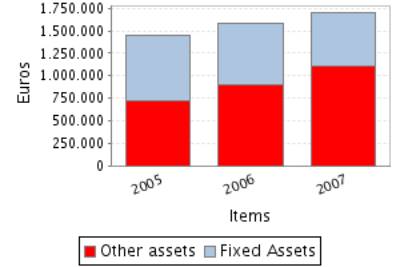
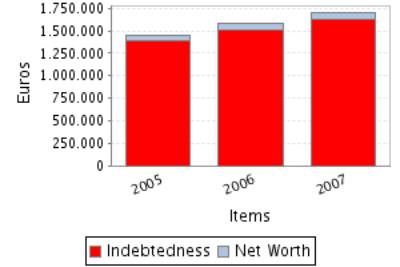
Total assets of the company grew 8,26% between 2005 and 2006.
In spite of the assets’ growth, the fixed assets decreased 7,18%.
This growth has been mainly financed with a debt increase of 8,38%.
Nevertheless the net worth increased 5,77%.
Total assets of the company grew 7,72% between 2006 and 2007.
In spite of the assets’ growth, the fixed assets decreased 12,53%.
This growth has been mainly financed with a debt increase of 7,88%.
Nevertheless the net worth increased 4,25%.
Profit and Loss Account Analysis
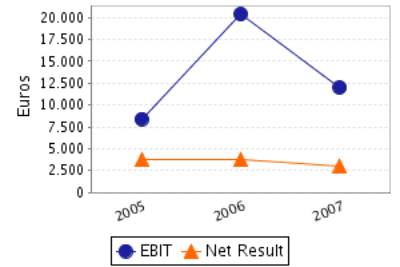
Profit and Loss Account Comments
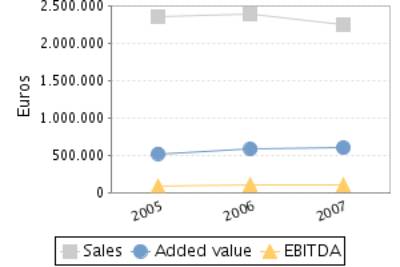
The company’s sales figure grew 1,61% between 2005 and 2006.
The company’s EBIT grew 142,64% between 2005 and 2006.
This evolution implies an increase in the company’s operating
profitability.
The result of these variations is an increase of the company’s Economic
Profitability of 124,11% in the analysed period, being this profitability of
1,29% in the year 2006.
The company’s Net Result grew 1,47% between 2005 and 2006.
This evolution, compared to the EBIT’s performance, implies that the
financial and extraordinary activities have had a negative effect in the
company’s Financial Profitability.
The result of these variations is a reduction of the company’s
profitability of 4,07% in the analysed period, being equal to 5,46% in the year
2006.
The company’s sales figure decreased in 6,19% between 2006 and 2007.
The company’s EBIT decreased in 41,09% between 2006 and 2007.
This evolution implies a reduction in the company’s operating
profitability.
The result of these variations is a decrease of the company’s Economic
Profitability of 45,31% in the analysed period, being this profitability of
0,71% in the year 2007.
The company’s Net Result decreased in 22,14% between 2006 and 2007.
This evolution, compared to the EBIT’s performance, implies that the
financial and extraordinary activities have had a positive effect in the
company’s Financial Profitability.
The result of these variations is a reduction of the company’s
profitability of 25,32% in the analysed period, being equal to 4,08% in the
year 2007.
ANNUAL FINANCIAL REPORT
ADDITIONAL DATA
Source: annual financial report 2007
Results Distribution
Figures given in €
|
DISTRIBUTION
BASE |
DISTRIBUTION TO |
||
|
Profit and Loss |
2.954,77 |
Retained earnings |
295,48 |
|
Carry Over |
0,00 |
Voluntary Reserve |
2.659,29 |
|
Voluntary reserves |
0,00 |
Prior years losses |
0,00 |
|
Reserves |
0,00 |
Carry Over |
0,00 |
|
Other concepts |
0,00 |
Other funds |
0,00 |
|
Total of Amounts to be distributed |
2.954,77 |
Dividends |
0,00 |
|
|
|
Other Applications |
0,00 |
COMPARATIVE SECTOR
ANALYSIS
Values table
Figures expressed in %
|
|
COMPANY (2007) |
SECTOR |
DIFFERENCE |
DIFFERENCE RELATIVE |
|
|
|
|
|
|
BALANCE SHEET
ANALYSIS: % on the total assets |
|
|
|
|
|
|
|
|
|
|
OWN FUNDS |
4,26 |
36,42 |
-32,16 |
-88,29 |
|
|
|
|
|
|
DEBT |
95,74 |
63,58 |
32,16 |
50,58 |
|
|
|
|
|
|
FIXED ASSETS |
35,13 |
34,52 |
0,61 |
1,76 |
|
|
|
|
|
|
|
|
|
|
|
|
|
|
|
|
|
|
COMPANY (2007) |
SECTOR |
DIFFERENCE |
DIFFERENCE RELATIVE |
|
|
|
|
|
|
PROFIT AND LOSS
ACCOUNT ANALYSIS: % on the total operating income |
|
|
|
|
|
|
|
|
|
|
SALES |
99,63 |
98,56 |
1,08 |
1,09 |
|
|
|
|
|
|
ADDED VALUE |
26,60 |
22,31 |
4,28 |
19,19 |
|
|
|
|
|
|
EBIT |
0,53 |
3,35 |
-2,82 |
-84,05 |
|
|
|
|
|
|
NET RESULT |
0,13 |
2,20 |
-2,07 |
-94,03 |
|
|
|
|
|
Sector Composition
Compared sector (NACE): 524
Number of companies: 14770
Size (Sales Figure) : 0 - 2.800.000,00
Euros
Comments on the sectorial
comparative
Compared to its sector the assets of the companies show a greater
proportion of fixed assets. Specifically the difference with the sector average
is 0,61% , which means a relative difference of 1,76% .
In liabilities composition the company appeals on a wider scale to self
financing, being the proportion of net worth of 32,16% inferior, which means a
relative difference of 88,29% 32,16% more than the sector, which means a
difference of 50,58% .
The proportion that the sales mean to the company’s total ordinary
income is 99,63%, 1,08% higher than in the sector, which means a relative
difference of 1,09% .
The company’s EBIT was positive and was 0,53% with regard to the total
ordinary income, 2,82% less than the sector, which means a relative difference
of 84,05% .
The company’s capacity to generate operating income is equal to that of
the sector as its ratio EBIT/Sales is also equal.
The company’s net result was positive and equal to 0,13% with regard to
the total ordinary income, 2,07% less than the sector, which means a relative
difference of 94,03% .
The financial and extraordinary results and the tax impact have had a
negative impact on the Net result in the company with a worse behaviour than in
the sector; as a consequence, the company shows a worse Net Result/EBIT ratio
(REBEmpresa vs. REBSector).
ADDRESSES
Current Legal Seat Address:
STREET DOCTOR ALLART, 25 - 27
38003
SANTA CRUZ DE TENERIFE TENERIFE
Characteristics
of the current address
Type of premises: store
Local Situation: main
Branches 
|
STREET |
POSTAL CODE |
TOWN |
PROVINCE |
|
PASEO IMPERIAL 10 12 |
28005 |
MADRID |
Madrid |
|
STREET GAZTAMBIDE-CARRERA 14 |
31500 |
TUDELA |
Navarra |
|
PASEO ZORRILLA 66 |
47006 |
VALLADOLID |
Valladolid |
|
STREET MARCELO USERA 40 |
28026 |
MADRID |
Madrid |
|
STREET BRAVO MURILLO 145 |
28020 |
MADRID |
Madrid |
|
STREET DE HUNGRIA 8 |
28943 |
FUENLABRADA |
Madrid |
6 branches registered
CORPORATE STRUCTURE
ADMINISTRATIVE LINKS
Main Board members, Directors and Auditor ![]()
|
POSITION |
SURNAMES AND
NAME |
APPOINTMENT DATE |
|
SOLE ADMINISTRATOR |
LALWANI PRIMLANI SURESH HARIRAM |
03/06/2003 |
FINANCIAL LINKS
|
|
BUSINESS NAME |
CIF / COUNTRY |
% |
SOURCE |
DATA INF. |
|
|
LALWANI PRIMLANI SURESH H |
|
Indet. |
OWN SOURCES |
18/09/2008 |
CREDIT INFORMATION
Constitution Date: 04/04/2003
Business activity 
Activity: Retail sale of clothes
NACE Code: 5242
NACE Activity: Retail sale of
clothing
Business: COMERCIO
IMPORTADOR-EXPORTADOR, FABRICACION, ALMACENAMIENTO, DISTRIBUCION Y VENTA AL
MAYOR Y AL DETALLE Y LA REPRESENTACION DE TODA CLASE DE PERSONAS FISICAS O
JURIDICAS COMERCIALES
Employees 
Number of total employees: 15 (2008)
COMMERCIAL OPERATIONS 
PURCHASES
Payments (estimated):
Imports from: ASIA
SALES
Collection (estimated):
National Distribution: 100%
Banks
|
ENTITY |
BRANCH |
ADDRESS |
TOWN OR CITY |
PROVINCE |
|
BANCO POPULAR
ESPAÑOL, S.A. |
|
|
|
|
1 bank entities registered
LEGAL STRUCTURE
Constitution Data
Register Date: 04/04/2003
Register town: Tenerife
Announcement number: 222768
Register Data:
Volume 2451, Book 0, Folio 146, Section 8, Sheet 30915
Legal form: LIMITED LIABILITY COMPANY
Social Capital: 60.000 €
Current Legal Form: LIMITED LIABILITY
COMPANY
Current Capital: 60.000,00 €
Legal Aspects
Obligation to fill in Financial
Statements: YES
Chamber census: YES (2006)
Listed on a Stock Exchange: NO
B.O.R.M.E.(Official Companies
Registry Gazette) 
Other Proceedings published
|
PROCEEDINGS |
DATE |
NOTICE NUM. |
TRADE REG. |
|
Registration of
accounts (2007) Individual |
26/08/2008 |
328593 |
Tenerife |
|
Registration of
accounts (2006) Individual |
03/10/2007 |
737772 |
Tenerife |
|
Registration of
accounts (2005) Individual |
18/09/2006 |
478936 |
Tenerife |
|
Registration of
accounts (2004) Individual |
18/09/2006 |
472248 |
Tenerife |
|
Registration of
accounts (2003) Individual |
04/10/2004 |
540810 |
Tenerife |
FINANCIAL INFORMATION
The information on the last account contained in this report is
extracted from the Mercantile Register file of the legal address of the Company
and dated 23/09/2008.
BALANCE SHEET
Assets
Figures given in €
|
|
31/12/2005 (12) |
31/12/2006 (12) |
31/12/2007 (12) |
|
A) DUE FROM SHAREHOLDERS FOR UNCALLED CAPITAL |
|
|
|
|
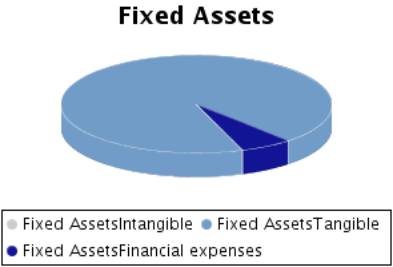
B) FIXED ASSETS |
735.351,66 |
682.522,11 |
596.988,95 |
|
I. Incorporation costs |
|
|
|
|
II. Intangible fixed assets |
|
490,00 |
490,00 |
|
III. Tangible fixed assets |
697.947,76 |
644.628,21 |
559.095,05 |
|
IV. Financial fixed assets |
37.403,90 |
37.403,90 |
37.403,90 |
|
V.Owners equity |
|
|
|
|
VI.Long term trade liabilities |
|
|
|
|
C) DEFERRED EXPENSES |
|
|
|
|
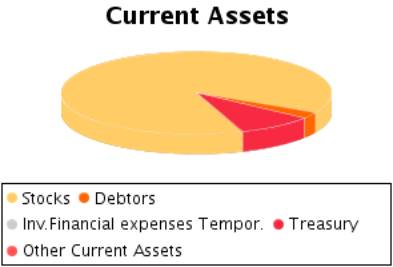
D) CURRENT ASSETS |
721.842,68 |
895.066,81 |
1.102.325,20 |
|
I. Shareholders by required outlays |
|
|
|
|
II. Stocks |
405.382,90 |
594.401,10 |
974.729,29 |
|
III. Debtors |
158.201,94 |
203.496,25 |
27.664,33 |
|
IV. Temporary financial investment |
|
|
|
|
V. Short-term own shares |
|
|
|
|
VI. Treasury |
158.257,84 |
97.169,46 |
99.931,58 |
|
VII. Periodification adjustments |
|
|
|
|
ASSETS (A + B + C + D) |
1.457.194,34 |
1.577.588,92 |
1.699.314,15 |
Assets composition
Liabilities
Figures given in €
|
|
31/12/2005 (12) |
31/12/2006 (12) |
31/12/2007 (12) |
|
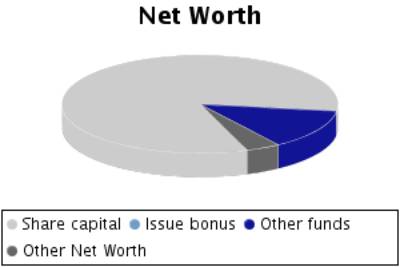
A) SHAREHOLDERS EQUITY |
65.716,95 |
69.512,09 |
72.466,86 |
|
I. Share capital |
60.000,00 |
60.000,00 |
60.000,00 |
|
II. Issue bonus |
|
|
|
|
III.Revaluation reserve |
|
|
|
|
IV.Reserves |
1.976,69 |
5.716,95 |
9.512,09 |
|
Capital adjustments in Euros |
|
|
|
|
Sundry reserves |
1.976,69 |
5.716,95 |
9.512,09 |
|
V.Results from previous years |
|
|
|
|
VI.Profit and Losses |
3.740,26 |
3.795,14 |
2.954,77 |
|
VII.Dividend paid during the year |
|
|
|
|
VIII.Own shares for capital reduction |
|
|
|
|
B) DEFERRED INCOME |
|
|
|
|
C) PROVISIONS FOR LIABILITIES AND EXPENSES |
|
|
|
|
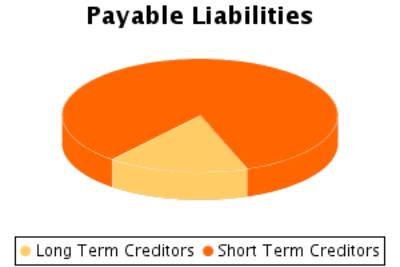
D) LONG TERM LIABILITIES |
91.344,84 |
325.654,50 |
269.278,53 |
|
E) SHORT TERM LIABILITIES |
1.300.132,55 |
1.182.422,33 |
1.357.568,76 |
|
F) SHORT TERM PROVISIONS FOR LIABILITIES AND
EXPENSES |
|
|
|
|
LIABILITIES (A + B + C + D + E + F) |
1.457.194,34 |
1.577.588,92 |
1.699.314,15 |
Liabilities
Composition
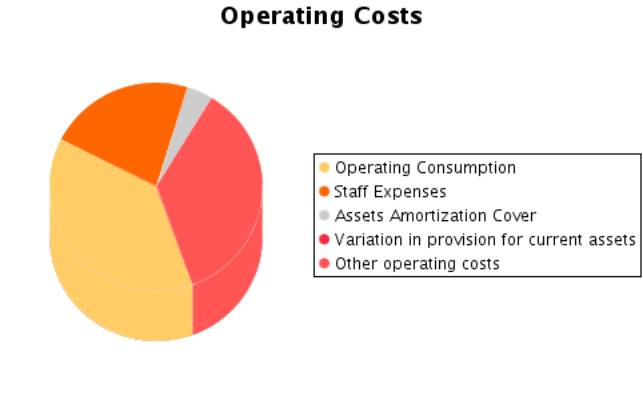
PROFIT AND LOSS ACCOUNT
Itams of the Profit and Loss Account
Figures given in €
|
|
31/12/2005 (12) |
31/12/2006 (12) |
31/12/2007 (12) |
|
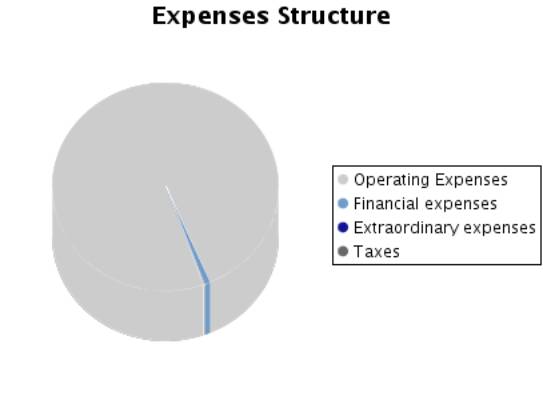
A) EXPENSES (A.1 a A.15) |
2.356.681,06 |
2.391.022,90 |
2.255.949,04 |
|
A.1.Operating costs |
1.101.286,85 |
1.029.056,08 |
850.896,75 |
|
A.2. Labour cost |
428.863,63 |
473.169,72 |
498.904,45 |
|
Wages |
332.812,61 |
363.765,20 |
385.064,70 |
|
Social security expenses |
96.051,02 |
109.404,52 |
113.839,75 |
|
A.3. Assets depreciation |
82.198,79 |
86.425,16 |
86.722,50 |
|
A.4. Variation in provision for current assets |
|
|
|
|
A.5. Other operating costs |
727.850,58 |
777.819,50 |
798.561,50 |
|
A.I. OPERATING RESULT (B.1-A.1-A.2-A.3-A.4-A.5) |
8.400,42 |
20.382,50 |
12.007,77 |
|
A.6.Financial expenses and similar |
5.707,90 |
11.229,46 |
13.364,22 |
|
Debts with related companies |
|
|
|
|
Debts with associated companies |
|
|
|
|
Other companies debts By debts with third parties and similar expenses |
5.707,90 |
11.229,46 |
13.364,22 |
|
Losses from financial investments |
|
|
|
|
A.7. Variation in financial investment provision |
|
|
|
|
A.8.Negative
exchange difference |
9.075,25 |
10.634,78 |
6.514,69 |
|
A.II.POSITIVE
FINANCIAL RESULTS (B.2+B.3-A.6-A.7-A.8) |
|
|
|
|
A.III.PROFIT
FROM ORDINARY ACTIVITIES (A.I+A.II-B.I-B.II) |
3.035,29 |
6.199,95 |
3.823,96 |
|
A.9. Variation
in provision in fixed assets |
|
|
|
|
A.10. Losses in fixed assets |
|
|
|
|
A.11. Losses from own shares and bonds |
|
|
|
|
A.12. Extraordinary charges |
95,09 |
1.061,71 |
|
|
A.13.Other
exercises’ expenses and losses |
|
|
|
|
A.IV.POSITIVE EXTRAORDINARY
RESULT (B.4+B.5+B.6+B.7+B.8-A.9-A.10-A.11-A.12-A.13) |
2.307,94 |
|
115,74 |
|
A.V.PROFIT
BEFORE TAXES (A.III+A.IV-B.III-B.IV) |
5.343,23 |
5.421,63 |
3.939,70 |
|
A.14.Corporate
Taxes |
1.602,97 |
1.626,49 |
984,93 |
|
A.15. Other
taxes |
|
|
|
|
A.VI.EXERCISE
RESULT (PROFIT) (A.V-A.14-A.15) |
3.740,26 |
3.795,14 |
2.954,77 |
|
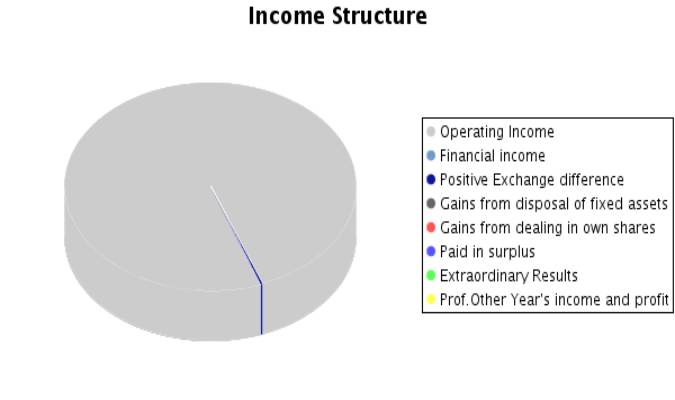
B) INCOMES (B.1
a B.8) |
2.360.421,32 |
2.394.818,04 |
2.258.903,81 |
|
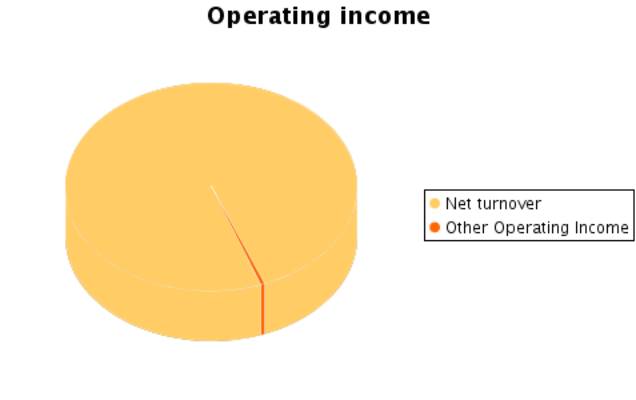
B.1.Operating
income |
2.348.600,27 |
2.386.852,96 |
2.247.092,97 |
|
Turnover |
2.348.600,27 |
2.386.500,83 |
2.238.853,97 |
|
Other operating
income |
|
352,13 |
8.239,00 |
|
B.I.OPERATING
LOSSES (A.1+A.2+A.3+A.4+A.5-B.1) |
|
|
|
|
B.2.Financial Income |
1.901,03 |
0,12 |
22,51 |
|
From affiliated companies |
|
|
|
|
From associated companies |
|
|
|
|
Other |
1.901,03 |
0,12 |
22,51 |
|
Gains from investments |
|
|
|
|
B.3. Positive change difference |
7.516,99 |
7.681,57 |
11.672,59 |
|
B.II. NEGATIVE FINANCIAL RESULTS
(A.6+A.7+A.8-B.2-B.3) |
5.365,13 |
14.182,55 |
8.183,81 |
|
B.III.LOSSES FROM ORDINARY ACTIVITIES
(B.I+B.II-A.I-A.II) |
|
|
|
|
B.4.B.9. Gains
from disposal of fixed assets |
|
|
|
|
B.5.Gains from
dealing in own shares |
|
|
|
|
B.6. Paid in
surplus |
|
|
|
|
B.7.
Extraordinary income |
2.403,03 |
283,39 |
115,74 |
|
B.8.Other year’s
income and profits |
|
|
|
|
B.IV.NEGATIVE
EXTRAORDINARY LOSSES (A.9+A.10+A.11+A.12+A.13-B.4-B.5-B.6-B.7-B.8) |
|
778,32 |
|
|
B.V.LOSS BEFORE
TAXES (B.III+B.IV-A.III-A.IV) |
|
|
|
|
B.VI.EXERCISE RESULTS
(LOSS) (B.V+A.14+A.15) |
|
|
|
Composition of the
Profit and Loss Account
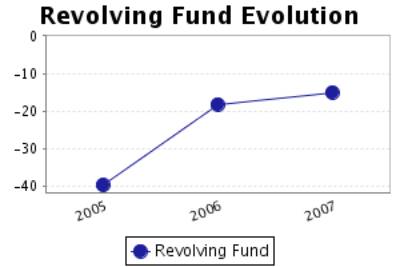
FINANCIAL BALANCE
Here the Main Capital Amounts of the company and the Revolving Fund
Evolution are analysed.
Financial Balance Table
Figures given in €
|
|
31/12/2005 (12) |
% |
31/12/2006 (12) |
% |
31/12/2007 (12) |
% |
|
A) DUE FROM
SHAREHOLDERS FOR UNCALLED CAPITAL |
|
|
|
|
|
|
|
B) FIXED ASSETS |
735.351,66 |
50,46 |
682.522,11 |
43,26 |
596.988,95 |
35,13 |
|
C) DEFERRED
EXPENSES |
|
|
|
|
|
|
|
D) CURRENT
ASSETS |
721.842,68 |
49,54 |
895.066,81 |
56,74 |
1.102.325,20 |
64,87 |
|
ASSETS (A + B +
C + D) |
1.457.194,34 |
|
1.577.588,92 |
|
1.699.314,15 |
|
|
|
||||||
|
A) SHAREHOLDERS
EQUITY |
65.716,95 |
4,51 |
69.512,09 |
4,41 |
72.466,86 |
4,26 |
|
B) DEFERRED
INCOME |
|
|
|
|
|
|
|
C) PROVISIONS
FOR LIABILITIES AND EXPENSES |
|
|
|
|
|
|
|
D) LONG TERM
LIABILITIES |
91.344,84 |
6,27 |
325.654,50 |
20,64 |
269.278,53 |
15,85 |
|
E) SHORT TERM
LIABILITIES |
1.300.132,55 |
89,22 |
1.182.422,33 |
74,95 |
1.357.568,76 |
79,89 |
|
F) SHORT TERM
PROVISIONS FOR LIABILITIES AND EXPENSES |
|
|
|
|
|
|
|
LIABILITIES (A + B + C + D + E + F) |
1.457.194,34 |
|
1.577.588,92 |
|
1.699.314,15 |
|
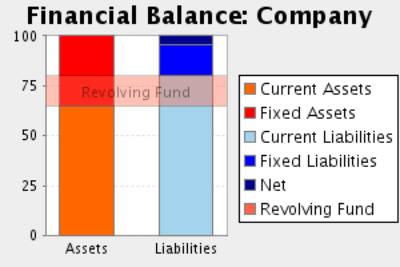
Financial Balance
Composition
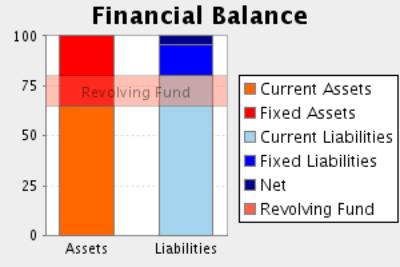
Comments on Financial Balance
In the 2005, the assets of the company were formed in 50,46% of Fixed
Assets and in 49,54% of Current Assets.This assets were financed in 4,51% with
own capitals, and in 6,27% with long term debt and in 89,22% with current
liabilities.
The result of this financial structure is a negative turnover fund of
-578.289,87 Euros, which is equivalent to -39,69% proportion of the company’s
total assets.
In the 2006, the assets of the company were formed in 43,26% of Fixed
Assets and in 56,74% of Current Assets.This assets were financed in 4,41% with
own capitals, and in 20,64% with long term debt and in 74,95% with current
liabilities.
The result of this financial structure is a negative turnover fund of
-287.355,52 Euros, which is equivalent to -18,21% proportion of the company’s
total assets.
This measure has increased with respect to the previous exercise in
50,31% having also increased its proportion with respect to the total assets of
the company.
In the 2007, the assets of the company were formed in 35,13% of Fixed
Assets and in 64,87% of Current Assets.This assets were financed in 4,26% with
own capitals, and in 15,85% with long term debt and in 79,89% with current
liabilities.
The result of this financial structure is a negative turnover fund of
-255.243,56 Euros, which is equivalent to -15,02% proportion of the company’s
total assets.
This measure has increased with respect to the previous exercise in
11,17% having also increased its proportion with respect to the total assets of
the company.
RATIOS
Main Ratios
|
|
31/12/2005 (12) |
31/12/2006 (12) |
31/12/2007 (12) |
|
STRUCTURAL RATIOS |
|
|
|
|
Management fund |
-578.289,87 |
-287.355,52 |
-255.243,56 |
|
Indebtedness (%) |
95,49 |
95,59 |
95,74 |
|
External Funds on Net Worth |
21,17 |
21,70 |
22,45 |
|
GENERAL ACTIVITY RATIO |
|
|
|
|
Turnover Increase (%) |
54,85 |
1,61 |
-6,19 |
|
Added value growth (%) |
55,49 |
11,65 |
3,04 |
|
Cash Flow |
85.939,05 |
90.220,30 |
89.677,27 |
|
Labour Productivity |
1,21 |
1,23 |
1,20 |
|
Assets turnover |
1,61 |
1,51 |
1,32 |
|
Breakdown Point |
2.332.782,89 |
2.351.022,84 |
2.227.767,19 |
|
Security Margin of the Breakdown Point (%) |
0,67 |
1,50 |
0,86 |
|
ACTIVITY RATIOS |
|
|
|
|
Average Collection Period |
24 |
31 |
4 |
|
Inventory Turnover Period |
62 |
90 |
157 |
|
SOLVENCY RATIOS |
|
|
|
|
Payback Capacity |
0,06 |
0,06 |
0,06 |
|
Assets Guarantee |
1,05 |
1,05 |
1,04 |
|
Short Term Debts Proportion (%) |
93,44 |
78,41 |
83,45 |
|
Interest Coverage |
12,98 |
7,32 |
5,83 |
|
LIQUIDITY RATIOS |
|
|
|
|
Current Ratio |
0,56 |
0,76 |
0,81 |
|
Immediate liquidity |
0,12 |
0,08 |
0,07 |
|
Sales on Current Assets |
1.171 |
960 |
731 |
Results Analysis
Ratios
|
|
31/12/2005 (12) |
31/12/2006 (12) |
31/12/2007 (12) |
|
Economic profitability (%) |
0,58 |
1,29 |
0,71 |
|
Operating Profitability (%) |
0,36 |
0,85 |
0,54 |
|
Equity gearing |
8,01 |
6,90 |
7,47 |
|
Financial profitability (%) |
5,69 |
5,46 |
4,08 |
|
General Profitability (%) |
0,16 |
0,16 |
0,13 |
Comments on the
Results Analysis Ratios
The economic profitability in the year2006 achieved a 1,29% positive
level, due to a 0,85% economic margin and to an assets turnover of1,51%.
The economic profitability in the year has increased from 0,58% up to 1,29%.
This growth is due to the economic margin increase, from 0,36% to the current
0,85% in spite of the assets turnover drop, which have decreased from 1,61 to
1,51%.
Financial profitability on 2006 achieved a 5,46%.
The company’s financial structure has instigated its economic
profitability with an indebtedness level of 6,90.
The general profitability on 2006 achieved a 0,16%.
The economic profitability in the year2007 achieved a 0,71% positive
level, due to a 0,54% economic margin and to an assets turnover of1,32%.
The economic profitability in the year has reduced from 1,29% up to
0,71% of2007, even if it remains positive. This fall is due to the decrease in
operating profitability, that has passe from 0,85% to 0,54%, as assets turnover
whose index has passed from 1,51 to 1,32%.
Financial profitability on 2007 achieved a 4,08%.
The company’s financial structure has instigated its economic
profitability with an indebtedness level of 7,47.
The general profitability on 2007 achieved a 0,13%.
SECTORIAL ANÁLYSIS
Large Capital Amounts and Financial Balance
Figures given in %
|
|
COMPANY (2007) |
SECTOR |
DIFFERENCE |
DIFFERENCE RELATIVE |
|
|
|
|
|
|
ASSETS |
|
|
|
|
|
|
|
|
|
|
A) DUE FROM
SHAREHOLDERS FOR UNCALLED CAPITAL |
|
0,09 |
|
|
|
|
|
|
|
|
B) FIXED ASSETS |
35,13 |
34,52 |
0,61 |
1,75 |
|
|
|
|
|
|
C) DEFERRED
EXPENSES |
|
0,44 |
|
|
|
|
|
|
|
|
D) CURRENT ASSETS |
64,87 |
64,94 |
-0,07 |
-0,11 |
|
|
|
|
|
|
ASSETS (A + B + C + D) |
100 |
100 |
|
|
|
|
|
|
|
|
|
|
|
|
|
|
|
|
|
|
|
|
COMPANY (2007) |
SECTOR |
DIFFERENCE |
DIFFERENCE RELATIVE |
|
|
|
|
|
|
LIABILITIES |
|
|
|
|
|
|
|
|
|
|
A) SHAREHOLDERS
EQUITY |
4,26 |
36,15 |
-31,89 |
-88,21 |
|
|
|
|
|
|
B) DEFERRED INCOME |
|
0,28 |
|
|
|
|
|
|
|
|
C) PROVISIONS
FOR LIABILITIES AND EXPENSES |
|
0,08 |
|
|
|
|
|
|
|
|
D) LONG TERM
LIABILITIES |
15,85 |
16,22 |
-0,37 |
-2,30 |
|
|
|
|
|
|
E) SHORT TERM
LIABILITIES |
79,89 |
47,24 |
32,65 |
69,12 |
|
|
|
|
|
|
F) SHORT TERM
PROVISIONS FOR LIABILITIES AND EXPENSES |
|
0,03 |
|
|
|
|
|
|
|
|
LIABILITIES (A +
B + C + D + E + F) |
100 |
100 |
|
|
|
|
|
|
|
Sectorial Financial
Balance Comparison
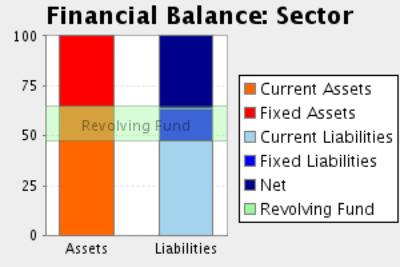
Comments to the Sectorial Analysis
In the 2007, the assets of the company were formed in 35,13% of fixed
assets and in 64,87Current Assets % In the sector, the proportion of fixed
assets was of 35,06%, 0,21% inferior, and the proportion of current assets was
of 64,94%, 0,11% superior.
The assets were financed in the company in 4,26% with own capitals , in
15,85% with fixed liabilities and in 79,89% with current liabilities In the
sector, the self financing represented 36,42%, 88,30% superior. On the other
hand the long term debts represented in the sector an average of 16,30%
financing, with a relative difference of 2,78% favourable to the sectorAnd,
short term liabilities represented in the sector an average of 47,27%
financing, with a relative difference of 69,00% in favour of the company
The result of this company’s financial structure is a turnover fund that
represents -15,02% of the total assets; in the sector, this same proportion is
17,67%, therefore, we can say that the company’s turnover fund is 185,00%
smaller than the sector one.
Analytical Account of Results
Figures given in %
|
|
COMPANY (2007) |
SECTOR |
DIFFERENCE |
DIFFERENCE RELATIVE |
|
Turnover |
99,63 |
98,56 |
1,07 |
1,09 |
|
Other operating income |
0,37 |
1,44 |
-1,07 |
-74,38 |
|
Production Value |
100,00 |
100,00 |
0,00 |
0,00 |
|
Operating expenses |
37,87 |
65,98 |
-28,11 |
-42,60 |
|
Other operation expenses |
35,54 |
11,71 |
23,83 |
203,60 |
|
Added value |
26,60 |
22,31 |
4,29 |
19,21 |
|
Labour cost |
22,20 |
16,94 |
5,26 |
31,07 |
|
Gross Economic
Result |
4,39 |
5,38 |
-0,99 |
-18,34 |
|
Assets
depreciation |
3,86 |
1,95 |
1,91 |
98,36 |
|
Variation in
provision for current assets and bad debt losses |
|
0,08 |
|
|
|
Net Economic
Result |
0,53 |
3,35 |
-2,82 |
-84,18 |
|
Financial income |
0,52 |
0,27 |
0,25 |
91,18 |
|
Financial
Charges |
0,88 |
1,02 |
-0,14 |
-14,06 |
|
Variation in
financial investment provision |
|
-0,01 |
|
|
|
Ordinary
Activities Result |
0,17 |
2,60 |
-2,44 |
-93,47 |
|
Extraordinary income |
0,01 |
0,65 |
-0,64 |
-98,45 |
|
Extraordinary charges |
|
0,18 |
|
|
|
Variation in provision in fixed assets |
|
0,00 |
|
|
|
Results before Taxes |
0,18 |
3,07 |
-2,89 |
-94,13 |
|
Corporate taxes |
0,04 |
0,87 |
-0,83 |
-95,39 |
|
Net Result |
0,13 |
2,20 |
-2,07 |
-94,09 |
|
Assets depreciation |
3,86 |
1,95 |
1,91 |
98,36 |
|
Change of Provisions |
|
0,08 |
|
|
|
Net Self-Financing |
3,99 |
4,22 |
-0,23 |
-5,50 |
Main Ratios
|
|
COMPANY (2007) |
PTILE25 |
PTILE50 |
PTILE75 |
|
STRUCTURAL RATIOS |
|
|
|
|
|
Management fund |
-255.243,56 |
2,39 |
38,76 |
122,00 |
|
Indebtedness (%) |
95,74 |
51,81 |
72,24 |
85,56 |
|
External Funds on Net Worth |
22,45 |
1,08 |
2,60 |
5,92 |
|
GENERAL ACTIVITY
RATIO |
|
|
|
|
|
Turnover Increase (%) |
-6,19 |
-7,40 |
2,02 |
12,48 |
|
Added value growth (%) |
3,04 |
-6,86 |
3,92 |
16,01 |
|
Cash Flow |
89.677,27 |
5,65 |
14,32 |
33,59 |
|
Labour Productivity |
1,20 |
1,13 |
1,26 |
1,48 |
|
Assets turnover |
1,32 |
0,99 |
1,54 |
2,25 |
|
Breakdown Point |
2.227.767,19 |
212.942,14 |
423.543,09 |
825.409,54 |
|
Security Margin
of the Breakdown Point (%) |
0,86 |
3,20 |
7,60 |
14,15 |
|
ACTIVITY RATIOS |
|
|
|
|
|
Average
Collection Period |
4 |
4 |
25 |
69 |
|
Inventory
Turnover Period |
157 |
31 |
75 |
147 |
|
SOLVENCY RATIOS |
|
|
|
|
|
Payback Capacity |
0,06 |
0,04 |
0,07 |
0,15 |
|
Assets Guarantee |
1,04 |
1,16 |
1,37 |
1,92 |
|
Short Term Debts
Proportion (%) |
83,45 |
67,13 |
92,30 |
100,00 |
|
Interest
Coverage |
5,83 |
1,28 |
3,91 |
12,88 |
|
LIQUIDITY RATIOS |
|
|
|
|
|
Current Ratio |
0,81 |
1,02 |
1,30 |
1,92 |
|
Immediate liquidity |
0,07 |
0,04 |
0,17 |
0,50 |
|
Sales on Current Assets |
731 |
525 |
811 |
1.192 |
Results Analysis
Ratios
|
|
COMPANY (2007) |
PTILE25 |
PTILE50 |
PTILE75 |
|
Economic profitability (%) |
0,71 |
1,59 |
3,77 |
7,18 |
|
Operating Profitability (%) |
0,54 |
1,04 |
2,50 |
4,84 |
|
Equity gearing |
7,47 |
1,42 |
2,40 |
4,58 |
|
Financial profitability (%) |
4,08 |
2,81 |
7,77 |
16,55 |
|
General Profitability (%) |
0,13 |
0,47 |
1,24 |
2,82 |
NOTES
Linked by its board members to MOMU WOMAN SL
(B38768958).
FOREIGN EXCHANGE
RATES
|
Currency |
Unit
|
Indian Rupees |
|
US Dollar |
1 |
Rs.46.43 |
|
UK Pound |
1 |
Rs.85.38 |
|
Euro |
1 |
Rs.67.95 |
RATING
EXPLANATIONS
|
RATING |
STATUS |
PROPOSED CREDIT LINE |
|
|
>86 |
Aaa |
Possesses an extremely sound financial base with the strongest
capability for timely payment of interest and principal sums |
Unlimited |
|
71-85 |
Aa |
Possesses adequate working capital. No caution needed for credit
transaction. It has above average (strong) capability for payment of interest
and principal sums |
Large |
|
56-70 |
A |
Financial & operational base are regarded healthy. General unfavourable
factors will not cause fatal effect. Satisfactory capability for payment of
interest and principal sums |
Fairly Large |
|
41-55 |
Ba |
Overall operation is considered normal. Capable to meet normal
commitments. |
Satisfactory |
|
26-40 |
B |
Unfavourable & favourable factors carry similar weight in credit
consideration. Capability to overcome financial difficulties seems
comparatively below average. |
Small |
|
11-25 |
Ca |
Adverse factors are apparent. Repayment of interest and principal sums
in default or expected to be in default upon maturity |
Limited with
full security |
|
<10 |
C |
Absolute credit risk exists. Caution needed to be exercised |
Credit not
recommended |
|
NR |
In view of the lack of information, we have no basis upon which to
recommend credit dealings |
No Rating |
|
This score serves as a reference to assess SC’s credit risk
and to set the amount of credit to be extended. It is calculated from a composite
of weighted scores obtained from each of the major sections of this report. The
assessed factors and their relative weights (as indicated through %) are as
follows:
Financial
condition (40%) Ownership
background (20%) Payment
record (10%)
Credit history
(10%) Market trend
(10%) Operational
size (10%)