![]()
MIRA INFORM REPORT
|
Report Date : |
18.08.2011 |
IDENTIFICATION DETAILS
|
Name : |
HUSKY INJECTION MOLDING SYSTEMS SINGAPORE
PTE. LTD. |
|
|
|
|
Registered Office : |
19 Changi South Street 1 Singapore 486779 |
|
|
|
|
Country : |
Singapore |
|
|
|
|
Financials (as on) : |
31.12.2009 |
|
|
|
|
Date of Incorporation : |
04.10.1994 |
|
|
|
|
Com. Reg. No.: |
199407150k |
|
|
|
|
Legal Form : |
Limited Private Company |
|
|
|
|
Line of Business : |
Manufacture of dies, moulds, tools, jigs and fixtures |
RATING & COMMENTS
|
MIRA’s Rating : |
Ca |
|
RATING |
STATUS |
PROPOSED CREDIT LINE |
|
|
11-25 |
Ca |
Adverse factors are apparent. Repayment of interest and principal sums
in default or expected to be in default upon maturity |
Limited with
full security |
|
Status : |
Poor |
|
Payment
Behaviour : |
Unknown |
|
Litigation : |
Exists |
NOTES :
Any query related to this report can be made
on e-mail : infodept@mirainform.com
while quoting report number, name and date.
ECGC Country Risk Classification List – March 31st, 2011
|
Country Name |
Previous Rating (31.12.2010) |
Current Rating (31.03.2011) |
|
Singapore |
a1 |
a1 |
|
Risk Category |
ECGC
Classification |
|
Insignificant |
A1 |
|
Low |
A2 |
|
Moderate |
B1 |
|
High |
B2 |
|
Very High |
C1 |
|
Restricted |
C2 |
|
Off-credit |
D |
Executive
Summary
|
: |
HUSKY INJECTION MOLDING
SYSTEMS SINGAPORE PTE. LTD. |
|
|
Registration No |
: |
199407150K |
|
Date of Registration |
: |
04/10/1994 |
|
Former Name |
: |
NA |
|
Date of Change of Name |
: |
NA |
|
Type of Company |
: |
LIMITED PRIVATE COMPANY |
|
Registered Address |
: |
19 CHANGI SOUTH STREET 1
SINGAPORE 486779 |
|
Date of Change of Address |
: |
08/12/2006 |
|
Contact No. |
: |
6276 8616 |
|
Fax No. |
: |
6276 8656 |
|
Website |
: |
NA |
|
Registered Activities |
: |
1. MANUFACTURE OF DIES, MOULDS,
TOOLS, JIGS AND FIXTURES MANUFACTURE OF INJECTION
MOULDS 2. OTHER BUSINESS SUPPORT
SERVICES ACTIVITIES NEC (EG ADMINISTRATION OF LOYALTY PROGRAMMES) SALES, TECHNICAL &
MARKETING SUPPORT & ASSISTANCE TO HOLDING COMPANY |
|
Issued Ordinary Capital* |
: |
$10,404,986.00 SINGAPORE,
DOLLARS ,NO. OF SHARE : 10,404,986 |
|
Issued Preference Capital |
: |
NA |
|
Paid-Up Ordinary Capital |
: |
$10,404,986.00 SINGAPORE,
DOLLARS |
|
Paid-Up Preference
Capital |
: |
NA |
|
* Number of Shares includes
number of Issued Treasury Shares |
||
|
Issued Treasury Capital |
: |
NA |
|
Paid-Up Treasury Capital |
: |
NA |
|
No. of Local Subsidiaries |
: |
NA |
|
No. of Local Associates |
: |
NA |
|
Auditor |
: |
ERNST & YOUNG LLP |
|
Bankers / Financiers |
: |
ROYAL BANK OF CANADA |
|
Turnover |
: |
SGD - SIN 144,314,112.00
(FY2009) |
|
Net Worth |
: |
SGD - SIN 27,712,900.00
(FY2009) |
|
No. of Bank Charges |
: |
1 |
|
No. of Litigation Suits |
: |
1 |
|
S1000 / SME 500 / FG50
Ranking |
: |
|
|
Compounded Annual Growth
Rate (CAGR) |
: |
22.94% (3
years) |
Credit Recommendation
|
Recommended Credit Line |
: |
No Recommendation |
SHAREHOLDER DETAILS
|
: |
HUSKY INJECTION MOLDING SYSTEMS LTD |
|
|
SHAREHOLDER ID |
: |
T08UF0159A |
|
NATIONALITY |
: |
CANADA |
|
ADDRESS |
: |
500 QUEEN STREET S BOLTON, ONTARIO, CANADA L7E 5S5 |
|
NO. OF ORD SHARES |
: |
10,404,986 |
|
% OF SHAREHOLDING |
: |
100% |
|
CURRENCY |
: |
SINGAPORE, DOLLARS |
OFFICER DETAILS
|
: |
ISAAC
CHENG |
|
|
ADDRESS |
: |
12TH
FL., FLAT F, BLK 12, SCENEWAY GDN., LAM TIN KLN, HONG KONG |
|
POSITION |
: |
DIRECTOR |
|
DATE OF APPT |
: |
04/11/2004 |
|
NATIONALITY |
: |
CANADIAN |
|
I/C PASSPORT |
: |
BC265529 |
|
|
||
|
NAME |
: |
DINESH
S. BUDAPANAHALLI |
|
ADDRESS |
: |
130
TANJONG RHU ROAD #03-03 SINGAPORE 436918 |
|
POSITION |
: |
DIRECTOR |
|
DATE OF APPT |
: |
29/02/2008 |
|
NATIONALITY |
: |
AMERICAN |
|
I/C PASSPORT |
: |
G5631473W |
|
|
||
|
NAME |
: |
MICHAEL
PATRICK MCKENDRY |
|
ADDRESS |
: |
6
PARK MEADOW DRIVE, CALEDON ONTARIO CANADA L4N 1E9 |
|
POSITION |
: |
DIRECTOR |
|
DATE OF APPT |
: |
31/07/2008 |
|
NATIONALITY |
: |
CANADIAN |
|
I/C PASSPORT |
: |
JQ101191 |
|
|
||
|
NAME |
: |
ANNE
CHOO |
|
ADDRESS |
: |
34
JALAN REBANA FABER GARDEN SINGAPORE 577003 |
|
POSITION |
: |
SECRETARY |
|
DATE OF APPT |
: |
31/12/2008 |
|
NATIONALITY |
: |
SINGAPORE
CITIZEN |
|
I/C PASSPORT |
: |
S1256587I |
|
|
||
|
NAME |
: |
JUSTINA
SOON HSU-LIN |
|
ADDRESS |
: |
50
BUKIT BATOK STREET 31 #15-03 MADEIRA, THE SINGAPORE 659442 |
|
POSITION |
: |
SECRETARY |
|
DATE OF APPT |
: |
31/12/2008 |
|
NATIONALITY |
: |
SINGAPORE
CITIZEN |
|
I/C PASSPORT |
: |
S7497243H |
KEY PERSONNEL PROFILE
|
ISAAC CHENG |
|
|
NRIC Number: |
BC265529 |
|
Available Address: |
12TH FL., FLAT F, BLK 12,
SCENEWAY GDN., LAM TIN KLN, HONG KONG |
Current Business Interest
|
No. |
Name |
Position |
Appt Date |
#of Share |
% |
|
HUSKY INJECTION MOLDING
SYSTEMS SINGAPORE PTE. LTD. |
DIRECTOR |
04/11/2004 |
- |
- |
Previous Business
|
No. |
Name |
Status |
Position |
Appt Date |
Last Known
Inactive Date |
|
|
|
|
|
||
Bankruptcy Record
|
Case
No. |
Year |
Date
of Filing |
Petitioner
Name |
Amount |
|
|
|
|
|
Litigation Search – Writ of Summons
|
Court |
Case No. |
Year |
Date
of Filing |
Amount |
Cause
Category |
|
|
|
|
|
|
SUBSIDIARIES AND ASSOCIATE COMPANIES
|
Company |
Shareholdings (%) |
|
|
|
|
|
|
BANKERS/
FINANCIERS
Subject
enjoys a normal banking routine with its bankers. To date, there have been 1
bank charges registered against Subject by its bankers. The charge numbers are:
|
Charge
No. |
: |
C200803730 |
|
|
|
Date
of Registration |
: |
22/04/2008 |
|
|
Chargee |
: |
ROYAL
BANK OF CANADA |
|
|
Amount
Secured and Currency |
: |
All
Monies |
|
|
Address |
: |
3
CHURCH STREET #27-01/08 SAMSUNG HUB SINGAPORE 049483 |
LITIGATION
The following
litigation suits were traced against Subject. Case status is as per available
database. For the latest status of the suit, please obtain the full details of
the suit through Litigation Detail Search (DLIT) offered.
To date, there have been 1 litigation
suits filed against Subject.
The details are as follows:
|
Court |
: |
Magistrate
Court |
|
|
|
Case
No. |
: |
9772 |
|
|
Date
of Filing |
: |
27/04/2007 |
|
|
Amount
|
: |
0.00 |
|
|
Cause |
: |
Tort
- Negligence (Motor Accidents Without Death/ Injury) |
|
|
Case
Status |
: |
CONCLUDED |
|
|
Plaintiff |
: |
INDIAN
BANK |
|
|
Last
Update Date |
: |
25/03/2010 |
COMPLIANCE RECORDS
|
Date of Last AGM |
: |
|
|
Date of Last AR |
: |
01/12/2010 |
|
Date of A/C Laid At Last AGM |
: |
31/12/2009 |
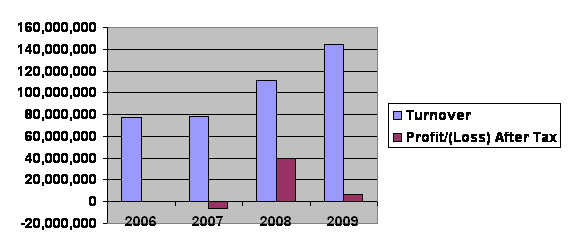
FINANCIAL HIGHLIGHTS
|
Financial Figures |
|||||
|
|
DEC 2009 |
% Change |
DEC 2008 |
JUL 2007 |
JUL 2006 |
|
Currency |
SGD - SIN |
|
SGD - SIN |
SGD - SIN |
SGD - SIN |
|
Profit and Loss Key Figures |
|
|
|
|
|
|
144,314,112 |
29.24 |
111,663,879 |
78,481,919 |
77,669,303 |
|
|
Profit/(Loss) Before Tax |
7,248,391 |
-81.87 |
39,987,764 |
(6,018,531) |
548,447 |
|
Profit After Tax attributable to
Shareholders |
7,048,832 |
-82.37 |
39,986,303 |
(5,775,880) |
220,840 |
|
|
|
|
|
|
|
|
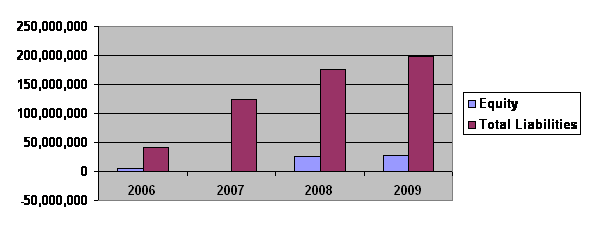
Balance Sheet Key Figures |
|
|
|
|
|
|
Total Assets |
225,859,759 |
12.15 |
201,394,349 |
123,591,719 |
46,091,251 |
|
Current Assets |
53,461,079 |
29.94 |
41,144,388 |
109,704,805 |
44,327,066 |
|
Non Current Assets |
172,398,680 |
7.58 |
160,249,961 |
13,886,914 |
1,764,185 |
|
|
|
|
|
|
|
|
Total Liabilities |
198,146,859 |
12.71 |
175,805,140 |
124,325,752 |
40,733,172 |
|
Current Liabilities |
198,146,859 |
12.71 |
175,805,140 |
124,325,752 |
40,733,172 |
|
Non Current Liabilities |
0 |
NA |
0 |
0 |
0 |
|
|
|
|
|
|
|
|
Shareholders' Funds |
27,712,900 |
8.30 |
25,589,208 |
(734,032) |
5,358,079 |
|
Share Capital |
5,452,843 |
466.37 |
962,763 |
114,065 |
121,219 |
|
Total Reserves |
22,260,057 |
-9.61 |
24,626,445 |
(848,097) |
5,236,860 |
|
|
|
|
|
|
|
FINANCIAL RATIOS
|
|
||||
|
|
DEC
2009 |
DEC 2008 |
JUL
2007 |
JUL
2006 |
|
Growth % |
|
|
|
|
|
29.24 |
42.28 |
1.05 |
NA |
|
|
|
|
|
|
|
|
Profitability |
|
|
|
|
|
Profit Margin (%) |
4.88 |
35.81 |
-7.36 |
0.28 |
|
Return on Equity (%) |
25.44 |
156.26 |
786.87 |
4.12 |
|
Return on Assets (%) |
3.12 |
19.85 |
-4.67 |
0.48 |
|
|
|
|
|
|
|
Leverage |
|
|
|
|
|
Total Debt/Equity (Times) |
7.15 |
6.87 |
-169.37 |
7.60 |
|
Current Debt/Equity (Times) |
7.15 |
6.87 |
0.00 |
7.60 |
|
Long Term Debt To Equity (Times) |
0.00 |
0.00 |
0.00 |
0.00 |
|
Total Asset To Total Equity (Times) |
8.15 |
7.87 |
-168.37 |
8.60 |
|
|
|
|
|
|
|
Asset Management |
|
|
|
|
|
Total Assets Turnover (Times) |
0.64 |
0.55 |
0.64 |
1.69 |
|
Fixed Assets Turnover (Times) |
0.84 |
0.70 |
5.65 |
44.03 |
|
|
|
|
|
|
|
Liquidity |
|
|
|
|
|
Current Ratio (Times) |
0.27 |
0.23 |
0.88 |
1.09 |
FINANCIAL
COMMENTARY
Compound Annual Growth Rate
The company's CAGR is 22.94% (3 years).
CAGR is the year-over-year growth rate of a company over a specified
period. Instead of looking at the average growth rate, CAGR allow users to look
at the annualized growth rate of a company over a given period, a more
indicative measure of growth of a company’s performance over a given period.
Profitability
The company yielded a rate of
net profit on sales of 4.88 per cent in FY09 (FY08: 35.81 per cent). The
company is now able to book in SGD - SIN 0.05 of profit for every SGD - SIN of
sales in FY09, as compared with SGD - SIN 0.36 a year ago.
Liquidity

Current ratio stood at 0.27 times in FY09
(FY08: 0.23 times). This means that the company has SGD - SIN 0.27 of current
assets for every SGD - SIN of current liability incurred.
A minimum figure of 1.0 would be considered the lowest limit that this
figure should reach. Any business that has a current ratio near 1.0 may be
heading for liquidity problems, and would need to be closely monitored. A
figure greater than 2.0 would be more desirable, to act as a buffer against any
short-term liquidity problems, and give creditors/bank managers a degree of
comfort when granting credit/finance.
Leverage
Total debt-to-equity ratio
notched 7.15 times in FY09, as compared with 6.87 times in FY08. This means
that the company requires additional external financing of SGD - SIN 7.15 for
every SGD - SIN injected into its operations.
Generally, a total debt-to-equity ratio of less than 0.5
times is preferred. The ratio measures the proportion of the company's reliance
on external debt for financing, relative to the shareholder's fund. A lower
ratio would imply a greater financial safety and operating freedom for the
company.
Efficiency Ratio
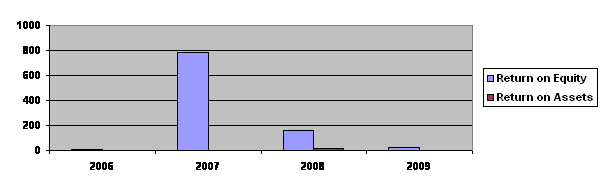
Return on equity was 25.44 per cent for Subject in the current financial
period, as compared to 156.26 per cent a year ago. The return on equity measures
the return earned on the owner's investment.
Generally, the higher this return, the better off the owner.
Return on assets stood at 3.12 per cent (FY08: 19.85 per cent). The return
on asset measures the overall effectiveness of management in generating profit
with its available assets.
Total assets turnover ratio logged at 0.64 times in FY09 (FY08: 0.55
times). This ratio measures the company's ability to make productive use of its
total assets to generate sales which reflects the efficiency of the management
in utilising its resources.
FOREIGN EXCHANGE RATES
|
Currency |
Unit
|
Indian Rupees |
|
US Dollar |
1 |
Rs.45.37 |
|
UK Pound |
1 |
Rs.74.56 |
|
Euro |
1 |
Rs.65.34 |
RATING EXPLANATIONS
|
RATING |
STATUS |
PROPOSED CREDIT LINE |
|
|
>86 |
Aaa |
Possesses an extremely sound financial base with the strongest
capability for timely payment of interest and principal sums |
Unlimited |
|
71-85 |
Aa |
Possesses adequate working capital. No caution needed for credit
transaction. It has above average (strong) capability for payment of interest
and principal sums |
Large |
|
56-70 |
A |
Financial & operational base are regarded healthy. General unfavourable
factors will not cause fatal effect. Satisfactory capability for payment of
interest and principal sums |
Fairly Large |
|
41-55 |
Ba |
Overall operation is considered normal. Capable to meet normal
commitments. |
Satisfactory |
|
26-40 |
B |
Capability to overcome financial difficulties seems comparatively
below average. |
Small |
|
11-25 |
Ca |
Adverse factors are apparent. Repayment of interest and principal sums
in default or expected to be in default upon maturity |
Limited with full
security |
|
<10 |
C |
Absolute credit risk exists. Caution needed to be exercised |
Credit not
recommended |
|
---- |
NB |
New Business |
---- |
This score serves as a reference to assess SC’s credit risk and
to set the amount of credit to be extended. It is calculated from a composite
of weighted scores obtained from each of the major sections of this report. The
assessed factors and their relative weights (as indicated through %) are as
follows:
Financial
condition (40%) Ownership
background (20%) Payment
record (10%)
Credit history
(10%) Market trend
(10%) Operational
size (10%)
This report is issued at your request without any
risk and responsibility on the part of MIRA INFORM PRIVATE LIMITED (MIPL) or
its officials.