![]()
MIRA
INFORM REPORT
|
Report Date : |
14.12.2011 |
IDENTIFICATION DETAILS
|
Name : |
SINTOKOGIO, LTD. |
|
|
|
|
Registered Office : |
3-28-12, Meieki Nakamura-ku Nagoya-shi, 450-0002 |
|
|
|
|
Country : |
Japan |
|
|
|
|
Financials (as on) : |
31.03.2011 |
|
|
|
|
Date of Incorporation : |
10.10.1934 |
|
|
|
|
Legal Form : |
Public Parent |
|
|
|
|
Line of Business : |
Manufacture of other metalworking machine tools |
|
|
|
|
No. of Employees : |
3,521 |
RATING & COMMENTS
|
MIRA’s Rating : |
B |
|
RATING |
STATUS |
PROPOSED CREDIT LINE |
|
|
26-40 |
B |
Capability to overcome financial difficulties seems comparatively
below average. |
Small |
|
Status : |
Moderate |
|
Payment Behaviour : |
No Complaints |
|
Litigation : |
-- |
NOTES :
Any query related to this report can be made on
e-mail: infodept@mirainform.com
while quoting report number, name and date.
ECGC Country Risk Classification List – September 30, 2011
|
Country Name |
Previous Rating (30.06.2011) |
Current Rating (30.09.2011) |
|
Japan |
A1 |
A1 |
|
Risk Category |
ECGC
Classification |
|
Insignificant |
A1 |
|
Low |
A2 |
|
Moderate |
B1 |
|
High |
B2 |
|
Very High |
C1 |
|
Restricted |
C2 |
|
Off-credit |
D |
Company name and address
Sintokogio,
Ltd.
|
3-28-12, Meieki Nakamura-ku Nagoya-shi, 450-0002 Japan Tel: 81-52-5829214 Fax: 81 (52) 586-2279 |
|
Employees: |
3,521 |
||
|
Company Type: |
Public Parent |
||
|
Corporate Family: |
|||
|
Traded: |
|
||
|
Incorporation Date: |
10-Oct-1934 |
||
|
Auditor: |
Deloitte & Touche LLP |
|
Financials in |
USD (mill) |
|
Fiscal Year End: |
31-Mar-2011 |
|
Reporting Currency: |
Japanese Yen |
|
Annual Sales: |
|
|
Net Income: |
|
|
Total Assets: |
|
|
Market Value: |
475.4 |
|
|
(25-Nov-2011) |
Business Description
|
Sintokogio, Ltd. is a manufacturer engaged in six business segments.
The Casting segment manufactures and sells casting machines, vacuum-sealed
processing equipments, molding sand processing equipments and components for
casting, among others. The Surface Treatment segment offers shot blasting
machines, air blasting machines, shot peening machines and barrel grinders.
The Environment segment manufactures and sells dust collecting equipments,
deodorization equipments, muffling devices and others. The Carrier segment
provides gravity conveyors, lifting and lowering devices, as well as
transportation systems. The Special Equipment segment manufactures and sells
liquid crystal display (LCD) panel manufacturing equipments, handling robots,
servo cylinders and electronic component assembly equipments. The Others
segment is engaged in the design of machinery, the operation of
information-related business and welfare business. For the six months ended
30 September 2011, Sintokogio, Ltd.'s revenues increased 22% to Y39.87B. The
Company's net income totaled Y1.29B, up from Y601M. Revenues reflect higher
sales due to favorable economic environment and increased demands. Net income
also benefited from lower percentage of cost of sales and SG&A expenses,
the absence of foreign exchange losses, as well as increased gain on equity. |
Industry
|
Industry |
|
|
ANZSIC 2006: |
|
|
NACE 2002: |
|
|
NAICS 2002: |
|
|
UK SIC 2003: |
|
|
US SIC 1987: |
Key
Executives
|
Significant
Developments
|
News
|
Financial
Summary
|
|
|
Stock Snapshot
|
|
1 - Profit & Loss Item Exchange Rate:
USD 1 = JPY 85.69144
2 - Balance Sheet Item Exchange Rate: USD 1 = JPY 82.88
Corporate Overview
|
|||||||||||||||||||||||||||||||||||||||||||||||||||||||||||||||||||||||||||||||||||||||||||||||||||||||||||||||||||||||||||||||||||||||||||||||||||||||||||||||||||||||||||||||||||||||||||||||||||||||||||||||||||||||||||||||||||||||||||||||||||||||||||||||||||||||||||||||||||||||||||||||||||||||||||||||||||||||||||||||||||||||||||||||||||||||||||||||||||||||||||||||||||
Corporate Structure News
|
Sintokogio, Ltd. |
|
|
|
Company Name |
Company Type |
Location |
Country |
Industry |
Sales |
Employees |
|
Parent |
Nagoya-shi |
Japan |
Miscellaneous Capital Goods |
868.7 |
3,521 |
|
|
Subsidiary |
Bad Laasphe, Nordrhein-Westfalen |
Germany |
Miscellaneous Capital Goods |
125.3 |
330 |
|
|
Subsidiary |
São Paulo, SP |
Brazil |
Miscellaneous Capital Goods |
|
100 |
|
|
Subsidiary |
Toyoake |
Japan |
Miscellaneous Capital Goods |
1.0 |
|
|
|
Subsidiary |
Khlong Luang, Pathum Thani |
Thailand |
Miscellaneous Capital Goods |
|
|
Executives Report
|
||||||||||||||||||||||||||||||||||||||||||||||||||||||||||||||||||||||||||||||||||||||||||||||||||||||||||||||||||||||||||||||||||||||||||||||||||||||||||||||||||||||||||||||||||||||||||||||||||||||||||||||||||||||||||||||||||||||||||||||
Significant Developments
|
Sintokogio 1H Grp Net Pft Y1.29B Vs Y601.00M Pft Yr Earlier
Nikkei English News
07 November 2011
|
[What follows is the full text of the news story.] Sintokogio Ltd. (6339.TO) Japan 1st Half Ended September 30 GROUP 2011 2010 Revenue Y39.87 blnY32.77 bln Operating Profit 2.09 bln 706.00 mln Pretax Profit 2.48 bln 898.00 mln Net Profit 1.29 bln 601.00 mln Per share Earnings 23.82 11.05 Results are based on Japanese accounting standards. |
|
Sintokogio Expects This FY Group Net Profit Y2.60B
Nikkei English News
07 November 2011
|
[What follows is the full text of the news story.] Sintokogio Ltd. also released the following forecasts: GROUP Year Ending Mar 2012 Revenue Y80.00 bln Operating Profit 4.30 bln Pretax Profit 4.50 bln Net Profit 2.60 bln Per share Earnings 47.89 Results are based on Japanese accounting standards. |
|
Sintokogio 1Q Grp Net Pft Y679.00M Vs Y237.00M Pft Yr Earlier
Nikkei English News
05 August 2011
|
[What follows is the full text of the news story.] Sintokogio Ltd. (6339.TO) Japan 1st Quarter Ended June 30 GROUP 2011 2010 Revenue Y19.85 blnY16.60 bln Operating Profit 1.07 bln 256.00 mln Pretax Profit 1.43 bln 409.00 mln Net Profit 679.00 mln 237.00 mln Per share Earnings 12.51 4.35 Results are based on Japanese accounting standards. |
|
Sintokogio Expects This FY Group Net Profit Y2.60B
Nikkei English News
05 August 2011
|
[What follows is the full text of the news story.] Sintokogio Ltd. also released the following forecasts: GROUP 1st Half To Year Ending Sep 2011Mar 2012 Revenue Y39.00 blnY80.00 bln Operating Profit 2.00 bln 4.30 bln Pretax Profit 2.20 bln 4.50 bln Net Profit 1.30 bln 2.60 bln Per share Earnings 23.94 47.89 Results are based on Japanese accounting standards. |
|
Sintokogio Ups 1H Group Net Profit View To Y1.30B
Nikkei English News
05 August 2011
|
[What follows is the full text of the news story.] Sintokogio Ltd. (6339.TO) GROUP New Forecast Prior For 1H To Sep 2011 Forecast Revenue Y39.00 blnY37.50 bln Operating Profit 2.00 bln 1.30 bln Pretax Profit 2.20 bln 1.50 bln Net Profit 1.30 bln 900.00 mln Per share Earnings 23.94 16.58 Results are based on Japanese accounting standards. |
|
Sintokogio Ups FY Group Net Profit View To Y2.60B
Nikkei English News
05 August 2011
|
[What follows is the full text of the news story.] Sintokogio Ltd. (6339.TO) GROUP New Forecast Prior For Year To Mar 2012 Forecast Revenue Y80.00 blnY78.00 bln Operating Profit 4.30 bln 3.60 bln Pretax Profit 4.50 bln 3.80 bln Net Profit 2.60 bln 2.20 bln Per share Earnings 47.89 40.52 Results are based on Japanese accounting standards. |
|
Australia: Sintokogio Receives Patent for 'Method for Filling a Foam
Mixture in a Cavity of a Metal Mold and An Apparatus for Molding a Mold'
Australian Government
16 July 2011
|
[What follows is the full text of the news story.] Australia, July 16 -- Sintokogio Ltd., Japan, has filed an application
(2006324794) on Nov. 8, 2006, for 'Method for Filling a Foam Mixture in a
Cavity of a Metal Mold and An Apparatus for Molding a Mold.' The patent is effective from Nov. 8, 2006, till Nov. 8, 2026. Inventor(s): Kazuyuki Nishikawa, Norihiro Asano, Yusuke Kato,
Toshihiko Zenpo, Toshio Kanno and Shinji Sonoyama Application Status: Sealed Acceptance Date: Feb. 23 Paid to Date: Nov. 8 The original document can be viewed at: http://pericles.ipaustralia.gov.au/ols/auspat/applicationDetails.do?applicationNo=2006324794 For any query with respect to this article or any other content
requirement, please contact Editor at htsyndication@hindustantimes.com |
|
New Japan and Ceramics Research Study Findings Have Been Reported from
T. Aoki et al
Japan and Ceramics Research
China Weekly News
22 June 2011
|
[What follows is the full text of the news story.] According to recent research published in the Journal of the Ceramic
Society of Japan, "We have developed a centrifugal heating apparatus to
fabricate layered TiS2-based thermoelectric elements, and evaluated their
thermoelectric properties. We found that layered (SnS)(1.2)(TiS2)(2) bulk
elements with preferred crystallographic orientation can be produced within a
quartz tube under a centrifugal acceleration of 1,000g or higher and at a
maximum temperature of 1,073 K or higher." "With the increasing centrifugal acceleration from 1,000 to
8,000g, the electrical conductivity of the produced specimen was almost
doubled possibly because of the increased degree of crystal-axis orientation.
For the specimens produced at 8,000g, we estimated a maximum thermoelectric
figure of merit, ZT, of approximately 0.2 (673 K)," wrote T. Aoki and
colleagues. The researchers concluded: "We have thus demonstrated that it is
possible to use the centrifugal heating technique to fabricate layered
TiS2-based thermoelectric elements directly from the powdered raw
materials." Aoki and colleagues published their study in the Journal of the
Ceramic Society of Japan (Evaluation of layered TiS2-based thermoelectric
elements fabricated by a centrifugal heating technique. Journal of the
Ceramic Society of Japan, 2011;119(1389):382-385). For additional information, contact T. Aoki, Sintokogio Ltd, 3-1
Honohara, Aichi 4428505, JAPAN. The publisher's contact information for the Journal of the Ceramic
Society of Japan is: Ceramic Society Japan-Nippon Seramikkusu KYOKAI, 2-22-17
Hyakunin-CHO Shinjuku-Ku, Tokyo, 169, Japan. |
|
Sintokogio Ltd Files Patent Application for a Machine for Centrifugally
Shooting Abrasives
Indian Patent News
08 September 2011
|
[What follows is the full text of the article.] New Delhi, Sept. 8 -- Japan based Sintokogio Ltd filed patent application
for a machine for centrifugally shooting abrasives. The inventors are Ito
Masakatsu, Iwata Kyoichi and Shiga Masaji. Sintokogio Ltd filed the patent application on May 3, 2011. The patent
application number is 1835/KOLNP/2011 A. The international classification
number is B24C5/06. According to the Controller General of Patents, Designs & Trade
Marks, "A machine for centrifugally shooting abrasives that shoots the
abrasives by rotation of an impeller is provided. In the machine, the
impeller comprises a pair of disc-shaped side plates that face each other at
a predetermined distance and a plurality of blades disposed between the side
plates in the radial direction of the side plates. The impeller is mounted on
a hub that is fitted into an output shaft of an electric motor. The impeller
is covered by a cover. The side liner and blades of the machine can be easily
replaced. A side liner that is U-shaped with the longer side facing downward
is detachably attached to the inner side of the cover . The upper part of the
side liner is divisible into two parts. The side liner protects the side wall
of the cover from the abrasives that are shot from the impeller. The side
liner has a U-shaped cross section. The impeller is fixed to the hub by
screwing a bolt on the hub from the inner sides of the side plates. The
diameter of the impeller is limited to be 200 mm at maximum." About the Company Sintokogio, Ltd., parent company of the Sinto Group, was originally
founded in 1934 as Kubota Seisakusho, a foundry equipment design and
manufacturing firm. In 1959, on its 25th anniversary, the company changed its
name to Sintokogio, Ltd., and relocated its main production facilities to
Toyokawa city, just outside the centrally located city of Nagoya, Japan. Copyright Contify.com
|
|
Sintokogio Ltd. Files Patent Application for a Method for Squeezing
Foundry Sand a Match Plate and an Upper and a Lower Flask
Indian Patent News
13 January 2011
|
[What follows is the full text of the article.] New Delhi, Jan. 13 -- Japan based Sintokogio Ltd. filed patent
application for a method for squeezing foundry sand a match plate, and an
upper and a lower flask. The inventors are Hirata Minoru, Terabe Tokiya and
Sakaguchi Koichi. Sintokogio Ltd. filed the patent application on Oct. 17, 2006. The
patent application number is 2996/KOLNP/2006 A. The international
classification numbers are B22C15/02 and B22C15/00. According to the Controller General of Patents, Designs & Trade
Marks, "A method of squeezing a foundry sand capable of solving a
problem in upper and lower molds manufactured by a mold manufacturing
apparatus, in which the foundry sand is squeezed by moving upper and lower
squeeze plates close to each other after the foundry sand is filled in upper
and lower molding spaces formed by the upper and lower flasks, match plates,
and upper and lower squeeze means, wherein the hardness and strength thereof
near the inner surfaces of the upper and lower flasks are not sufficient. The
method is characterized in that the upper and lower squeeze plates are moved
close to each other to squeeze the foundry sand in upper and lower molding
chambers, and the pattern parts of the match plates are advanced to the upper
and lower squeeze plate sides to further squeeze the foundry sand in the
upper and lower molding chambers." Sintokogio, Ltd. is a Japan-based manufacturer that operates in seven
business segments: casting, Surface Treatment, Environmental, Distribution,
Mechatronics, Projection and Abrasive Materials, and Others segments. Copyright Contify.com
|
|
Sintokogio Ltd. Files Patent Application for Method of Producing Sand
Mold
Indian Patent News
12 January 2011
|
[What follows is the full text of the article.] New Delhi, Jan. 12 -- Japan based Sintokogio Ltd. filed patent
application for method of producing sand mold. The inventors are Hirata
Minoru and Kaneto Kimikazu. Sintokogio Ltd. filed the patent application on Oct. 11, 2006. The
patent application number is 2928/KOLNP/2006 A. The international
classification numbers are B22C15/02 and B22C15/24. According to the Controller General of Patents, Designs & Trade
Marks, "A method for manufacturing an excellent sand mold by adjusting
the pressure value or the blowout time of a first compressed air. In the
method, foundry sand is squeezed by moving a squeeze means to a pattern plate
side after the foundry sand is blown into a molding space demarcated by at
least the pattern plate, a flask, and the squeeze means by supplying a second
compressed air onto the upper surface of the foundry sand held in a sand
blowing device while floatingly moving the foundry sand near a sand blowout
port held in the sand blowing device by blowing the first compressed air near
the sand blowout port of the sand blowing device positioned above the molding
space and holding the foundry sand. The blowout time of the first compressed
air can be decreased or increased based on the results obtained by measuring
a movement distance to the pattern plate side of the squeeze means when the
squeeze of the foundry sand in the molding space is completed and calculating
a difference between the measured value and a target value." Sintokogio, Ltd. is a Japan-based manufacturer that operates in seven
business segments: casting, Surface Treatment, Environmental, Distribution,
Mechatronics, Projection and Abrasive Materials, and Others segments. Copyright Contify.com
|
|
Annual Income
Statement
|
Financials in:
USD (mil) |
|
|
Except for share
items (millions) and per share items (actual units) |
|
|
|
31-Mar-2011 |
31-Mar-2010 |
31-Mar-2009 |
31-Mar-2008 |
31-Mar-2007 |
|
Period Length |
12 Months |
12 Months |
12 Months |
12 Months |
12 Months |
|
UpdateType/Date |
Updated Normal |
Updated Normal |
Updated Normal |
Updated Normal |
Updated Normal |
|
Filed Currency |
JPY |
JPY |
JPY |
JPY |
JPY |
|
Exchange Rate (Period Average) |
85.691434 |
92.941082 |
100.484331 |
114.302336 |
116.944303 |
|
Auditor |
Deloitte & Touche LLP |
Deloitte & Touche LLP |
Deloitte & Touche LLP |
Deloitte & Touche LLP |
Tohmatsu & Co. |
|
Auditor Opinion |
Unqualified |
Unqualified with Explanation |
Unqualified |
Unqualified |
Unqualified |
|
|
|
|
|
|
|
|
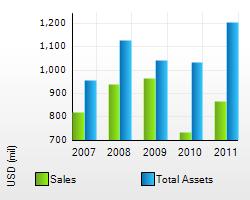
Net Sales |
868.7 |
734.5 |
967.0 |
938.9 |
821.5 |
|
Revenue |
868.7 |
734.5 |
967.0 |
938.9 |
821.5 |
|
Total Revenue |
868.7 |
734.5 |
967.0 |
938.9 |
821.5 |
|
|
|
|
|
|
|
|
Cost of Revenue |
612.3 |
537.1 |
705.1 |
691.6 |
594.9 |
|
Cost of Revenue, Total |
612.3 |
537.1 |
705.1 |
691.6 |
594.9 |
|
Gross Profit |
256.4 |
197.4 |
261.8 |
247.3 |
226.6 |
|
|
|
|
|
|
|
|
Selling/General/Administrative Expense |
77.7 |
65.2 |
70.3 |
62.7 |
58.0 |
|
Labor & Related Expense |
104.6 |
98.1 |
98.8 |
89.3 |
78.9 |
|
Advertising Expense |
2.8 |
2.2 |
3.1 |
3.2 |
1.9 |
|
Total Selling/General/Administrative Expenses |
185.1 |
165.5 |
172.2 |
155.2 |
138.8 |
|
Research & Development |
16.4 |
15.2 |
15.2 |
11.4 |
11.4 |
|
Depreciation |
4.8 |
4.2 |
4.6 |
3.6 |
3.3 |
|
Amortization of Acquisition Costs |
0.8 |
0.0 |
0.0 |
0.0 |
0.2 |
|
Depreciation/Amortization |
5.6 |
4.2 |
4.6 |
3.6 |
3.5 |
|
Litigation |
- |
- |
- |
0.0 |
-0.1 |
|
Impairment-Assets Held for Use |
0.3 |
0.6 |
2.4 |
5.1 |
0.4 |
|
Impairment-Assets Held for Sale |
2.8 |
1.4 |
17.3 |
1.3 |
0.0 |
|
Other Unusual Expense (Income) |
0.5 |
0.2 |
0.0 |
0.6 |
4.2 |
|
Unusual Expense (Income) |
3.7 |
2.1 |
19.7 |
7.0 |
4.5 |
|
Total Operating Expense |
823.2 |
724.1 |
916.8 |
868.8 |
753.1 |
|
|
|
|
|
|
|
|
Operating Income |
45.5 |
10.4 |
50.1 |
70.1 |
68.4 |
|
|
|
|
|
|
|
|
Interest Expense -
Non-Operating |
-1.1 |
-1.2 |
-1.5 |
-1.4 |
-1.4 |
|
Interest Expense, Net Non-Operating |
-1.1 |
-1.2 |
-1.5 |
-1.4 |
-1.4 |
|
Interest Income -
Non-Operating |
2.5 |
1.2 |
2.3 |
2.0 |
1.4 |
|
Investment Income -
Non-Operating |
-0.3 |
3.5 |
4.0 |
5.8 |
10.6 |
|
Interest/Investment Income - Non-Operating |
2.3 |
4.8 |
6.3 |
7.8 |
11.9 |
|
Interest Income (Expense) - Net Non-Operating Total |
1.2 |
3.6 |
4.9 |
6.4 |
10.5 |
|
Gain (Loss) on Sale of Assets |
0.1 |
-0.3 |
0.2 |
1.0 |
2.5 |
|
Other Non-Operating Income (Expense) |
-0.2 |
2.9 |
2.6 |
-0.2 |
0.2 |
|
Other, Net |
-0.2 |
2.9 |
2.6 |
-0.2 |
0.2 |
|
Income Before Tax |
46.5 |
16.6 |
57.7 |
77.4 |
81.6 |
|
|
|
|
|
|
|
|
Total Income Tax |
16.4 |
10.0 |
23.5 |
31.9 |
29.5 |
|
Income After Tax |
30.1 |
6.6 |
34.3 |
45.5 |
52.2 |
|
|
|
|
|
|
|
|
Minority Interest |
-3.0 |
-0.3 |
-1.0 |
-1.5 |
-1.9 |
|
Net Income Before Extraord Items |
27.1 |
6.2 |
33.2 |
44.0 |
50.3 |
|
Net Income |
27.1 |
6.2 |
33.2 |
44.0 |
50.3 |
|
|
|
|
|
|
|
|
Miscellaneous Earnings Adjustment |
-0.1 |
-0.1 |
-0.1 |
-0.1 |
0.0 |
|
Total Adjustments to Net Income |
-0.1 |
-0.1 |
-0.1 |
-0.1 |
0.0 |
|
Income Available to Common Excl Extraord Items |
27.0 |
6.1 |
33.1 |
43.9 |
50.3 |
|
|
|
|
|
|
|
|
Income Available to Common Incl Extraord Items |
27.0 |
6.1 |
33.1 |
43.9 |
50.3 |
|
|
|
|
|
|
|
|
Basic/Primary Weighted Average Shares |
54.4 |
54.5 |
54.5 |
54.6 |
54.6 |
|
Basic EPS Excl Extraord Items |
0.50 |
0.11 |
0.61 |
0.80 |
0.92 |
|
Basic/Primary EPS Incl Extraord Items |
0.50 |
0.11 |
0.61 |
0.80 |
0.92 |
|
Dilution Adjustment |
0.0 |
0.0 |
0.0 |
0.0 |
0.0 |
|
Diluted Net Income |
27.0 |
6.1 |
33.1 |
43.9 |
50.3 |
|
Diluted Weighted Average Shares |
54.4 |
54.5 |
54.5 |
54.6 |
54.6 |
|
Diluted EPS Excl Extraord Items |
0.50 |
0.11 |
0.61 |
0.80 |
0.92 |
|
Diluted EPS Incl Extraord Items |
0.50 |
0.11 |
0.61 |
0.80 |
0.92 |
|
Dividends per Share - Common Stock Primary Issue |
0.14 |
0.11 |
0.16 |
0.12 |
0.11 |
|
Gross Dividends - Common Stock |
7.6 |
5.9 |
8.7 |
6.7 |
6.1 |
|
Interest Expense, Supplemental |
1.1 |
1.2 |
1.5 |
1.4 |
1.4 |
|
Depreciation, Supplemental |
21.1 |
20.9 |
20.5 |
17.6 |
13.9 |
|
Total Special Items |
4.4 |
2.5 |
19.5 |
5.9 |
2.1 |
|
Normalized Income Before Tax |
50.9 |
19.1 |
77.2 |
83.3 |
83.8 |
|
|
|
|
|
|
|
|
Effect of Special Items on Income Taxes |
1.3 |
0.9 |
7.9 |
2.5 |
0.7 |
|
Inc Tax Ex Impact of Sp Items |
17.7 |
10.9 |
31.4 |
34.4 |
30.2 |
|
Normalized Income After Tax |
33.2 |
8.2 |
45.8 |
49.0 |
53.6 |
|
|
|
|
|
|
|
|
Normalized Inc. Avail to Com. |
30.1 |
7.7 |
44.7 |
47.3 |
51.7 |
|
|
|
|
|
|
|
|
Basic Normalized EPS |
0.55 |
0.14 |
0.82 |
0.87 |
0.95 |
|
Diluted Normalized EPS |
0.55 |
0.14 |
0.82 |
0.87 |
0.95 |
|
Amort of Acquisition Costs, Supplemental |
0.8 |
0.0 |
0.0 |
-0.1 |
0.1 |
|
Rental Expenses |
7.3 |
7.0 |
6.8 |
4.8 |
4.4 |
|
Advertising Expense, Supplemental |
2.8 |
2.2 |
3.1 |
3.2 |
1.9 |
|
Research & Development Exp, Supplemental |
16.8 |
15.7 |
16.3 |
12.3 |
12.3 |
|
Reported Operating Profit |
49.1 |
12.4 |
70.3 |
77.0 |
72.8 |
|
Reported Ordinary Profit |
50.2 |
17.7 |
77.7 |
83.3 |
82.4 |
|
Normalized EBIT |
49.2 |
12.6 |
69.8 |
77.2 |
72.9 |
|
Normalized EBITDA |
71.1 |
33.5 |
90.3 |
94.7 |
86.9 |
|
Interest Cost - Domestic |
1.8 |
1.7 |
1.4 |
1.3 |
1.1 |
|
Service Cost - Domestic |
7.9 |
4.4 |
11.2 |
5.6 |
4.2 |
|
Prior Service Cost - Domestic |
0.5 |
0.4 |
0.4 |
0.3 |
0.7 |
|
Expected Return on Assets - Domestic |
-1.1 |
-0.8 |
-0.8 |
-0.9 |
-0.8 |
|
Actuarial Gains and Losses - Domestic |
3.2 |
3.3 |
1.9 |
1.1 |
1.2 |
|
Domestic Pension Plan Expense |
12.2 |
9.0 |
14.0 |
7.4 |
6.4 |
|
Defined Contribution Expense - Domestic |
1.6 |
1.5 |
1.3 |
1.1 |
0.0 |
|
Total Pension Expense |
13.8 |
10.5 |
15.4 |
8.5 |
6.4 |
|
Discount Rate - Domestic |
1.80% |
1.80% |
2.00% |
2.00% |
2.00% |
|
Expected Rate of Return - Domestic |
2.00% |
2.00% |
2.00% |
2.00% |
2.00% |
|
Total Plan Interest Cost |
1.8 |
1.7 |
1.4 |
1.3 |
1.1 |
|
Total Plan Service Cost |
7.9 |
4.4 |
11.2 |
5.6 |
4.2 |
|
Total Plan Expected Return |
-1.1 |
-0.8 |
-0.8 |
-0.9 |
-0.8 |
|
|
|
Annual Balance Sheet |
|
Financials in: USD (mil) |
|
|
31-Mar-2011 |
31-Mar-2010 |
31-Mar-2009 |
31-Mar-2008 |
31-Mar-2007 |
|
UpdateType/Date |
Updated Normal |
Updated Normal |
Updated Normal |
Updated Normal |
Updated Normal |
|
Filed Currency |
JPY |
JPY |
JPY |
JPY |
JPY |
|
Exchange Rate |
82.88 |
93.44 |
98.77 |
99.535 |
118.075 |
|
Auditor |
Deloitte & Touche LLP |
Deloitte & Touche LLP |
Deloitte & Touche LLP |
Deloitte & Touche LLP |
Tohmatsu & Co. |
|
Auditor Opinion |
Unqualified |
Unqualified with Explanation |
Unqualified |
Unqualified |
Unqualified |
|
|
|
|
|
|
|
|
Cash & Equivalents |
235.3 |
167.9 |
163.5 |
117.2 |
102.6 |
|
Short Term Investments |
87.1 |
78.6 |
53.5 |
79.1 |
42.4 |
|
Cash and Short Term Investments |
322.4 |
246.5 |
217.0 |
196.3 |
145.0 |
|
Accounts Receivable -
Trade, Gross |
293.2 |
243.8 |
306.4 |
369.9 |
296.9 |
|
Provision for Doubtful
Accounts |
-2.6 |
-1.8 |
-1.6 |
-1.9 |
-1.6 |
|
Trade Accounts Receivable - Net |
290.5 |
242.0 |
304.8 |
368.0 |
295.3 |
|
Total Receivables, Net |
290.5 |
242.0 |
304.8 |
368.0 |
295.3 |
|
Inventories - Finished Goods |
17.5 |
14.4 |
16.7 |
16.0 |
- |
|
Inventories - Work In Progress |
48.3 |
61.3 |
76.0 |
79.8 |
- |
|
Inventories - Raw Materials |
28.9 |
28.1 |
30.5 |
27.2 |
- |
|
Total Inventory |
94.7 |
103.7 |
123.3 |
123.0 |
96.0 |
|
Deferred Income Tax - Current Asset |
16.6 |
12.5 |
12.1 |
14.5 |
12.3 |
|
Other Current Assets |
12.6 |
13.3 |
23.2 |
11.2 |
6.3 |
|
Other Current Assets, Total |
29.2 |
25.7 |
35.4 |
25.7 |
18.6 |
|
Total Current Assets |
736.9 |
618.0 |
680.5 |
712.9 |
554.9 |
|
|
|
|
|
|
|
|
Buildings |
210.2 |
191.2 |
163.7 |
168.4 |
135.6 |
|
Land/Improvements |
63.9 |
53.3 |
48.8 |
46.6 |
38.6 |
|
Machinery/Equipment |
222.7 |
200.6 |
188.0 |
194.8 |
162.0 |
|
Construction in
Progress |
16.8 |
2.0 |
5.4 |
1.6 |
1.2 |
|
Leases |
3.7 |
2.5 |
1.0 |
- |
- |
|
Other
Property/Plant/Equipment |
41.2 |
38.1 |
34.9 |
37.3 |
30.3 |
|
Property/Plant/Equipment - Gross |
558.6 |
487.6 |
441.8 |
448.6 |
367.6 |
|
Accumulated Depreciation |
-344.2 |
-302.1 |
-272.1 |
-283.4 |
-230.7 |
|
Property/Plant/Equipment - Net |
214.4 |
185.6 |
169.7 |
165.2 |
136.8 |
|
Goodwill, Net |
0.6 |
- |
- |
- |
0.0 |
|
Intangibles, Net |
12.8 |
11.8 |
8.6 |
5.4 |
5.7 |
|
LT Investments - Other |
200.0 |
185.8 |
148.4 |
211.3 |
233.6 |
|
Long Term Investments |
200.0 |
185.8 |
148.4 |
211.3 |
233.6 |
|
Note Receivable - Long Term |
2.8 |
3.5 |
2.3 |
2.2 |
0.2 |
|
Deferred Income Tax - Long Term Asset |
7.4 |
7.0 |
5.6 |
5.2 |
3.3 |
|
Restricted Cash - Long Term |
22.0 |
0.0 |
- |
- |
- |
|
Other Long Term Assets |
9.9 |
24.7 |
26.8 |
27.7 |
23.2 |
|
Other Long Term Assets, Total |
39.3 |
31.7 |
32.4 |
32.9 |
26.6 |
|
Total Assets |
1,206.8 |
1,036.4 |
1,042.0 |
1,129.8 |
957.7 |
|
|
|
|
|
|
|
|
Accounts Payable |
166.4 |
120.3 |
152.8 |
202.0 |
167.7 |
|
Accrued Expenses |
23.2 |
18.8 |
21.2 |
24.2 |
18.6 |
|
Notes Payable/Short Term Debt |
26.4 |
26.5 |
29.3 |
26.0 |
33.4 |
|
Current Portion - Long Term Debt/Capital Leases |
3.7 |
1.2 |
1.4 |
15.9 |
0.0 |
|
Customer Advances |
29.2 |
45.7 |
75.0 |
56.4 |
44.7 |
|
Income Taxes Payable |
10.1 |
3.2 |
5.9 |
20.0 |
19.8 |
|
Other Current Liabilities |
41.1 |
30.2 |
34.6 |
40.5 |
35.2 |
|
Other Current liabilities, Total |
80.5 |
79.0 |
115.4 |
116.8 |
99.7 |
|
Total Current Liabilities |
300.2 |
245.9 |
320.1 |
384.9 |
319.3 |
|
|
|
|
|
|
|
|
Long Term Debt |
51.2 |
28.1 |
29.9 |
29.4 |
13.8 |
|
Capital Lease Obligations |
2.5 |
2.9 |
2.5 |
0.0 |
- |
|
Total Long Term Debt |
53.7 |
31.0 |
32.5 |
29.4 |
13.8 |
|
Total Debt |
83.7 |
58.7 |
63.2 |
71.3 |
47.2 |
|
|
|
|
|
|
|
|
Deferred Income Tax - LT Liability |
21.3 |
15.9 |
5.4 |
17.8 |
36.5 |
|
Deferred Income Tax |
21.3 |
15.9 |
5.4 |
17.8 |
36.5 |
|
Minority Interest |
19.9 |
16.1 |
15.0 |
16.6 |
13.4 |
|
Reserves |
0.8 |
3.0 |
3.3 |
3.3 |
2.6 |
|
Pension Benefits - Underfunded |
34.2 |
32.4 |
31.7 |
27.3 |
21.4 |
|
Other Long Term Liabilities |
7.7 |
5.0 |
4.8 |
5.2 |
3.0 |
|
Other Liabilities, Total |
42.7 |
40.4 |
39.8 |
35.8 |
27.1 |
|
Total Liabilities |
437.8 |
349.3 |
412.7 |
484.6 |
410.2 |
|
|
|
|
|
|
|
|
Common Stock |
69.4 |
61.6 |
58.2 |
57.8 |
48.7 |
|
Common Stock |
69.4 |
61.6 |
58.2 |
57.8 |
48.7 |
|
Additional Paid-In Capital |
75.6 |
66.9 |
63.3 |
62.8 |
52.9 |
|
Retained Earnings (Accumulated Deficit) |
644.8 |
553.0 |
524.6 |
494.9 |
381.0 |
|
Treasury Stock - Common |
-15.7 |
-12.3 |
-11.5 |
-11.4 |
-8.6 |
|
Unrealized Gain (Loss) |
25.2 |
33.7 |
15.0 |
43.6 |
77.2 |
|
Translation Adjustment |
-30.4 |
-15.8 |
-20.3 |
-2.4 |
-3.7 |
|
Other Equity, Total |
-30.4 |
-15.8 |
-20.3 |
-2.4 |
-3.7 |
|
Total Equity |
768.9 |
687.0 |
629.3 |
645.3 |
547.6 |
|
|
|
|
|
|
|
|
Total Liabilities & Shareholders’ Equity |
1,206.8 |
1,036.3 |
1,041.9 |
1,129.8 |
957.7 |
|
|
|
|
|
|
|
|
Shares Outstanding - Common Stock Primary
Issue |
54.3 |
54.5 |
54.5 |
54.5 |
54.6 |
|
Total Common Shares Outstanding |
54.3 |
54.5 |
54.5 |
54.5 |
54.6 |
|
Treasury Shares - Common Stock Primary Issue |
2.3 |
2.1 |
2.1 |
2.0 |
1.9 |
|
Employees |
3,521 |
3,484 |
3,621 |
3,473 |
3,343 |
|
Number of Common Shareholders |
5,017 |
5,631 |
5,924 |
4,788 |
4,422 |
|
Deferred Revenue - Current |
29.2 |
45.7 |
75.0 |
56.4 |
44.7 |
|
Total Long Term Debt, Supplemental |
53.2 |
31.6 |
30.6 |
45.3 |
19.0 |
|
Long Term Debt Maturing within 1 Year |
2.1 |
3.5 |
0.7 |
15.9 |
5.2 |
|
Long Term Debt Maturing in Year 2 |
33.0 |
0.2 |
3.3 |
0.6 |
13.3 |
|
Long Term Debt Maturing in Year 3 |
5.2 |
26.9 |
0.2 |
3.4 |
0.4 |
|
Long Term Debt Maturing in Year 4 |
5.2 |
1.1 |
25.4 |
0.2 |
0.1 |
|
Long Term Debt Maturing in Year 5 |
3.5 |
0.0 |
1.0 |
25.2 |
- |
|
Long Term Debt Maturing in 2-3 Years |
38.2 |
27.1 |
3.5 |
4.0 |
13.7 |
|
Long Term Debt Maturing in 4-5 Years |
8.7 |
1.1 |
26.4 |
25.4 |
0.1 |
|
Long Term Debt Matur. in Year 6 & Beyond |
4.3 |
0.0 |
0.0 |
0.0 |
0.0 |
|
Total Capital Leases, Supplemental |
4.1 |
4.1 |
3.3 |
- |
- |
|
Capital Lease Payments Due in Year 1 |
1.6 |
1.2 |
0.8 |
- |
- |
|
Capital Lease Payments Due in Year 2 |
1.4 |
1.2 |
0.8 |
- |
- |
|
Capital Lease Payments Due in Year 3 |
0.8 |
1.0 |
0.8 |
- |
- |
|
Capital Lease Payments Due in Year 4 |
0.3 |
0.6 |
0.7 |
- |
- |
|
Capital Lease Payments Due in Year 5 |
0.1 |
0.1 |
0.3 |
- |
- |
|
Capital Lease Payments Due in 2-3 Years |
2.2 |
2.2 |
1.6 |
- |
- |
|
Capital Lease Payments Due in 4-5 Years |
0.3 |
0.7 |
0.9 |
- |
- |
|
Cap. Lease Pymts. Due in Year 6 & Beyond |
0.0 |
0.0 |
- |
- |
- |
|
Pension Obligation - Domestic |
115.3 |
105.5 |
92.5 |
84.3 |
70.4 |
|
Plan Assets - Domestic |
67.1 |
56.2 |
43.2 |
49.6 |
46.6 |
|
Funded Status - Domestic |
-48.1 |
-49.3 |
-49.3 |
-34.7 |
-23.8 |
|
Total Funded Status |
-48.1 |
-49.3 |
-49.3 |
-34.7 |
-23.8 |
|
Discount Rate - Domestic |
1.80% |
1.80% |
2.00% |
2.00% |
2.00% |
|
Expected Rate of Return - Domestic |
2.00% |
2.00% |
2.00% |
2.00% |
2.00% |
|
Accrued Liabilities - Domestic |
-32.4 |
-29.5 |
-28.6 |
-21.3 |
-16.4 |
|
Other Assets, Net - Domestic |
15.8 |
19.8 |
20.7 |
13.4 |
7.4 |
|
Net Assets Recognized on Balance Sheet |
-16.6 |
-9.7 |
-7.9 |
-7.9 |
-8.9 |
|
Total Plan Obligations |
115.3 |
105.5 |
92.5 |
84.3 |
70.4 |
|
Total Plan Assets |
67.1 |
56.2 |
43.2 |
49.6 |
46.6 |
|
|
|
Annual Cash Flows |
|
Financials in: USD (mil) |
|
|
31-Mar-2011 |
31-Mar-2010 |
31-Mar-2009 |
31-Mar-2008 |
31-Mar-2007 |
|
Period Length |
12 Months |
12 Months |
12 Months |
12 Months |
12 Months |
|
UpdateType/Date |
Updated Normal |
Updated Normal |
Updated Normal |
Updated Normal |
Updated Normal |
|
Filed Currency |
JPY |
JPY |
JPY |
JPY |
JPY |
|
Exchange Rate (Period Average) |
85.691434 |
92.941082 |
100.484331 |
114.302336 |
116.944303 |
|
Auditor |
Deloitte & Touche LLP |
Deloitte & Touche LLP |
Deloitte & Touche LLP |
Deloitte & Touche LLP |
Tohmatsu & Co. |
|
Auditor Opinion |
Unqualified |
Unqualified with Explanation |
Unqualified |
Unqualified |
Unqualified |
|
|
|
|
|
|
|
|
Net Income/Starting Line |
46.4 |
16.5 |
57.6 |
77.3 |
81.6 |
|
Depreciation |
21.1 |
20.9 |
20.5 |
17.6 |
13.9 |
|
Depreciation/Depletion |
21.1 |
20.9 |
20.5 |
17.6 |
13.9 |
|
Amortization of Acquisition Costs |
0.8 |
0.0 |
0.0 |
0.0 |
0.2 |
|
Amortization |
0.8 |
0.0 |
0.0 |
0.0 |
0.2 |
|
Unusual Items |
6.6 |
3.3 |
21.3 |
5.7 |
-5.0 |
|
Equity in Net Earnings (Loss) |
-1.8 |
-2.0 |
-1.9 |
-2.0 |
-3.3 |
|
Other Non-Cash Items |
-4.6 |
-2.7 |
-1.6 |
-1.5 |
-9.3 |
|
Non-Cash Items |
0.1 |
-1.3 |
17.8 |
2.2 |
-17.6 |
|
Accounts Receivable |
-13.8 |
83.4 |
54.8 |
-15.0 |
-20.6 |
|
Inventories |
18.8 |
29.2 |
-8.0 |
-6.5 |
-11.7 |
|
Accounts Payable |
32.3 |
-42.4 |
-40.1 |
0.0 |
8.4 |
|
Accrued Expenses |
1.2 |
-1.9 |
-3.5 |
1.7 |
2.1 |
|
Taxes Payable |
1.0 |
-2.2 |
0.8 |
0.0 |
0.3 |
|
Other Liabilities |
-16.8 |
-36.0 |
24.1 |
1.2 |
11.5 |
|
Other Operating Cash Flow |
6.1 |
-2.8 |
-41.8 |
-35.6 |
-17.3 |
|
Changes in Working Capital |
28.9 |
27.2 |
-13.7 |
-54.2 |
-27.4 |
|
Cash from Operating Activities |
97.4 |
63.3 |
82.3 |
43.0 |
50.7 |
|
|
|
|
|
|
|
|
Purchase of Fixed Assets |
-30.1 |
-26.6 |
-35.5 |
-20.9 |
-29.5 |
|
Purchase/Acquisition of Intangibles |
-2.8 |
-4.1 |
-2.6 |
-0.5 |
-0.5 |
|
Capital Expenditures |
-32.8 |
-30.7 |
-38.1 |
-21.5 |
-30.0 |
|
Acquisition of Business |
- |
0.0 |
-1.5 |
0.0 |
- |
|
Sale of Business |
0.2 |
0.0 |
- |
- |
- |
|
Sale of Fixed Assets |
0.5 |
0.9 |
3.6 |
2.0 |
4.6 |
|
Sale/Maturity of Investment |
23.9 |
19.2 |
36.3 |
17.8 |
15.9 |
|
Investment, Net |
1.0 |
0.1 |
0.1 |
-0.1 |
1.1 |
|
Purchase of Investments |
-57.0 |
-25.0 |
-37.6 |
-18.1 |
-23.1 |
|
Other Investing Cash Flow |
0.4 |
-1.4 |
0.3 |
-1.7 |
0.5 |
|
Other Investing Cash Flow Items, Total |
-31.1 |
-6.3 |
1.2 |
0.0 |
-1.0 |
|
Cash from Investing Activities |
-63.9 |
-36.9 |
-37.0 |
-21.4 |
-31.1 |
|
|
|
|
|
|
|
|
Other Financing Cash Flow |
-0.8 |
-0.4 |
-1.0 |
-0.7 |
-0.5 |
|
Financing Cash Flow Items |
-0.8 |
-0.4 |
-1.0 |
-0.7 |
-0.5 |
|
Cash Dividends Paid - Common |
-6.3 |
-7.6 |
-8.1 |
-6.4 |
-5.6 |
|
Total Cash Dividends Paid |
-6.3 |
-7.6 |
-8.1 |
-6.4 |
-5.6 |
|
Sale/Issuance of
Common |
0.7 |
0.0 |
- |
0.0 |
1.0 |
|
Repurchase/Retirement
of Common |
-2.9 |
-0.1 |
0.0 |
-1.1 |
-1.7 |
|
Common Stock, Net |
-2.2 |
-0.1 |
0.0 |
-1.1 |
-0.6 |
|
Issuance (Retirement) of Stock, Net |
-2.2 |
-0.1 |
0.0 |
-1.1 |
-0.6 |
|
Short Term Debt, Net |
1.2 |
-8.9 |
5.9 |
-6.4 |
-7.2 |
|
Long Term Debt Issued |
20.8 |
0.0 |
1.0 |
25.3 |
0.1 |
|
Long Term Debt
Reduction |
-5.3 |
-1.7 |
-16.2 |
-5.6 |
-18.3 |
|
Long Term Debt, Net |
15.5 |
-1.7 |
-15.2 |
19.8 |
-18.2 |
|
Issuance (Retirement) of Debt, Net |
16.7 |
-10.6 |
-9.3 |
13.3 |
-25.4 |
|
Cash from Financing Activities |
7.4 |
-18.8 |
-18.5 |
5.1 |
-32.1 |
|
|
|
|
|
|
|
|
Foreign Exchange Effects |
-8.3 |
2.4 |
-7.5 |
1.4 |
2.0 |
|
Net Change in Cash |
32.6 |
10.0 |
19.2 |
28.0 |
-10.5 |
|
|
|
|
|
|
|
|
Net Cash - Beginning Balance |
254.2 |
224.3 |
188.3 |
137.5 |
144.9 |
|
Net Cash - Ending Balance |
286.8 |
234.4 |
207.5 |
165.5 |
134.4 |
|
Cash Interest Paid |
1.1 |
1.2 |
1.4 |
1.3 |
1.4 |
|
Cash Taxes Paid |
5.9 |
4.9 |
38.0 |
35.8 |
20.6 |
ANNUAL INCOME
STATEMENT
|
Financials in: USD (mil) Except for share items (millions) and per share
items (actual units) |
|
|
31-Mar-2011 |
31-Mar-2010 |
31-Mar-2009 |
31-Mar-2008 |
31-Mar-2007 |
|
Period Length |
12 Months |
12 Months |
12 Months |
12 Months |
12 Months |
|
UpdateType/Date |
Updated Normal |
Updated Normal |
Updated Normal |
Updated Normal |
Updated Normal |
|
Filed Currency |
JPY |
JPY |
JPY |
JPY |
JPY |
|
Exchange Rate (Period Average) |
85.691434 |
92.941082 |
100.484331 |
114.302336 |
116.944303 |
|
Auditor |
Deloitte & Touche LLP |
Deloitte & Touche LLP |
Deloitte & Touche LLP |
Deloitte & Touche LLP |
Tohmatsu & Co. |
|
Auditor Opinion |
Unqualified |
Unqualified with Explanation |
Unqualified |
Unqualified |
Unqualified |
|
|
|
|
|
|
|
|
Net Sales |
868.7 |
734.5 |
967.0 |
938.9 |
821.5 |
|
Total Revenue |
868.7 |
734.5 |
967.0 |
938.9 |
821.5 |
|
|
|
|
|
|
|
|
Cost of Sales |
612.3 |
537.1 |
705.1 |
691.6 |
594.9 |
|
Shipping |
20.1 |
15.6 |
20.2 |
20.0 |
18.4 |
|
Sales Commission |
10.9 |
8.4 |
7.2 |
6.8 |
5.9 |
|
Patent Usage |
0.2 |
0.8 |
0.8 |
0.9 |
0.6 |
|
Advertising |
2.8 |
2.2 |
3.1 |
3.2 |
1.9 |
|
Entertainment |
1.8 |
1.5 |
2.1 |
2.0 |
2.0 |
|
Travel, Transpor. |
11.8 |
10.3 |
10.9 |
9.8 |
9.0 |
|
Payrolls |
78.7 |
74.7 |
74.7 |
69.4 |
60.6 |
|
Provision for bonuses |
7.8 |
7.0 |
6.4 |
6.3 |
6.2 |
|
Provision for dir's bonuses |
2.0 |
1.2 |
1.3 |
0.8 |
0.7 |
|
Periodic retirement benefit costs |
4.8 |
4.3 |
6.1 |
3.2 |
2.4 |
|
Prov. for dirs' retirment benefits |
0.2 |
0.2 |
0.3 |
0.3 |
0.3 |
|
Welfare expenses |
11.0 |
10.7 |
10.1 |
9.3 |
8.7 |
|
Taxes, other than income taxes |
2.6 |
2.4 |
2.8 |
2.5 |
2.4 |
|
Office Supplies |
1.3 |
1.2 |
1.4 |
1.4 |
1.3 |
|
Communication |
2.6 |
2.5 |
2.3 |
1.8 |
1.7 |
|
Depreciation |
4.8 |
4.2 |
4.0 |
3.6 |
3.3 |
|
Rental Expense |
7.3 |
7.0 |
6.8 |
4.8 |
4.4 |
|
Amort. of Goodwill |
0.8 |
0.1 |
0.0 |
0.1 |
0.3 |
|
Provision for doubtful accounts(SGA) |
0.6 |
0.1 |
0.2 |
0.0 |
- |
|
R & D expenses |
16.4 |
15.2 |
15.2 |
11.4 |
11.4 |
|
Other SG&A |
18.6 |
15.5 |
15.6 |
12.7 |
12.2 |
|
SP Rev.Allow.Doubt.Acct |
- |
- |
0.0 |
0.0 |
-0.2 |
|
SP Rev. Allow. Environmental Exp. |
- |
- |
- |
0.0 |
-0.1 |
|
SP Rev. Allow. Blg. Withdrawal Exp. |
- |
- |
- |
0.0 |
-0.1 |
|
SP Rev. Ligitation Loss |
- |
- |
- |
0.0 |
-0.1 |
|
SP Rev. G on Prov. for Plant warranty |
0.0 |
-0.2 |
0.0 |
- |
- |
|
SP Rev. G on Prov.for envir. measure |
0.0 |
-0.1 |
0.0 |
- |
- |
|
SP Loss Retir.Fix.Asset |
0.2 |
0.4 |
1.3 |
0.5 |
0.4 |
|
SP Loss Val. Fix. Asset |
- |
- |
- |
- |
0.0 |
|
SP Loss Impairment Assets |
0.2 |
0.2 |
1.2 |
4.5 |
0.0 |
|
SP Nonrecurring depreciation |
- |
0.0 |
0.7 |
0.0 |
- |
|
SP Loss Val. Inv. Sec. |
2.8 |
1.4 |
17.3 |
1.3 |
0.0 |
|
SP Environment Safety Prep. expense |
- |
- |
0.0 |
0.2 |
0.0 |
|
SP Reserve for Environment Safety Prep. |
- |
- |
- |
- |
0.0 |
|
SP Reserve for removal of building costs |
- |
- |
- |
- |
0.0 |
|
SP Restoration expense |
- |
- |
- |
0.0 |
0.0 |
|
SP Product Compensation |
- |
- |
0.0 |
0.3 |
4.2 |
|
SP Loss-Contract Cancelled |
- |
- |
- |
0.0 |
0.2 |
|
SP Loss Val. Membership |
0.1 |
0.5 |
0.0 |
0.1 |
0.1 |
|
SP Other Loss |
0.4 |
0.0 |
- |
- |
- |
|
NOP Amort.negative Goodwill |
0.0 |
0.0 |
0.0 |
-0.1 |
-0.1 |
|
Total Operating Expense |
823.2 |
724.1 |
916.8 |
868.8 |
753.1 |
|
|
|
|
|
|
|
|
NOP Interest Income |
2.5 |
1.2 |
2.3 |
2.0 |
1.4 |
|
NOP Dividend Income |
2.5 |
2.1 |
3.8 |
3.0 |
2.5 |
|
NOP Gain Equity Investment |
1.8 |
2.0 |
1.9 |
2.0 |
3.3 |
|
NOP Insurance Dividend |
- |
- |
0.5 |
1.1 |
1.4 |
|
NOP G-Managing Inv. Fund |
- |
- |
- |
0.0 |
2.2 |
|
NOP Other Non-Op.Income |
2.8 |
4.5 |
3.8 |
2.5 |
2.2 |
|
NOP Interest Expense |
-1.1 |
-1.2 |
-1.5 |
-1.4 |
-1.4 |
|
NOP Exchange Loss |
-1.4 |
0.0 |
- |
- |
- |
|
NOP L-Managing Inv. Fund |
-3.0 |
-1.8 |
-2.3 |
-0.3 |
0.0 |
|
NOP Provision of allow. for doubtful ac. |
-1.0 |
0.0 |
- |
- |
- |
|
NOP Other Non-Op.Expense |
-2.1 |
-1.6 |
-1.2 |
-2.7 |
-2.0 |
|
SP Gain Sale Fix.Asset |
0.1 |
0.1 |
0.4 |
1.2 |
2.5 |
|
SP Gain Sale Inv. Sec. |
0.1 |
1.3 |
0.7 |
0.0 |
1.1 |
|
SP Gains on equity changes |
0.1 |
0.0 |
- |
- |
- |
|
SP Gain Sale Memberships |
- |
- |
- |
0.0 |
0.1 |
|
SP L on liquidation of LT inv't in secs |
- |
- |
- |
0.0 |
0.0 |
|
SP Loss Sale Fix.Asset |
0.0 |
-0.4 |
-0.2 |
-0.2 |
-0.1 |
|
SP L on redemp. of invest. secs. |
-0.4 |
0.0 |
- |
- |
- |
|
SP Loss Change Equity |
- |
0.0 |
-0.2 |
0.0 |
- |
|
SP Loss Sale Inv. Secs. |
- |
- |
0.0 |
0.0 |
0.0 |
|
SP Loss Sale Affil.Stk. |
- |
0.0 |
-0.3 |
0.0 |
- |
|
SP Loss Sale Memberships |
- |
- |
- |
0.0 |
0.0 |
|
Net Income Before Taxes |
46.5 |
16.6 |
57.7 |
77.4 |
81.6 |
|
|
|
|
|
|
|
|
Provision for Income Taxes |
16.4 |
10.0 |
23.5 |
31.9 |
29.5 |
|
Net Income After Taxes |
30.1 |
6.6 |
34.3 |
45.5 |
52.2 |
|
|
|
|
|
|
|
|
MinorityInterest |
-3.0 |
-0.3 |
-1.0 |
-1.5 |
-1.9 |
|
Net Income Before Extra. Items |
27.1 |
6.2 |
33.2 |
44.0 |
50.3 |
|
Net Income |
27.1 |
6.2 |
33.2 |
44.0 |
50.3 |
|
|
|
|
|
|
|
|
Directors' Bonuses |
- |
- |
- |
- |
0.0 |
|
Adjustment |
-0.1 |
-0.1 |
-0.1 |
-0.1 |
0.0 |
|
Income Available to Com Excl ExtraOrd |
27.0 |
6.1 |
33.1 |
43.9 |
50.3 |
|
|
|
|
|
|
|
|
Income Available to Com Incl ExtraOrd |
27.0 |
6.1 |
33.1 |
43.9 |
50.3 |
|
|
|
|
|
|
|
|
Basic Weighted Average Shares |
54.4 |
54.5 |
54.5 |
54.6 |
54.6 |
|
Basic EPS Excluding ExtraOrdinary Items |
0.50 |
0.11 |
0.61 |
0.80 |
0.92 |
|
Basic EPS Including ExtraOrdinary Item |
0.50 |
0.11 |
0.61 |
0.80 |
0.92 |
|
Dilution Adjustment |
0.0 |
0.0 |
0.0 |
0.0 |
0.0 |
|
Diluted Net Income |
27.0 |
6.1 |
33.1 |
43.9 |
50.3 |
|
Diluted Weighted Average Shares |
54.4 |
54.5 |
54.5 |
54.6 |
54.6 |
|
Diluted EPS Excluding ExtraOrd Items |
0.50 |
0.11 |
0.61 |
0.80 |
0.92 |
|
Diluted EPS Including ExtraOrd Items |
0.50 |
0.11 |
0.61 |
0.80 |
0.92 |
|
DPS-Common Stock |
0.14 |
0.11 |
0.16 |
0.12 |
0.11 |
|
Gross Dividends - Common Stock |
7.6 |
5.9 |
8.7 |
6.7 |
6.1 |
|
Normalized Income Before Taxes |
50.9 |
19.1 |
77.2 |
83.3 |
83.8 |
|
|
|
|
|
|
|
|
Inc Tax Ex Impact of Sp Items |
17.7 |
10.9 |
31.4 |
34.4 |
30.2 |
|
Normalized Income After Taxes |
33.2 |
8.2 |
45.8 |
49.0 |
53.6 |
|
|
|
|
|
|
|
|
Normalized Inc. Avail to Com. |
30.1 |
7.7 |
44.7 |
47.3 |
51.7 |
|
|
|
|
|
|
|
|
Basic Normalized EPS |
0.55 |
0.14 |
0.82 |
0.87 |
0.95 |
|
Diluted Normalized EPS |
0.55 |
0.14 |
0.82 |
0.87 |
0.95 |
|
Rental Expense |
7.3 |
7.0 |
6.8 |
4.8 |
4.4 |
|
R & D expenses (SGA) |
16.4 |
15.2 |
15.2 |
11.4 |
11.4 |
|
R & D expenses (COGS) |
0.4 |
0.5 |
1.1 |
0.9 |
0.9 |
|
Advertising Expense |
2.8 |
2.2 |
3.1 |
3.2 |
1.9 |
|
Interest Expense |
1.1 |
1.2 |
1.5 |
1.4 |
1.4 |
|
Depreciation |
21.1 |
20.9 |
20.5 |
17.6 |
13.9 |
|
Amort of Goodwill |
0.8 |
0.0 |
0.0 |
0.0 |
0.2 |
|
Amortization of negative goodwill |
- |
- |
- |
-0.1 |
-0.1 |
|
Reported Operating Profit |
49.1 |
12.4 |
70.3 |
77.0 |
72.8 |
|
Reported Ordinary Profit |
50.2 |
17.7 |
77.7 |
83.3 |
82.4 |
|
Service Cost |
7.9 |
4.4 |
11.2 |
5.6 |
4.2 |
|
Interest Cost |
1.8 |
1.7 |
1.4 |
1.3 |
1.1 |
|
Expected Return of Plan Asset |
-1.1 |
-0.8 |
-0.8 |
-0.9 |
-0.8 |
|
Prior Service Costs |
0.5 |
0.4 |
0.4 |
0.3 |
0.7 |
|
Actuarial G/L |
3.2 |
3.3 |
1.9 |
1.1 |
1.2 |
|
Domestic Pension Plan Expense |
12.2 |
9.0 |
14.0 |
7.4 |
6.4 |
|
Defined contribution expense |
1.6 |
1.5 |
1.3 |
1.1 |
0.0 |
|
Total Pension Expense |
13.8 |
10.5 |
15.4 |
8.5 |
6.4 |
|
Discount Rate |
1.80% |
1.80% |
2.00% |
2.00% |
2.00% |
|
Expected Rate of Return |
2.00% |
2.00% |
2.00% |
2.00% |
2.00% |
|
|
|
Annual Balance Sheet |
|
Financials in: USD (mil) |
|
|
31-Mar-2011 |
31-Mar-2010 |
31-Mar-2009 |
31-Mar-2008 |
31-Mar-2007 |
|
UpdateType/Date |
Updated Normal |
Updated Normal |
Updated Normal |
Updated Normal |
Updated Normal |
|
Filed Currency |
JPY |
JPY |
JPY |
JPY |
JPY |
|
Exchange Rate |
82.88 |
93.44 |
98.77 |
99.535 |
118.075 |
|
Auditor |
Deloitte & Touche LLP |
Deloitte & Touche LLP |
Deloitte & Touche LLP |
Deloitte & Touche LLP |
Tohmatsu & Co. |
|
Auditor Opinion |
Unqualified |
Unqualified with Explanation |
Unqualified |
Unqualified |
Unqualified |
|
|
|
|
|
|
|
|
Cash & Deposits |
235.3 |
167.9 |
163.5 |
117.2 |
102.6 |
|
Note&Acct. Rcvl. |
293.2 |
243.8 |
306.4 |
369.9 |
296.9 |
|
Marketable Sec. |
87.1 |
78.6 |
53.5 |
79.1 |
42.4 |
|
Inventories |
- |
- |
- |
- |
96.0 |
|
Inventories - finished goods |
17.5 |
14.4 |
16.7 |
16.0 |
- |
|
Inventories - work-in-process |
48.3 |
61.3 |
76.0 |
79.8 |
- |
|
Inventories - raw materials & supplies |
28.9 |
28.1 |
30.5 |
27.2 |
- |
|
Deferred Tax |
16.6 |
12.5 |
12.1 |
14.5 |
12.3 |
|
Other Curr.Asset |
12.6 |
13.3 |
23.2 |
11.2 |
6.3 |
|
Allow.Doubt.Acct |
-2.6 |
-1.8 |
-1.6 |
-1.9 |
-1.6 |
|
Total Current Assets |
736.9 |
618.0 |
680.5 |
712.9 |
554.9 |
|
|
|
|
|
|
|
|
Bldg.&Structures |
210.2 |
191.2 |
163.7 |
168.4 |
135.6 |
|
Accum. depr - bldg&struc |
-127.6 |
-111.6 |
-101.2 |
-101.0 |
- |
|
Mach.&Vehicles |
222.7 |
200.6 |
188.0 |
194.8 |
162.0 |
|
Accum. depr - machin&vehicles |
-180.3 |
-157.6 |
-141.8 |
-151.9 |
- |
|
Land |
63.9 |
53.3 |
48.8 |
46.6 |
38.6 |
|
Lease assets, gross |
3.7 |
2.5 |
1.0 |
- |
- |
|
Accum. depr - lease assets |
-1.4 |
-0.7 |
-0.2 |
- |
- |
|
Contr.-in-Prog. |
16.8 |
2.0 |
5.4 |
1.6 |
1.2 |
|
Other PP&E |
41.2 |
38.1 |
34.9 |
37.3 |
30.3 |
|
Accum. depr - other PPE |
-34.9 |
-32.2 |
-28.9 |
-30.5 |
- |
|
Depreciation |
- |
- |
- |
- |
-230.7 |
|
Total intangible assets |
- |
11.8 |
8.6 |
5.4 |
- |
|
Goodwill |
0.6 |
- |
- |
- |
0.0 |
|
Lease assets |
1.8 |
- |
- |
- |
- |
|
Consolid.Adj. |
- |
- |
- |
- |
0.0 |
|
Other Intangible |
11.1 |
- |
- |
- |
5.7 |
|
Invest. Securit. |
200.0 |
185.8 |
148.4 |
211.3 |
233.6 |
|
LT Loan |
2.8 |
3.5 |
2.3 |
2.2 |
0.2 |
|
Time deposit over 1 year |
22.0 |
0.0 |
- |
- |
- |
|
Deferred Tax |
7.4 |
7.0 |
5.6 |
5.2 |
3.3 |
|
Other Assets |
11.4 |
25.4 |
27.4 |
28.7 |
24.2 |
|
Allow.Doubt.Acct |
-1.5 |
-0.7 |
-0.6 |
-1.0 |
-0.9 |
|
Adjustment |
-0.1 |
0.0 |
- |
0.0 |
0.0 |
|
Total Assets |
1,206.8 |
1,036.4 |
1,042.0 |
1,129.8 |
957.7 |
|
|
|
|
|
|
|
|
Note&Acct. Pybl. |
166.4 |
120.3 |
152.8 |
202.0 |
167.7 |
|
ST Debt |
26.4 |
26.5 |
29.3 |
26.0 |
33.4 |
|
LT borrowings (current) |
1.3 |
0.0 |
0.7 |
0.8 |
- |
|
Curr.Corp.Bond |
0.8 |
0.0 |
0.0 |
15.1 |
0.0 |
|
Lease liabilities (current) |
1.6 |
1.2 |
0.8 |
0.0 |
- |
|
Corp.Tax Pybls. |
10.1 |
3.2 |
5.9 |
20.0 |
19.8 |
|
Sales Tax Pybls. |
3.2 |
2.0 |
3.8 |
3.3 |
2.6 |
|
Advances received |
29.2 |
45.7 |
75.0 |
56.4 |
44.7 |
|
Allow.Bonus |
17.9 |
15.6 |
16.2 |
19.9 |
15.3 |
|
Allow. Dir's Bonus |
2.1 |
1.2 |
1.3 |
1.0 |
0.7 |
|
Allow.Plant Depos |
6.8 |
6.5 |
5.0 |
5.7 |
3.7 |
|
Allow.Project Received |
0.3 |
0.3 |
0.3 |
1.2 |
0.6 |
|
Reserve for removal of building costs |
- |
- |
- |
- |
0.0 |
|
Reserve for environmental safety |
- |
0.0 |
0.0 |
0.0 |
- |
|
Other Curr.Liab. |
34.0 |
23.4 |
29.2 |
33.6 |
30.9 |
|
Adjustment |
- |
- |
0.1 |
- |
- |
|
Total Current Liabilities |
300.2 |
245.9 |
320.1 |
384.9 |
319.3 |
|
|
|
|
|
|
|
|
Corp. Bond |
37.0 |
27.8 |
26.3 |
25.1 |
12.7 |
|
LT Debt |
14.2 |
0.3 |
3.6 |
4.3 |
1.1 |
|
Lease liabilities (non-current) |
2.5 |
2.9 |
2.5 |
0.0 |
- |
|
Total Long Term Debt |
53.7 |
31.0 |
32.5 |
29.4 |
13.8 |
|
|
|
|
|
|
|
|
Accrued Directors Severance Benefit |
- |
1.4 |
1.3 |
4.5 |
3.8 |
|
Deferred Tax |
21.3 |
15.9 |
5.4 |
17.8 |
36.5 |
|
Res.Accrd.Retir. |
32.4 |
29.5 |
28.6 |
21.3 |
16.4 |
|
Allow.Dir.Retir. |
1.9 |
1.6 |
1.8 |
1.5 |
1.3 |
|
Reserve for Environment Safety Prep. |
0.8 |
3.0 |
3.3 |
3.3 |
2.6 |
|
Asset retirement obligations |
1.4 |
0.0 |
- |
- |
- |
|
Other LT Liab. |
6.3 |
5.0 |
4.8 |
5.2 |
3.0 |
|
Minority Interest |
19.9 |
16.1 |
15.0 |
16.6 |
13.4 |
|
Total Liabilities |
437.8 |
349.3 |
412.7 |
484.6 |
410.2 |
|
|
|
|
|
|
|
|
Common Stock |
69.4 |
61.6 |
58.2 |
57.8 |
48.7 |
|
Paid-in-Capital |
75.6 |
66.9 |
63.3 |
62.8 |
52.9 |
|
RetainedEarnings |
644.8 |
553.0 |
524.6 |
494.9 |
381.0 |
|
TreasuryStock |
-15.7 |
-12.3 |
-11.5 |
-11.4 |
-8.6 |
|
UnrlzedGain-Sec. |
25.1 |
33.7 |
15.0 |
43.6 |
77.2 |
|
Deferred gains or losses on hedges |
0.0 |
0.0 |
- |
- |
- |
|
Translation Adj. |
-30.4 |
-15.8 |
-20.3 |
-2.4 |
-3.7 |
|
Total Equity |
768.9 |
687.0 |
629.3 |
645.3 |
547.6 |
|
|
|
|
|
|
|
|
Total Liabilities & Shareholders' Equity |
1,206.8 |
1,036.3 |
1,041.9 |
1,129.8 |
957.7 |
|
|
|
|
|
|
|
|
S/O-Common Stock |
54.3 |
54.5 |
54.5 |
54.5 |
54.6 |
|
Total Common Shares Outstanding |
54.3 |
54.5 |
54.5 |
54.5 |
54.6 |
|
T/S-Common Stock |
2.3 |
2.1 |
2.1 |
2.0 |
1.9 |
|
Deferred Revenue-Current |
29.2 |
45.7 |
75.0 |
56.4 |
44.7 |
|
Full-Time Employees |
3,521 |
3,484 |
3,621 |
3,473 |
3,343 |
|
Number of Common Shareholders |
5,017 |
5,631 |
5,924 |
4,788 |
4,422 |
|
LT Debts Maturing within 1yr. |
2.1 |
3.5 |
0.7 |
15.9 |
5.2 |
|
LT Debts Maturing within 2yr. |
33.0 |
0.2 |
3.3 |
0.6 |
13.3 |
|
LT Debts Maturing within 3yr. |
5.2 |
26.9 |
0.2 |
3.4 |
0.4 |
|
LT Debts Maturing within 4yr. |
5.2 |
1.1 |
25.4 |
0.2 |
0.1 |
|
LT Debts Maturing within 5yr. |
3.5 |
0.0 |
1.0 |
25.2 |
- |
|
Remaining |
4.3 |
0.0 |
0.0 |
0.0 |
0.0 |
|
Total Long Term Debt, Supplemental |
53.2 |
31.6 |
30.6 |
45.3 |
19.0 |
|
Lease Maturing within 1yr. |
1.6 |
1.2 |
0.8 |
- |
- |
|
Lease Maturing within 2yr. |
1.4 |
1.2 |
0.8 |
- |
- |
|
Lease Maturing within 3yr. |
0.8 |
1.0 |
0.8 |
- |
- |
|
Lease Maturing within 4yr. |
0.3 |
0.6 |
0.7 |
- |
- |
|
Lease Maturing within 5yr. |
0.1 |
0.1 |
0.3 |
- |
- |
|
Capital Leases - Remaining Maturities |
0.0 |
0.0 |
- |
- |
- |
|
Total Capital Leases |
4.1 |
4.1 |
3.3 |
- |
- |
|
Pension Obligation |
115.3 |
105.5 |
92.5 |
84.3 |
70.4 |
|
Fair Value of Plan Asset |
67.1 |
56.2 |
43.2 |
49.6 |
46.6 |
|
Funded Status |
-48.1 |
-49.3 |
-49.3 |
-34.7 |
-23.8 |
|
Total Funded Status |
-48.1 |
-49.3 |
-49.3 |
-34.7 |
-23.8 |
|
Discount Rate |
1.80% |
1.80% |
2.00% |
2.00% |
2.00% |
|
Expected Rate of Return |
2.00% |
2.00% |
2.00% |
2.00% |
2.00% |
|
Unrecognized Prior Service Costs |
2.8 |
2.9 |
3.1 |
3.5 |
3.3 |
|
Unrecognized Actuarial Gains and Losses |
13.0 |
16.9 |
17.6 |
9.9 |
4.2 |
|
Reserve for Accrued Retirement Benefits |
-32.4 |
-29.5 |
-28.6 |
-21.3 |
-16.4 |
|
Net Assets Recognized on Balance Sheet |
-16.6 |
-9.7 |
-7.9 |
-7.9 |
-8.9 |
|
|
|
Annual Cash Flows |
|
Financials in: USD (mil) |
|
|
31-Mar-2011 |
31-Mar-2010 |
31-Mar-2009 |
31-Mar-2008 |
31-Mar-2007 |
|
Period Length |
12 Months |
12 Months |
12 Months |
12 Months |
12 Months |
|
UpdateType/Date |
Updated Normal |
Updated Normal |
Updated Normal |
Updated Normal |
Updated Normal |
|
Filed Currency |
JPY |
JPY |
JPY |
JPY |
JPY |
|
Exchange Rate (Period Average) |
85.691434 |
92.941082 |
100.484331 |
114.302336 |
116.944303 |
|
Auditor |
Deloitte & Touche LLP |
Deloitte & Touche LLP |
Deloitte & Touche LLP |
Deloitte & Touche LLP |
Tohmatsu & Co. |
|
Auditor Opinion |
Unqualified |
Unqualified with Explanation |
Unqualified |
Unqualified |
Unqualified |
|
|
|
|
|
|
|
|
Net Income bf. Tax |
46.4 |
16.5 |
57.6 |
77.3 |
81.6 |
|
Depreciation |
21.1 |
20.9 |
20.5 |
17.6 |
13.9 |
|
Loss Impairment Assets |
0.2 |
0.2 |
1.2 |
4.5 |
0.0 |
|
Amort. Goodwill |
0.8 |
0.0 |
0.0 |
0.0 |
0.2 |
|
Loss (gain) on change in equity |
-0.1 |
0.0 |
- |
- |
- |
|
Allow. Bonus |
0.3 |
-1.5 |
-3.8 |
1.6 |
1.4 |
|
Allow. Dir's Bonus |
0.9 |
-0.4 |
0.3 |
0.2 |
0.7 |
|
Reserve for contruct losses |
0.0 |
-0.1 |
-0.6 |
0.4 |
-0.5 |
|
Reserve for plant warrant |
0.5 |
1.2 |
0.0 |
- |
- |
|
Reserve for removal of building |
- |
- |
- |
0.0 |
-0.6 |
|
Allow.Doubt.Acct. |
1.1 |
0.0 |
-0.2 |
-0.1 |
-1.0 |
|
Res.Accrd.Retir. |
-0.5 |
-0.8 |
7.0 |
1.7 |
-1.4 |
|
Allow.Dir.Retir.Bon. |
0.1 |
-0.3 |
0.2 |
0.0 |
-2.9 |
|
Accrued Directors'' retire |
-0.8 |
0.0 |
- |
- |
- |
|
Accrued Directors Severance Benefit |
- |
0.0 |
-3.1 |
-0.1 |
-0.2 |
|
Reserve for Environment Safety |
-1.2 |
-0.5 |
-0.1 |
0.2 |
-0.4 |
|
Inter.&Div. Income |
-5.0 |
-3.3 |
-6.1 |
-5.0 |
-3.9 |
|
Interest Expense |
1.1 |
1.2 |
1.5 |
1.4 |
1.4 |
|
Exchange Gain/Loss |
0.2 |
0.0 |
-0.2 |
0.0 |
0.0 |
|
Inv.Income-Equity |
-1.8 |
-2.0 |
-1.9 |
-2.0 |
-3.3 |
|
Sale/Disp/Val.PP&E |
0.1 |
0.7 |
0.9 |
-0.5 |
-2.1 |
|
Sale/Val. Inv. Sec. |
6.3 |
1.9 |
18.8 |
1.6 |
-3.0 |
|
G/L on sale of affiliated securities |
- |
0.0 |
0.3 |
0.0 |
- |
|
Sales G/L-Memberships |
- |
- |
0.0 |
0.0 |
-0.1 |
|
Val. Loss-Memberships |
0.1 |
0.5 |
0.0 |
0.1 |
0.1 |
|
Acct. Receivables |
-16.9 |
83.4 |
54.8 |
-15.0 |
-20.6 |
|
Inventories |
18.8 |
29.2 |
-8.0 |
-6.5 |
-11.7 |
|
Acct. Payables |
32.3 |
-42.4 |
-40.1 |
0.0 |
8.4 |
|
Sales Tax Payables |
1.0 |
-2.2 |
0.8 |
0.0 |
0.3 |
|
(Inc) Dec sales tax receivables |
3.1 |
0.0 |
- |
- |
- |
|
Dir. Bonus |
- |
- |
0.0 |
0.0 |
-0.4 |
|
Dir.Bonus-Minor.Int. |
- |
- |
0.0 |
0.0 |
0.0 |
|
Advances received |
-16.8 |
-36.0 |
24.1 |
1.2 |
11.5 |
|
Other |
7.7 |
-0.3 |
-8.5 |
-4.0 |
1.1 |
|
Inter.&Div. Received |
5.4 |
3.6 |
6.2 |
5.5 |
4.1 |
|
Interest Paid |
-1.1 |
-1.2 |
-1.4 |
-1.3 |
-1.4 |
|
Tax Paid |
-7.4 |
-12.2 |
-38.0 |
-35.8 |
-20.6 |
|
Income taxes refund, cash basis |
1.5 |
7.3 |
0.0 |
- |
- |
|
Adjustment |
- |
0.0 |
0.0 |
0.0 |
- |
|
Cash from Operating Activities |
97.4 |
63.3 |
82.3 |
43.0 |
50.7 |
|
|
|
|
|
|
|
|
Time Deposit Made |
-35.6 |
-16.9 |
-23.5 |
-0.3 |
-2.8 |
|
Time Deposit Matured |
19.2 |
12.8 |
24.6 |
2.2 |
0.0 |
|
Purch.Marktb.Sec. |
-1.2 |
0.0 |
0.0 |
0.0 |
0.0 |
|
Sale Marktb.Sec. |
1.5 |
1.8 |
1.3 |
4.4 |
5.1 |
|
Capital Expenditures |
-30.1 |
-26.6 |
-35.5 |
-20.9 |
-29.5 |
|
Sale PP&E |
0.5 |
0.9 |
3.6 |
2.0 |
4.6 |
|
Purch. Inv. Sec. |
-15.0 |
-8.1 |
-14.1 |
-17.8 |
-20.3 |
|
Sale Inv. Sec. |
3.2 |
4.5 |
10.4 |
11.3 |
10.7 |
|
Purch.Subsid.Stock |
- |
- |
- |
- |
0.0 |
|
Purchase of Treasury Stock of Subsidiary |
- |
- |
- |
- |
0.0 |
|
Loan Made |
-0.1 |
-1.5 |
0.0 |
-2.3 |
0.0 |
|
Loan Collected |
0.5 |
0.1 |
0.3 |
0.6 |
0.5 |
|
Purch.Subsid.Stock-conso. |
-5.3 |
0.0 |
- |
- |
- |
|
Proceeds from liquidation of subsidiarie |
0.2 |
0.0 |
- |
- |
- |
|
Purch. Intangible |
-2.8 |
-4.1 |
-2.6 |
-0.5 |
-0.5 |
|
Purchase of businesses |
- |
0.0 |
-1.5 |
0.0 |
- |
|
Sale Other Inv.Asset |
1.0 |
0.1 |
0.1 |
-0.1 |
1.1 |
|
Cash from Investing Activities |
-63.9 |
-36.9 |
-37.0 |
-21.4 |
-31.1 |
|
|
|
|
|
|
|
|
ST Debt, Net |
1.2 |
-8.9 |
5.9 |
-6.4 |
-7.2 |
|
Repayment of finance lease |
-1.3 |
-1.0 |
-0.4 |
0.0 |
- |
|
LT Debt Proceed |
14.8 |
0.0 |
0.0 |
3.5 |
0.1 |
|
LT Debt Paid |
-4.0 |
-0.7 |
-0.8 |
-5.6 |
-1.2 |
|
Bond Issued |
6.0 |
0.0 |
1.0 |
21.9 |
0.0 |
|
Bond Redeemed |
- |
0.0 |
-14.9 |
0.0 |
-17.1 |
|
Proceeds from stock issuance to minority |
0.0 |
0.3 |
0.0 |
- |
- |
|
Purchase of treasury stock of subsidiari |
0.0 |
0.0 |
- |
- |
- |
|
Sale-Treasury Stock |
0.7 |
0.0 |
- |
0.0 |
1.0 |
|
Purch.Treasury Stock |
-2.9 |
-0.1 |
0.0 |
-1.1 |
-1.7 |
|
Dividend Paid |
-6.3 |
-7.6 |
-8.1 |
-6.4 |
-5.6 |
|
Dividend Paid MI |
-0.8 |
-0.8 |
-1.0 |
-0.7 |
-0.5 |
|
Cash from Financing Activities |
7.4 |
-18.8 |
-18.5 |
5.1 |
-32.1 |
|
|
|
|
|
|
|
|
Foreign Exchange Effects |
-8.3 |
2.4 |
-7.5 |
1.4 |
2.0 |
|
Net Change in Cash |
32.6 |
10.0 |
19.2 |
28.0 |
-10.5 |
|
|
|
|
|
|
|
|
Net Cash - Beginning Balance |
254.2 |
224.3 |
188.3 |
137.5 |
144.9 |
|
Net Cash - Ending Balance |
286.8 |
234.4 |
207.5 |
165.5 |
134.4 |
|
Cash Interest Paid |
1.1 |
1.2 |
1.4 |
1.3 |
1.4 |
|
Cash Taxes Paid |
5.9 |
4.9 |
38.0 |
35.8 |
20.6 |
Financial Health
|
Financials in: USD (mil) Except for share items (millions) and per share
items (actual units) |
|
Key Indicators USD (mil) |
||||||
|
|
Quarter |
Quarter |
Annual |
1 Year |
3 Year |
5 Year |
|
Total Revenue1 (?) |
257.5 |
23.79% |
868.7 |
9.03% |
-11.48% |
-3.44% |
|
Research & Development1 (?) |
- |
- |
16.4 |
-0.43% |
2.57% |
- |
|
Operating Income1 (?) |
12.7 |
143.95% |
45.5 |
302.06% |
-21.36% |
-6.92% |
|
Income Available to Common Excl Extraord Items1 (?) |
7.9 |
68.68% |
27.0 |
306.85% |
-22.72% |
-10.84% |
|
Basic EPS Excl Extraord Items1 (?) |
0.15 |
69.25% |
0.50 |
307.39% |
-22.65% |
-10.68% |
|
Capital Expenditures2 (?) |
28.1 |
- |
32.8 |
-1.30% |
4.70% |
3.81% |
|
Cash from Operating Activities2 (?) |
-19.0 |
- |
97.4 |
41.86% |
19.34% |
5.42% |
|
Free Cash Flow (?) |
-48.6 |
- |
66.8 |
82.43% |
31.04% |
6.30% |
|
Total Assets3 (?) |
1,313.1 |
8.31% |
1,206.8 |
3.28% |
-3.83% |
-1.65% |
|
Total Liabilities3 (?) |
481.8 |
17.67% |
437.8 |
11.18% |
-9.05% |
-5.52% |
|
Total Long Term Debt3 (?) |
54.4 |
22.77% |
53.7 |
53.52% |
14.98% |
14.62% |
|
Employees3 (?) |
- |
- |
3521 |
1.06% |
0.46% |
1.55% |
|
Total Common Shares Outstanding3 (?) |
54.3 |
-0.34% |
54.3 |
-0.34% |
-0.13% |
-0.15% |
|
1-ExchangeRate: JPY to USD Average for Period |
77.752043 |
|
85.691434 |
|
|
|
|
2-ExchangeRate: JPY to USD Average for Period |
79.672811 |
|
85.691434 |
|
|
|
|
3-ExchangeRate: JPY to USD Period End Date |
77.080000 |
|
82.880000 |
|
|
|
|
Key Ratios |
|||||
|
|
31-Mar-2011 |
31-Mar-2010 |
31-Mar-2009 |
31-Mar-2008 |
31-Mar-2007 |
|
Profitability |
|||||
|
Gross Margin (?) |
29.51% |
26.88% |
27.08% |
26.34% |
27.58% |
|
Operating Margin (?) |
5.24% |
1.42% |
5.18% |
7.47% |
8.33% |
|
Pretax Margin (?) |
5.36% |
2.26% |
5.97% |
8.24% |
9.94% |
|
Net Profit Margin (?) |
3.11% |
0.83% |
3.43% |
4.67% |
6.12% |
|
Financial Strength |
|||||
|
Current Ratio (?) |
2.45 |
2.51 |
2.13 |
1.85 |
1.74 |
|
Long Term Debt/Equity (?) |
0.07 |
0.05 |
0.05 |
0.05 |
0.03 |
|
Total Debt/Equity (?) |
0.11 |
0.09 |
0.10 |
0.11 |
0.09 |
|
Management Effectiveness |
|||||
|
Return on Assets (?) |
2.62% |
0.61% |
3.20% |
4.61% |
5.50% |
|
Return on Equity (?) |
3.62% |
0.90% |
5.27% |
7.78% |
9.39% |
|
Efficiency |
|||||
|
Receivables Turnover (?) |
3.19 |
2.59 |
2.91 |
3.00 |
2.86 |
|
Inventory Turnover (?) |
5.98 |
4.57 |
5.80 |
6.70 |
6.59 |
|
Asset Turnover (?) |
0.76 |
0.68 |
0.90 |
0.95 |
0.87 |
|
Market Valuation USD (mil) |
||||
|
P/E (TTM) (?) |
11.79 |
. |
Enterprise Value2 (?) |
306.1 |
|
Price/Sales (TTM) (?) |
0.45 |
. |
Enterprise Value/Revenue (TTM) (?) |
0.29 |
|
Price/Book (MRQ) (?) |
0.55 |
. |
Enterprise Value/EBITDA (TTM) (?) |
3.34 |
|
Market Cap as of 25-Nov-20111 (?) |
475.4 |
. |
|
|
|
1-ExchangeRate: JPY to USD on 25-Nov-2011 |
77.680000 |
|
|
|
|
2-ExchangeRate: JPY to USD on 30-Sep-2011 |
77.080000 |
|
|
|
ANNUAL RATIOS
|
Financials in:
USD (mil) |
|
|
Except for share
items (millions) and per share items (actual units) |
|
|
|
|||||||||||||||||||||||||||||||||||||||||||||||||||||||||||||||||||||||||||||||||||||||||||||||||||||||||||||||||||||||||||||||||||||||||||||||||||||||||||||||||||||||||||||||||||||||||||||||||||||||||||||||||||||||||||||||||||||||||||||||||||||||||||||||||||
|
|||||||||||||||||||||||||||||||||||||||||||||||||||||||||||||||||||||||||||||||||||||||||||||||||||||||||||||||||||||||||||||||||||||||||||||||||||||||||||||||||||||||||||||||||||||||||||||||||||||||||||||||||||||||||||||||||||||||||||||||||||||||||||||||||||
|
|||||||||||||||||||||||||||||||||||||||||||||||||||||||||||||||||||||||||||||||||||||||||||||||||||||||||||||||||||||||||||||||||||||||||||||||||||||||||||||||||||||||||||||||||||||||||||||||||||||||||||||||||||||||||||||||||||||||||||||||||||||||||||||||||||
ANNUAL INCOME
STATEMENT
Standardized
|
Financials in:
USD (mil) |
|
|
Except for share
items (millions) and per share items (actual units) |
|
|
|
31-Mar-2011 |
31-Mar-2010 |
31-Mar-2009 |
31-Mar-2008 |
31-Mar-2007 |
|
Period Length |
12 Months |
12 Months |
12 Months |
12 Months |
12 Months |
|
UpdateType/Date |
Updated Normal |
Updated Normal |
Updated Normal |
Updated Normal |
Updated Normal |
|
Filed Currency |
JPY |
JPY |
JPY |
JPY |
JPY |
|
Exchange Rate (Period Average) |
85.691434 |
92.941082 |
100.484331 |
114.302336 |
116.944303 |
|
Auditor |
Deloitte & Touche LLP |
Deloitte & Touche LLP |
Deloitte & Touche LLP |
Deloitte & Touche LLP |
Tohmatsu & Co. |
|
Auditor Opinion |
Unqualified |
Unqualified with Explanation |
Unqualified |
Unqualified |
Unqualified |
|
|
|
|
|
|
|
|
Net Sales |
868.7 |
734.5 |
967.0 |
938.9 |
821.5 |
|
Revenue |
868.7 |
734.5 |
967.0 |
938.9 |
821.5 |
|
Total Revenue |
868.7 |
734.5 |
967.0 |
938.9 |
821.5 |
|
|
|
|
|
|
|
|
Cost of Revenue |
612.3 |
537.1 |
705.1 |
691.6 |
594.9 |
|
Cost of Revenue, Total |
612.3 |
537.1 |
705.1 |
691.6 |
594.9 |
|
Gross Profit |
256.4 |
197.4 |
261.8 |
247.3 |
226.6 |
|
|
|
|
|
|
|
|
Selling/General/Administrative Expense |
77.7 |
65.2 |
70.3 |
62.7 |
58.0 |
|
Labor & Related Expense |
104.6 |
98.1 |
98.8 |
89.3 |
78.9 |
|
Advertising Expense |
2.8 |
2.2 |
3.1 |
3.2 |
1.9 |
|
Total Selling/General/Administrative Expenses |
185.1 |
165.5 |
172.2 |
155.2 |
138.8 |
|
Research & Development |
16.4 |
15.2 |
15.2 |
11.4 |
11.4 |
|
Depreciation |
4.8 |
4.2 |
4.6 |
3.6 |
3.3 |
|
Amortization of Acquisition Costs |
0.8 |
0.0 |
0.0 |
0.0 |
0.2 |
|
Depreciation/Amortization |
5.6 |
4.2 |
4.6 |
3.6 |
3.5 |
|
Litigation |
- |
- |
- |
0.0 |
-0.1 |
|
Impairment-Assets Held for Use |
0.3 |
0.6 |
2.4 |
5.1 |
0.4 |
|
Impairment-Assets Held for Sale |
2.8 |
1.4 |
17.3 |
1.3 |
0.0 |
|
Other Unusual Expense (Income) |
0.5 |
0.2 |
0.0 |
0.6 |
4.2 |
|
Unusual Expense (Income) |
3.7 |
2.1 |
19.7 |
7.0 |
4.5 |
|
Total Operating Expense |
823.2 |
724.1 |
916.8 |
868.8 |
753.1 |
|
|
|
|
|
|
|
|
Operating Income |
45.5 |
10.4 |
50.1 |
70.1 |
68.4 |
|
|
|
|
|
|
|
|
Interest Expense -
Non-Operating |
-1.1 |
-1.2 |
-1.5 |
-1.4 |
-1.4 |
|
Interest Expense, Net Non-Operating |
-1.1 |
-1.2 |
-1.5 |
-1.4 |
-1.4 |
|
Interest Income -
Non-Operating |
2.5 |
1.2 |
2.3 |
2.0 |
1.4 |
|
Investment Income -
Non-Operating |
-0.3 |
3.5 |
4.0 |
5.8 |
10.6 |
|
Interest/Investment Income - Non-Operating |
2.3 |
4.8 |
6.3 |
7.8 |
11.9 |
|
Interest Income (Expense) - Net Non-Operating Total |
1.2 |
3.6 |
4.9 |
6.4 |
10.5 |
|
Gain (Loss) on Sale of Assets |
0.1 |
-0.3 |
0.2 |
1.0 |
2.5 |
|
Other Non-Operating Income (Expense) |
-0.2 |
2.9 |
2.6 |
-0.2 |
0.2 |
|
Other, Net |
-0.2 |
2.9 |
2.6 |
-0.2 |
0.2 |
|
Income Before Tax |
46.5 |
16.6 |
57.7 |
77.4 |
81.6 |
|
|
|
|
|
|
|
|
Total Income Tax |
16.4 |
10.0 |
23.5 |
31.9 |
29.5 |
|
Income After Tax |
30.1 |
6.6 |
34.3 |
45.5 |
52.2 |
|
|
|
|
|
|
|
|
Minority Interest |
-3.0 |
-0.3 |
-1.0 |
-1.5 |
-1.9 |
|
Net Income Before Extraord Items |
27.1 |
6.2 |
33.2 |
44.0 |
50.3 |
|
Net Income |
27.1 |
6.2 |
33.2 |
44.0 |
50.3 |
|
|
|
|
|
|
|
|
Miscellaneous Earnings Adjustment |
-0.1 |
-0.1 |
-0.1 |
-0.1 |
0.0 |
|
Total Adjustments to Net Income |
-0.1 |
-0.1 |
-0.1 |
-0.1 |
0.0 |
|
Income Available to Common Excl Extraord Items |
27.0 |
6.1 |
33.1 |
43.9 |
50.3 |
|
|
|
|
|
|
|
|
Income Available to Common Incl Extraord Items |
27.0 |
6.1 |
33.1 |
43.9 |
50.3 |
|
|
|
|
|
|
|
|
Basic/Primary Weighted Average Shares |
54.4 |
54.5 |
54.5 |
54.6 |
54.6 |
|
Basic EPS Excl Extraord Items |
0.50 |
0.11 |
0.61 |
0.80 |
0.92 |
|
Basic/Primary EPS Incl Extraord Items |
0.50 |
0.11 |
0.61 |
0.80 |
0.92 |
|
Dilution Adjustment |
0.0 |
0.0 |
0.0 |
0.0 |
0.0 |
|
Diluted Net Income |
27.0 |
6.1 |
33.1 |
43.9 |
50.3 |
|
Diluted Weighted Average Shares |
54.4 |
54.5 |
54.5 |
54.6 |
54.6 |
|
Diluted EPS Excl Extraord Items |
0.50 |
0.11 |
0.61 |
0.80 |
0.92 |
|
Diluted EPS Incl Extraord Items |
0.50 |
0.11 |
0.61 |
0.80 |
0.92 |
|
Dividends per Share - Common Stock Primary Issue |
0.14 |
0.11 |
0.16 |
0.12 |
0.11 |
|
Gross Dividends - Common Stock |
7.6 |
5.9 |
8.7 |
6.7 |
6.1 |
|
Interest Expense, Supplemental |
1.1 |
1.2 |
1.5 |
1.4 |
1.4 |
|
Depreciation, Supplemental |
21.1 |
20.9 |
20.5 |
17.6 |
13.9 |
|
Total Special Items |
4.4 |
2.5 |
19.5 |
5.9 |
2.1 |
|
Normalized Income Before Tax |
50.9 |
19.1 |
77.2 |
83.3 |
83.8 |
|
|
|
|
|
|
|
|
Effect of Special Items on Income Taxes |
1.3 |
0.9 |
7.9 |
2.5 |
0.7 |
|
Inc Tax Ex Impact of Sp Items |
17.7 |
10.9 |
31.4 |
34.4 |
30.2 |
|
Normalized Income After Tax |
33.2 |
8.2 |
45.8 |
49.0 |
53.6 |
|
|
|
|
|
|
|
|
Normalized Inc. Avail to Com. |
30.1 |
7.7 |
44.7 |
47.3 |
51.7 |
|
|
|
|
|
|
|
|
Basic Normalized EPS |
0.55 |
0.14 |
0.82 |
0.87 |
0.95 |
|
Diluted Normalized EPS |
0.55 |
0.14 |
0.82 |
0.87 |
0.95 |
|
Amort of Acquisition Costs, Supplemental |
0.8 |
0.0 |
0.0 |
-0.1 |
0.1 |
|
Rental Expenses |
7.3 |
7.0 |
6.8 |
4.8 |
4.4 |
|
Advertising Expense, Supplemental |
2.8 |
2.2 |
3.1 |
3.2 |
1.9 |
|
Research & Development Exp, Supplemental |
16.8 |
15.7 |
16.3 |
12.3 |
12.3 |
|
Reported Operating Profit |
49.1 |
12.4 |
70.3 |
77.0 |
72.8 |
|
Reported Ordinary Profit |
50.2 |
17.7 |
77.7 |
83.3 |
82.4 |
|
Normalized EBIT |
49.2 |
12.6 |
69.8 |
77.2 |
72.9 |
|
Normalized EBITDA |
71.1 |
33.5 |
90.3 |
94.7 |
86.9 |
|
Interest Cost - Domestic |
1.8 |
1.7 |
1.4 |
1.3 |
1.1 |
|
Service Cost - Domestic |
7.9 |
4.4 |
11.2 |
5.6 |
4.2 |
|
Prior Service Cost - Domestic |
0.5 |
0.4 |
0.4 |
0.3 |
0.7 |
|
Expected Return on Assets - Domestic |
-1.1 |
-0.8 |
-0.8 |
-0.9 |
-0.8 |
|
Actuarial Gains and Losses - Domestic |
3.2 |
3.3 |
1.9 |
1.1 |
1.2 |
|
Domestic Pension Plan Expense |
12.2 |
9.0 |
14.0 |
7.4 |
6.4 |
|
Defined Contribution Expense - Domestic |
1.6 |
1.5 |
1.3 |
1.1 |
0.0 |
|
Total Pension Expense |
13.8 |
10.5 |
15.4 |
8.5 |
6.4 |
|
Discount Rate - Domestic |
1.80% |
1.80% |
2.00% |
2.00% |
2.00% |
|
Expected Rate of Return - Domestic |
2.00% |
2.00% |
2.00% |
2.00% |
2.00% |
|
Total Plan Interest Cost |
1.8 |
1.7 |
1.4 |
1.3 |
1.1 |
|
Total Plan Service Cost |
7.9 |
4.4 |
11.2 |
5.6 |
4.2 |
|
Total Plan Expected Return |
-1.1 |
-0.8 |
-0.8 |
-0.9 |
-0.8 |
INTERIM INCOME
STATEMENT
STANDARDIZED
|
Financials in:
USD (mil) |
|
|
Except for share
items (millions) and per share items (actual units) |
|
|
|
30-Sep-2011 |
30-Jun-2011 |
31-Mar-2011 |
31-Dec-2010 |
30-Sep-2010 |
|
Period Length |
3 Months |
3 Months |
3 Months |
3 Months |
3 Months |
|
UpdateType/Date |
Updated Normal |
Updated Normal |
Updated Normal |
Updated Normal |
Updated Normal |
|
Filed Currency |
JPY |
JPY |
JPY |
JPY |
JPY |
|
Exchange Rate (Period Average) |
77.752043 |
81.605269 |
82.241044 |
82.567473 |
85.838925 |
|
|
|
|
|
|
|
|
Net Sales |
257.5 |
243.3 |
280.3 |
225.5 |
188.4 |
|
Revenue |
257.5 |
243.3 |
280.3 |
225.5 |
188.4 |
|
Total Revenue |
257.5 |
243.3 |
280.3 |
225.5 |
188.4 |
|
|
|
|
|
|
|
|
Cost of Revenue |
182.3 |
172.8 |
189.0 |
159.1 |
135.5 |
|
Cost of Revenue, Total |
182.3 |
172.8 |
189.0 |
159.1 |
135.5 |
|
Gross Profit |
75.2 |
70.4 |
91.3 |
66.4 |
52.9 |
|
|
|
|
|
|
|
|
Selling/General/Administrative Expense |
62.0 |
57.4 |
30.7 |
31.3 |
25.4 |
|
Labor & Related Expense |
- |
- |
28.6 |
24.4 |
22.2 |
|
Total Selling/General/Administrative Expenses |
62.0 |
57.4 |
59.3 |
55.7 |
47.6 |
|
Amortization of Acquisition Costs |
0.0 |
0.0 |
0.0 |
0.0 |
- |
|
Depreciation/Amortization |
0.0 |
0.0 |
0.0 |
0.0 |
- |
|
Impairment-Assets Held for Use |
0.0 |
0.3 |
0.1 |
- |
0.1 |
|
Impairment-Assets Held for Sale |
0.1 |
1.1 |
0.8 |
1.8 |
0.4 |
|
Other Unusual Expense (Income) |
0.4 |
0.0 |
0.8 |
- |
0.1 |
|
Unusual Expense (Income) |
0.5 |
1.4 |
1.7 |
1.8 |
0.5 |
|
Total Operating Expense |
244.8 |
231.6 |
250.0 |
216.6 |
183.7 |
|
|
|
|
|
|
|
|
Operating Income |
12.7 |
11.7 |
30.3 |
8.8 |
4.7 |
|
|
|
|
|
|
|
|
Interest Expense -
Non-Operating |
-0.4 |
-0.3 |
-0.3 |
-0.3 |
-0.3 |
|
Interest Expense, Net Non-Operating |
-0.4 |
-0.3 |
-0.3 |
-0.3 |
-0.3 |
|
Interest Income -
Non-Operating |
0.7 |
0.9 |
0.8 |
0.8 |
0.6 |
|
Investment Income -
Non-Operating |
0.9 |
3.4 |
-2.7 |
1.1 |
-0.1 |
|
Interest/Investment Income - Non-Operating |
1.6 |
4.3 |
-1.9 |
1.8 |
0.6 |
|
Interest Income (Expense) - Net Non-Operating Total |
1.2 |
4.0 |
-2.2 |
1.5 |
0.3 |
|
Gain (Loss) on Sale of Assets |
0.0 |
0.1 |
0.0 |
0.0 |
- |
|
Other Non-Operating Income (Expense) |
-0.9 |
0.5 |
-0.5 |
0.1 |
0.3 |
|
Other, Net |
-0.9 |
0.5 |
-0.5 |
0.1 |
0.3 |
|
Income Before Tax |
13.0 |
16.2 |
27.6 |
10.5 |
5.3 |
|
|
|
|
|
|
|
|
Total Income Tax |
4.7 |
7.0 |
9.3 |
5.7 |
0.7 |
|
Income After Tax |
8.3 |
9.2 |
18.3 |
4.7 |
4.6 |
|
|
|
|
|
|
|
|
Minority Interest |
-0.4 |
-0.9 |
-1.7 |
-0.5 |
-0.4 |
|
Net Income Before Extraord Items |
7.9 |
8.4 |
16.6 |
4.3 |
4.3 |
|
Net Income |
7.9 |
8.4 |
16.6 |
4.3 |
4.3 |
|
|
|
|
|
|
|
|
Miscellaneous Earnings Adjustment |
0.0 |
0.0 |
-0.1 |
0.0 |
0.0 |
|
Total Adjustments to Net Income |
0.0 |
0.0 |
-0.1 |
0.0 |
0.0 |
|
Income Available to Common Excl Extraord Items |
7.9 |
8.3 |
16.6 |
4.2 |
4.2 |
|
|
|
|
|
|
|
|
Income Available to Common Incl Extraord Items |
7.9 |
8.3 |
16.6 |
4.2 |
4.2 |
|
|
|
|
|
|
|
|
Basic/Primary Weighted Average Shares |
54.3 |
54.3 |
54.3 |
54.5 |
54.5 |
|
Basic EPS Excl Extraord Items |
0.15 |
0.15 |
0.31 |
0.08 |
0.08 |
|
Basic/Primary EPS Incl Extraord Items |
0.15 |
0.15 |
0.31 |
0.08 |
0.08 |
|
Dilution Adjustment |
0.0 |
0.0 |
0.0 |
0.0 |
0.0 |
|
Diluted Net Income |
7.9 |
8.3 |
16.6 |
4.2 |
4.2 |
|
Diluted Weighted Average Shares |
54.3 |
54.3 |
54.3 |
54.5 |
54.5 |
|
Diluted EPS Excl Extraord Items |
0.15 |
0.15 |
0.31 |
0.08 |
0.08 |
|
Diluted EPS Incl Extraord Items |
0.15 |
0.15 |
0.31 |
0.08 |
0.08 |
|
Dividends per Share - Common Stock Primary Issue |
0.08 |
0.00 |
0.09 |
0.00 |
0.06 |
|
Gross Dividends - Common Stock |
4.2 |
0.0 |
4.6 |
0.0 |
3.2 |
|
Interest Expense, Supplemental |
0.4 |
0.3 |
0.3 |
0.3 |
0.3 |
|
Depreciation, Supplemental |
5.8 |
5.4 |
5.6 |
5.7 |
5.1 |
|
Total Special Items |
0.4 |
1.5 |
1.6 |
2.7 |
0.5 |
|
Normalized Income Before Tax |
13.5 |
17.7 |
29.3 |
13.1 |
5.8 |
|
|
|
|
|
|
|
|
Effect of Special Items on Income Taxes |
0.2 |
0.6 |
0.6 |
1.0 |
0.1 |
|
Inc Tax Ex Impact of Sp Items |
4.9 |
7.5 |
9.9 |
6.8 |
0.7 |
|
Normalized Income After Tax |
8.6 |
10.2 |
19.4 |
6.4 |
5.1 |
|
|
|
|
|
|
|
|
Normalized Inc. Avail to Com. |
8.2 |
9.3 |
17.7 |
5.9 |
4.7 |
|
|
|
|
|
|
|
|
Basic Normalized EPS |
0.15 |
0.17 |
0.33 |
0.11 |
0.09 |
|
Diluted Normalized EPS |
0.15 |
0.17 |
0.33 |
0.11 |
0.09 |
|
Amort of Acquisition Costs, Supplemental |
0.0 |
0.2 |
0.0 |
0.8 |
0.0 |
|
Reported Operating Profit |
13.2 |
13.1 |
31.8 |
10.7 |
5.2 |
|
Reported Ordinary Profit |
13.5 |
17.5 |
29.1 |
12.3 |
5.7 |
|
Normalized EBIT |
13.2 |
13.1 |
32.0 |
10.7 |
5.2 |
|
Normalized EBITDA |
18.9 |
18.6 |
37.5 |
17.2 |
10.4 |
ANNUAL BALANCE
SHEET
STANDARDIZED
|
Financials in:
USD (mil) |
|
|
Except for share
items (millions) and per share items (actual units) |
|
|
|
31-Mar-2011 |
31-Mar-2010 |
31-Mar-2009 |
31-Mar-2008 |
31-Mar-2007 |
|
UpdateType/Date |
Updated Normal |
Updated Normal |
Updated Normal |
Updated Normal |
Updated Normal |
|
Filed Currency |
JPY |
JPY |
JPY |
JPY |
JPY |
|
Exchange Rate |
82.88 |
93.44 |
98.77 |
99.535 |
118.075 |
|
Auditor |
Deloitte & Touche LLP |
Deloitte & Touche LLP |
Deloitte & Touche LLP |
Deloitte & Touche LLP |
Tohmatsu & Co. |
|
Auditor Opinion |
Unqualified |
Unqualified with Explanation |
Unqualified |
Unqualified |
Unqualified |
|
|
|
|
|
|
|
|
Cash & Equivalents |
235.3 |
167.9 |
163.5 |
117.2 |
102.6 |
|
Short Term Investments |
87.1 |
78.6 |
53.5 |
79.1 |
42.4 |
|
Cash and Short Term Investments |
322.4 |
246.5 |
217.0 |
196.3 |
145.0 |
|
Accounts Receivable -
Trade, Gross |
293.2 |
243.8 |
306.4 |
369.9 |
296.9 |
|
Provision for Doubtful
Accounts |
-2.6 |
-1.8 |
-1.6 |
-1.9 |
-1.6 |
|
Trade Accounts Receivable - Net |
290.5 |
242.0 |
304.8 |
368.0 |
295.3 |
|
Total Receivables, Net |
290.5 |
242.0 |
304.8 |
368.0 |
295.3 |
|
Inventories - Finished Goods |
17.5 |
14.4 |
16.7 |
16.0 |
- |
|
Inventories - Work In Progress |
48.3 |
61.3 |
76.0 |
79.8 |
- |
|
Inventories - Raw Materials |
28.9 |
28.1 |
30.5 |
27.2 |
- |
|
Total Inventory |
94.7 |
103.7 |
123.3 |
123.0 |
96.0 |
|
Deferred Income Tax - Current Asset |
16.6 |
12.5 |
12.1 |
14.5 |
12.3 |
|
Other Current Assets |
12.6 |
13.3 |
23.2 |
11.2 |
6.3 |
|
Other Current Assets, Total |
29.2 |
25.7 |
35.4 |
25.7 |
18.6 |
|
Total Current Assets |
736.9 |
618.0 |
680.5 |
712.9 |
554.9 |
|
|
|
|
|
|
|
|
Buildings |
210.2 |
191.2 |
163.7 |
168.4 |
135.6 |
|
Land/Improvements |
63.9 |
53.3 |
48.8 |
46.6 |
38.6 |
|
Machinery/Equipment |
222.7 |
200.6 |
188.0 |
194.8 |
162.0 |
|
Construction in
Progress |
16.8 |
2.0 |
5.4 |
1.6 |
1.2 |
|
Leases |
3.7 |
2.5 |
1.0 |
- |
- |
|
Other
Property/Plant/Equipment |
41.2 |
38.1 |
34.9 |
37.3 |
30.3 |
|
Property/Plant/Equipment - Gross |
558.6 |
487.6 |
441.8 |
448.6 |
367.6 |
|
Accumulated Depreciation |
-344.2 |
-302.1 |
-272.1 |
-283.4 |
-230.7 |
|
Property/Plant/Equipment - Net |
214.4 |
185.6 |
169.7 |
165.2 |
136.8 |
|
Goodwill, Net |
0.6 |
- |
- |
- |
0.0 |
|
Intangibles, Net |
12.8 |
11.8 |
8.6 |
5.4 |
5.7 |
|
LT Investments - Other |
200.0 |
185.8 |
148.4 |
211.3 |
233.6 |
|
Long Term Investments |
200.0 |
185.8 |
148.4 |
211.3 |
233.6 |
|
Note Receivable - Long Term |
2.8 |
3.5 |
2.3 |
2.2 |
0.2 |
|
Deferred Income Tax - Long Term Asset |
7.4 |
7.0 |
5.6 |
5.2 |
3.3 |
|
Restricted Cash - Long Term |
22.0 |
0.0 |
- |
- |
- |
|
Other Long Term Assets |
9.9 |
24.7 |
26.8 |
27.7 |
23.2 |
|
Other Long Term Assets, Total |
39.3 |
31.7 |
32.4 |
32.9 |
26.6 |
|
Total Assets |
1,206.8 |
1,036.4 |
1,042.0 |
1,129.8 |
957.7 |
|
|
|
|
|
|
|
|
Accounts Payable |
166.4 |
120.3 |
152.8 |
202.0 |
167.7 |
|
Accrued Expenses |
23.2 |
18.8 |
21.2 |
24.2 |
18.6 |
|
Notes Payable/Short Term Debt |
26.4 |
26.5 |
29.3 |
26.0 |
33.4 |
|
Current Portion - Long Term Debt/Capital Leases |
3.7 |
1.2 |
1.4 |
15.9 |
0.0 |
|
Customer Advances |
29.2 |
45.7 |
75.0 |
56.4 |
44.7 |
|
Income Taxes Payable |
10.1 |
3.2 |
5.9 |
20.0 |
19.8 |
|
Other Current Liabilities |
41.1 |
30.2 |
34.6 |
40.5 |
35.2 |
|
Other Current liabilities, Total |
80.5 |
79.0 |
115.4 |
116.8 |
99.7 |
|
Total Current Liabilities |
300.2 |
245.9 |
320.1 |
384.9 |
319.3 |
|
|
|
|
|
|
|
|
Long Term Debt |
51.2 |
28.1 |
29.9 |
29.4 |
13.8 |
|
Capital Lease Obligations |
2.5 |
2.9 |
2.5 |
0.0 |
- |
|
Total Long Term Debt |
53.7 |
31.0 |
32.5 |
29.4 |
13.8 |
|
Total Debt |
83.7 |
58.7 |
63.2 |
71.3 |
47.2 |
|
|
|
|
|
|
|
|
Deferred Income Tax - LT Liability |
21.3 |
15.9 |
5.4 |
17.8 |
36.5 |
|
Deferred Income Tax |
21.3 |
15.9 |
5.4 |
17.8 |
36.5 |
|
Minority Interest |
19.9 |
16.1 |
15.0 |
16.6 |
13.4 |
|
Reserves |
0.8 |
3.0 |
3.3 |
3.3 |
2.6 |
|
Pension Benefits - Underfunded |
34.2 |
32.4 |
31.7 |
27.3 |
21.4 |
|
Other Long Term Liabilities |
7.7 |
5.0 |
4.8 |
5.2 |
3.0 |
|
Other Liabilities, Total |
42.7 |
40.4 |
39.8 |
35.8 |
27.1 |
|
Total Liabilities |
437.8 |
349.3 |
412.7 |
484.6 |
410.2 |
|
|
|
|
|
|
|
|
Common Stock |
69.4 |
61.6 |
58.2 |
57.8 |
48.7 |
|
Common Stock |
69.4 |
61.6 |
58.2 |
57.8 |
48.7 |
|
Additional Paid-In Capital |
75.6 |
66.9 |
63.3 |
62.8 |
52.9 |
|
Retained Earnings (Accumulated Deficit) |
644.8 |
553.0 |
524.6 |
494.9 |
381.0 |
|
Treasury Stock - Common |
-15.7 |
-12.3 |
-11.5 |
-11.4 |
-8.6 |
|
Unrealized Gain (Loss) |
25.2 |
33.7 |
15.0 |
43.6 |
77.2 |
|
Translation Adjustment |
-30.4 |
-15.8 |
-20.3 |
-2.4 |
-3.7 |
|
Other Equity, Total |
-30.4 |
-15.8 |
-20.3 |
-2.4 |
-3.7 |
|
Total Equity |
768.9 |
687.0 |
629.3 |
645.3 |
547.6 |
|
|
|
|
|
|
|
|
Total Liabilities & Shareholders’ Equity |
1,206.8 |
1,036.3 |
1,041.9 |
1,129.8 |
957.7 |
|
|
|
|
|
|
|
|
Shares Outstanding - Common Stock Primary Issue |
54.3 |
54.5 |
54.5 |
54.5 |
54.6 |
|
Total Common Shares Outstanding |
54.3 |
54.5 |
54.5 |
54.5 |
54.6 |
|
Treasury Shares - Common Stock Primary Issue |
2.3 |
2.1 |
2.1 |
2.0 |
1.9 |
|
Employees |
3,521 |
3,484 |
3,621 |
3,473 |
3,343 |
|
Number of Common Shareholders |
5,017 |
5,631 |
5,924 |
4,788 |
4,422 |
|
Deferred Revenue - Current |
29.2 |
45.7 |
75.0 |
56.4 |
44.7 |
|
Total Long Term Debt, Supplemental |
53.2 |
31.6 |
30.6 |
45.3 |
19.0 |
|
Long Term Debt Maturing within 1 Year |
2.1 |
3.5 |
0.7 |
15.9 |
5.2 |
|
Long Term Debt Maturing in Year 2 |
33.0 |
0.2 |
3.3 |
0.6 |
13.3 |
|
Long Term Debt Maturing in Year 3 |
5.2 |
26.9 |
0.2 |
3.4 |
0.4 |
|
Long Term Debt Maturing in Year 4 |
5.2 |
1.1 |
25.4 |
0.2 |
0.1 |
|
Long Term Debt Maturing in Year 5 |
3.5 |
0.0 |
1.0 |
25.2 |
- |
|
Long Term Debt Maturing in 2-3 Years |
38.2 |
27.1 |
3.5 |
4.0 |
13.7 |
|
Long Term Debt Maturing in 4-5 Years |
8.7 |
1.1 |
26.4 |
25.4 |
0.1 |
|
Long Term Debt Matur. in Year 6 & Beyond |
4.3 |
0.0 |
0.0 |
0.0 |
0.0 |
|
Total Capital Leases, Supplemental |
4.1 |
4.1 |
3.3 |
- |
- |
|
Capital Lease Payments Due in Year 1 |
1.6 |
1.2 |
0.8 |
- |
- |
|
Capital Lease Payments Due in Year 2 |
1.4 |
1.2 |
0.8 |
- |
- |
|
Capital Lease Payments Due in Year 3 |
0.8 |
1.0 |
0.8 |
- |
- |
|
Capital Lease Payments Due in Year 4 |
0.3 |
0.6 |
0.7 |
- |
- |
|
Capital Lease Payments Due in Year 5 |
0.1 |
0.1 |
0.3 |
- |
- |
|
Capital Lease Payments Due in 2-3 Years |
2.2 |
2.2 |
1.6 |
- |
- |
|
Capital Lease Payments Due in 4-5 Years |
0.3 |
0.7 |
0.9 |
- |
- |
|
Cap. Lease Pymts. Due in Year 6 & Beyond |
0.0 |
0.0 |
- |
- |
- |
|
Pension Obligation - Domestic |
115.3 |
105.5 |
92.5 |
84.3 |
70.4 |
|
Plan Assets - Domestic |
67.1 |
56.2 |
43.2 |
49.6 |
46.6 |
|
Funded Status - Domestic |
-48.1 |
-49.3 |
-49.3 |
-34.7 |
-23.8 |
|
Total Funded Status |
-48.1 |
-49.3 |
-49.3 |
-34.7 |
-23.8 |
|
Discount Rate - Domestic |
1.80% |
1.80% |
2.00% |
2.00% |
2.00% |
|
Expected Rate of Return - Domestic |
2.00% |
2.00% |
2.00% |
2.00% |
2.00% |
|
Accrued Liabilities - Domestic |
-32.4 |
-29.5 |
-28.6 |
-21.3 |
-16.4 |
|
Other Assets, Net - Domestic |
15.8 |
19.8 |
20.7 |
13.4 |
7.4 |
|
Net Assets Recognized on Balance Sheet |
-16.6 |
-9.7 |
-7.9 |
-7.9 |
-8.9 |
|
Total Plan Obligations |
115.3 |
105.5 |
92.5 |
84.3 |
70.4 |
|
Total Plan Assets |
67.1 |
56.2 |
43.2 |
49.6 |
46.6 |
Interim Balance
Sheet
Standardized
|
Financials in:
USD (mil) |
|
|
Except for share
items (millions) and per share items (actual units) |
|
|
|
30-Sep-2011 |
30-Jun-2011 |
31-Mar-2011 |
31-Dec-2010 |
30-Sep-2010 |
|
UpdateType/Date |
Updated Normal |
Updated Normal |
Updated Normal |
Updated Normal |
Updated Normal |
|
Filed Currency |
JPY |
JPY |
JPY |
JPY |
JPY |
|
Exchange Rate |
77.08 |
80.76 |
82.88 |
81.105 |
83.54 |
|
|
|
|
|
|
|
|
Cash & Equivalents |
224.5 |
231.4 |
235.3 |
195.4 |
214.6 |
|
Short Term Investments |
59.9 |
78.2 |
87.1 |
91.9 |
88.5 |
|
Cash and Short Term Investments |
284.4 |
309.6 |
322.4 |
287.3 |
303.1 |
|
Accounts Receivable -
Trade, Gross |
350.4 |
321.3 |
293.2 |
286.5 |
250.2 |
|
Provision for Doubtful
Accounts |
-3.1 |
-2.8 |
-2.6 |
-3.2 |
-2.3 |
|
Trade Accounts Receivable - Net |
347.3 |
318.5 |
290.5 |
283.2 |
247.9 |
|
Total Receivables, Net |
347.3 |
318.5 |
290.5 |
283.2 |
247.9 |
|
Inventories - Finished Goods |
21.5 |
19.7 |
17.5 |
16.0 |
14.7 |
|
Inventories - Work In Progress |
61.0 |
53.9 |
48.3 |
69.2 |
54.4 |
|
Inventories - Raw Materials |
36.1 |
34.2 |
28.9 |
32.2 |
30.2 |
|
Total Inventory |
118.6 |
107.7 |
94.7 |
117.4 |
99.3 |
|
Other Current Assets |
33.9 |
29.6 |
29.2 |
33.3 |
27.9 |
|
Other Current Assets, Total |
33.9 |
29.6 |
29.2 |
33.3 |
27.9 |
|
Total Current Assets |
784.2 |
765.4 |
736.9 |
721.3 |
678.2 |
|
|
|
|
|
|
|
|
Property/Plant/Equipment - Net |
258.2 |
234.1 |
214.4 |
213.7 |
198.1 |
|
Goodwill, Net |
0.6 |
0.6 |
0.6 |
0.6 |
0.6 |
|
Intangibles, Net |
12.8 |
12.8 |
12.8 |
12.3 |
12.4 |
|
LT Investments - Other |
198.3 |
201.8 |
200.0 |
203.8 |
186.2 |
|
Long Term Investments |
198.3 |
201.8 |
200.0 |
203.8 |
186.2 |
|
Other Long Term Assets |
59.0 |
43.9 |
42.1 |
43.8 |
43.0 |
|
Other Long Term Assets, Total |
59.0 |
43.9 |
42.1 |
43.8 |
43.0 |
|
Total Assets |
1,313.1 |
1,258.6 |
1,206.8 |
1,195.4 |
1,118.6 |
|
|
|
|
|
|
|
|
Accounts Payable |
172.5 |
174.1 |
166.4 |
160.2 |
126.0 |
|
Accrued Expenses |
21.1 |
10.1 |
20.0 |
11.0 |
16.1 |
|
Notes Payable/Short Term Debt |
32.3 |
28.3 |
26.4 |
30.4 |
30.3 |
|
Current Portion - Long Term Debt/Capital Leases |
1.7 |
1.6 |
3.7 |
0.8 |
- |
|
Income Taxes Payable |
6.0 |
4.2 |
10.1 |
4.5 |
3.2 |
|
Other Current Liabilities |
105.0 |
97.9 |
73.6 |
93.5 |
87.5 |
|
Other Current liabilities, Total |
111.1 |
102.1 |
83.7 |
97.9 |
90.7 |
|
Total Current Liabilities |
338.6 |
316.2 |
300.2 |
300.3 |
263.2 |
|
|
|
|
|
|
|
|
Long Term Debt |
54.4 |
52.2 |
51.2 |
41.5 |
40.9 |
|
Capital Lease Obligations |
- |
- |
2.5 |
- |
- |
|
Total Long Term Debt |
54.4 |
52.2 |
53.7 |
41.5 |
40.9 |
|
Total Debt |
88.5 |
82.2 |
83.7 |
72.7 |
71.2 |
|
|
|
|
|
|
|
|
Deferred Income Tax - LT Liability |
- |
- |
21.3 |
- |
- |
|
Deferred Income Tax |
- |
- |
21.3 |
- |
- |
|
Minority Interest |
23.0 |
21.5 |
19.9 |
19.3 |
18.5 |
|
Reserves |
2.3 |
2.2 |
2.2 |
2.2 |
2.2 |
|
Pension Benefits - Underfunded |
35.9 |
35.4 |
34.2 |
35.1 |
33.9 |
|
Other Long Term Liabilities |
27.6 |
31.6 |
6.3 |
25.6 |
19.2 |
|
Other Liabilities, Total |
65.8 |
69.3 |
42.7 |
63.0 |
55.2 |
|
Total Liabilities |
481.8 |
459.2 |
437.8 |
424.0 |
377.8 |
|
|
|
|
|
|
|
|
Common Stock |
74.6 |
71.2 |
69.4 |
70.9 |
68.9 |
|
Common Stock |
74.6 |
71.2 |
69.4 |
70.9 |
68.9 |
|
Additional Paid-In Capital |
81.3 |
77.6 |
75.6 |
77.1 |
74.8 |
|
Retained Earnings (Accumulated Deficit) |
705.2 |
665.5 |
644.8 |
642.1 |
622.5 |
|
Treasury Stock - Common |
-16.9 |
-16.2 |
-15.7 |
-16.6 |
-13.8 |
|
Unrealized Gain (Loss) |
13.5 |
25.2 |
25.2 |
26.1 |
16.6 |
|
Translation Adjustment |
-26.5 |
-24.1 |
-30.4 |
-28.3 |
-28.2 |
|
Other Equity, Total |
-26.5 |
-24.1 |
-30.4 |
-28.3 |
-28.2 |
|
Total Equity |
831.3 |
799.3 |
768.9 |
771.3 |
740.7 |
|
|
|
|
|
|
|
|
Total Liabilities & Shareholders’ Equity |
1,313.1 |
1,258.6 |
1,206.8 |
1,195.4 |
1,118.6 |
|
|
|
|
|
|
|
|
Shares Outstanding - Common Stock Primary
Issue |
54.3 |
54.3 |
54.3 |
54.2 |
54.5 |
|
Total Common Shares Outstanding |
54.3 |
54.3 |
54.3 |
54.2 |
54.5 |
|
Treasury Shares - Common Stock Primary Issue |
2.3 |
2.3 |
2.3 |
2.3 |
2.1 |
|
Employees |
- |
- |
3,521 |
3,500 |
3,473 |
ANNUAL CASH FLOWS
STANDARDIZED
|
Financials in:
USD (mil) |
|
|
Except for share
items (millions) and per share items (actual units) |
|
|
|
31-Mar-2011 |
31-Mar-2010 |
31-Mar-2009 |
31-Mar-2008 |
31-Mar-2007 |
|
Period Length |
12 Months |
12 Months |
12 Months |
12 Months |
12 Months |
|
UpdateType/Date |
Updated Normal |
Updated Normal |
Updated Normal |
Updated Normal |
Updated Normal |
|
Filed Currency |
JPY |
JPY |
JPY |
JPY |
JPY |
|
Exchange Rate (Period Average) |
85.691434 |
92.941082 |
100.484331 |
114.302336 |
116.944303 |
|
Auditor |
Deloitte & Touche LLP |
Deloitte & Touche LLP |
Deloitte & Touche LLP |
Deloitte & Touche LLP |
Tohmatsu & Co. |
|
Auditor Opinion |
Unqualified |
Unqualified with Explanation |
Unqualified |
Unqualified |
Unqualified |
|
|
|
|
|
|
|
|
Net Income/Starting Line |
46.4 |
16.5 |
57.6 |
77.3 |
81.6 |
|
Depreciation |
21.1 |
20.9 |
20.5 |
17.6 |
13.9 |
|
Depreciation/Depletion |
21.1 |
20.9 |
20.5 |
17.6 |
13.9 |
|
Amortization of Acquisition Costs |
0.8 |
0.0 |
0.0 |
0.0 |
0.2 |
|
Amortization |
0.8 |
0.0 |
0.0 |
0.0 |
0.2 |
|
Unusual Items |
6.6 |
3.3 |
21.3 |
5.7 |
-5.0 |
|
Equity in Net Earnings (Loss) |
-1.8 |
-2.0 |
-1.9 |
-2.0 |
-3.3 |
|
Other Non-Cash Items |
-4.6 |
-2.7 |
-1.6 |
-1.5 |
-9.3 |
|
Non-Cash Items |
0.1 |
-1.3 |
17.8 |
2.2 |
-17.6 |
|
Accounts Receivable |
-13.8 |
83.4 |
54.8 |
-15.0 |
-20.6 |
|
Inventories |
18.8 |
29.2 |
-8.0 |
-6.5 |
-11.7 |
|
Accounts Payable |
32.3 |
-42.4 |
-40.1 |
0.0 |
8.4 |
|
Accrued Expenses |
1.2 |
-1.9 |
-3.5 |
1.7 |
2.1 |
|
Taxes Payable |
1.0 |
-2.2 |
0.8 |
0.0 |
0.3 |
|
Other Liabilities |
-16.8 |
-36.0 |
24.1 |
1.2 |
11.5 |
|
Other Operating Cash Flow |
6.1 |
-2.8 |
-41.8 |
-35.6 |
-17.3 |
|
Changes in Working Capital |
28.9 |
27.2 |
-13.7 |
-54.2 |
-27.4 |
|
Cash from Operating Activities |
97.4 |
63.3 |
82.3 |
43.0 |
50.7 |
|
|
|
|
|
|
|
|
Purchase of Fixed Assets |
-30.1 |
-26.6 |
-35.5 |
-20.9 |
-29.5 |
|
Purchase/Acquisition of Intangibles |
-2.8 |
-4.1 |
-2.6 |
-0.5 |
-0.5 |
|
Capital Expenditures |
-32.8 |
-30.7 |
-38.1 |
-21.5 |
-30.0 |
|
Acquisition of Business |
- |
0.0 |
-1.5 |
0.0 |
- |
|
Sale of Business |
0.2 |
0.0 |
- |
- |
- |
|
Sale of Fixed Assets |
0.5 |
0.9 |
3.6 |
2.0 |
4.6 |
|
Sale/Maturity of Investment |
23.9 |
19.2 |
36.3 |
17.8 |
15.9 |
|
Investment, Net |
1.0 |
0.1 |
0.1 |
-0.1 |
1.1 |
|
Purchase of Investments |
-57.0 |
-25.0 |
-37.6 |
-18.1 |
-23.1 |
|
Other Investing Cash Flow |
0.4 |
-1.4 |
0.3 |
-1.7 |
0.5 |
|
Other Investing Cash Flow Items, Total |
-31.1 |
-6.3 |
1.2 |
0.0 |
-1.0 |
|
Cash from Investing Activities |
-63.9 |
-36.9 |
-37.0 |
-21.4 |
-31.1 |
|
|
|
|
|
|
|
|
Other Financing Cash Flow |
-0.8 |
-0.4 |
-1.0 |
-0.7 |
-0.5 |
|
Financing Cash Flow Items |
-0.8 |
-0.4 |
-1.0 |
-0.7 |
-0.5 |
|
Cash Dividends Paid - Common |
-6.3 |
-7.6 |
-8.1 |
-6.4 |
-5.6 |
|
Total Cash Dividends Paid |
-6.3 |
-7.6 |
-8.1 |
-6.4 |
-5.6 |
|
Sale/Issuance of
Common |
0.7 |
0.0 |
- |
0.0 |
1.0 |
|
Repurchase/Retirement
of Common |
-2.9 |
-0.1 |
0.0 |
-1.1 |
-1.7 |
|
Common Stock, Net |
-2.2 |
-0.1 |
0.0 |
-1.1 |
-0.6 |
|
Issuance (Retirement) of Stock, Net |
-2.2 |
-0.1 |
0.0 |
-1.1 |
-0.6 |
|
Short Term Debt, Net |
1.2 |
-8.9 |
5.9 |
-6.4 |
-7.2 |
|
Long Term Debt Issued |
20.8 |
0.0 |
1.0 |
25.3 |
0.1 |
|
Long Term Debt
Reduction |
-5.3 |
-1.7 |
-16.2 |
-5.6 |
-18.3 |
|
Long Term Debt, Net |
15.5 |
-1.7 |
-15.2 |
19.8 |
-18.2 |
|
Issuance (Retirement) of Debt, Net |
16.7 |
-10.6 |
-9.3 |
13.3 |
-25.4 |
|
Cash from Financing Activities |
7.4 |
-18.8 |
-18.5 |
5.1 |
-32.1 |
|
|
|
|
|
|
|
|
Foreign Exchange Effects |
-8.3 |
2.4 |
-7.5 |
1.4 |
2.0 |
|
Net Change in Cash |
32.6 |
10.0 |
19.2 |
28.0 |
-10.5 |
|
|
|
|
|
|
|
|
Net Cash - Beginning Balance |
254.2 |
224.3 |
188.3 |
137.5 |
144.9 |
|
Net Cash - Ending Balance |
286.8 |
234.4 |
207.5 |
165.5 |
134.4 |
|
Cash Interest Paid |
1.1 |
1.2 |
1.4 |
1.3 |
1.4 |
|
Cash Taxes Paid |
5.9 |
4.9 |
38.0 |
35.8 |
20.6 |
INTERIM CASH FLOWS
STANDARDIZED
|
Financials in:
USD (mil) |
|
|
Except for share
items (millions) and per share items (actual units) |
|
|
|
30-Sep-2011 |
31-Mar-2011 |
31-Dec-2010 |
30-Sep-2010 |
30-Jun-2010 |
|
Period Length |
6 Months |
12 Months |
9 Months |
6 Months |
3 Months |
|
UpdateType/Date |
Updated Normal |
Updated Normal |
Updated Normal |
Updated Normal |
Updated Normal |
|
Filed Currency |
JPY |
JPY |
JPY |
JPY |
JPY |
|
Exchange Rate (Period Average) |
79.672811 |
85.691434 |
86.812446 |
88.962162 |
92.080323 |
|
|
|
|
|
|
|
|
Net Income/Starting Line |
29.3 |
46.4 |
19.8 |
9.6 |
4.3 |
|
Depreciation |
11.1 |
21.1 |
15.5 |
9.9 |
4.8 |
|
Depreciation/Depletion |
11.1 |
21.1 |
15.5 |
9.9 |
4.8 |
|
Amortization of Acquisition Costs |
0.2 |
0.8 |
0.8 |
0.0 |
0.0 |
|
Amortization |
0.2 |
0.8 |
0.8 |
0.0 |
0.0 |
|
Unusual Items |
1.8 |
6.6 |
2.2 |
0.5 |
0.0 |
|
Equity in Net Earnings (Loss) |
-2.7 |
-1.8 |
-1.2 |
-0.8 |
-0.6 |
|
Other Non-Cash Items |
-3.0 |
-4.6 |
-4.1 |
-3.9 |
-2.8 |
|
Non-Cash Items |
-3.9 |
0.1 |
-3.1 |
-4.2 |
-3.4 |
|
Accounts Receivable |
-31.5 |
-13.8 |
-0.2 |
21.7 |
10.1 |
|
Inventories |
-15.1 |
18.8 |
0.4 |
11.3 |
8.0 |
|
Accounts Payable |
-9.1 |
32.3 |
21.4 |
-3.6 |
-4.2 |
|
Accrued Expenses |
-0.6 |
1.2 |
-7.7 |
-2.2 |
-9.4 |
|
Taxes Payable |
-0.5 |
1.0 |
0.9 |
2.0 |
1.5 |
|
Other Liabilities |
10.0 |
-16.8 |
-5.4 |
-6.7 |
-6.8 |
|
Other Operating Cash Flow |
-8.8 |
6.1 |
4.8 |
7.0 |
6.4 |
|
Changes in Working Capital |
-55.7 |
28.9 |
14.4 |
29.4 |
5.6 |
|
Cash from Operating Activities |
-19.0 |
97.4 |
47.4 |
44.7 |
11.3 |
|
|
|
|
|
|
|
|
Purchase of Fixed Assets |
-27.8 |
-30.1 |
-18.4 |
-5.1 |
-1.6 |
|
Purchase/Acquisition of Intangibles |
-0.3 |
-2.8 |
-1.3 |
-1.1 |
-0.5 |
|
Capital Expenditures |
-28.1 |
-32.8 |
-19.8 |
-6.2 |
-2.2 |
|
Sale of Business |
0.0 |
0.2 |
0.2 |
0.2 |
- |
|
Sale of Fixed Assets |
0.8 |
0.5 |
0.3 |
0.2 |
0.1 |
|
Sale/Maturity of Investment |
12.4 |
23.9 |
13.9 |
8.6 |
1.7 |
|
Purchase of Investments |
-45.8 |
-57.0 |
-43.2 |
-21.9 |
-9.4 |
|
Other Investing Cash Flow |
0.4 |
1.4 |
1.6 |
1.8 |
0.4 |
|
Other Investing Cash Flow Items, Total |
-32.1 |
-31.1 |
-27.2 |
-11.2 |
-7.2 |
|
Cash from Investing Activities |
-60.2 |
-63.9 |
-47.0 |
-17.4 |
-9.4 |
|
|
|
|
|
|
|
|
Other Financing Cash Flow |
-0.9 |
-0.8 |
0.0 |
0.0 |
0.0 |
|
Financing Cash Flow Items |
-0.9 |
-0.8 |
0.0 |
0.0 |
0.0 |
|
Cash Dividends Paid - Common |
-4.8 |
-6.3 |
-6.2 |
-3.0 |
-2.9 |
|
Total Cash Dividends Paid |
-4.8 |
-6.3 |
-6.2 |
-3.0 |
-2.9 |
|
Sale/Issuance of
Common |
- |
0.7 |
- |
- |
- |
|
Repurchase/Retirement
of Common |
0.0 |
-2.9 |
-2.9 |
-0.1 |
0.0 |
|
Common Stock, Net |
0.0 |
-2.2 |
-2.9 |
-0.1 |
0.0 |
|
Issuance (Retirement) of Stock, Net |
0.0 |
-2.2 |
-2.9 |
-0.1 |
0.0 |
|
Short Term Debt, Net |
2.5 |
1.2 |
-0.3 |
0.5 |
0.2 |
|
Long Term Debt Issued |
1.0 |
20.8 |
10.0 |
9.3 |
8.9 |
|
Long Term Debt
Reduction |
-2.8 |
-5.3 |
-1.2 |
-0.8 |
-0.4 |
|
Long Term Debt, Net |
-1.7 |
15.5 |
8.7 |
8.5 |
8.4 |
|
Issuance (Retirement) of Debt, Net |
0.8 |
16.7 |
8.5 |
9.0 |
8.6 |
|
Cash from Financing Activities |
-4.9 |
7.4 |
-0.7 |
5.9 |
5.6 |
|
|
|
|
|
|
|
|
Foreign Exchange Effects |
4.9 |
-8.3 |
-6.2 |
-7.8 |
-1.9 |
|
Net Change in Cash |
-79.2 |
32.6 |
-6.4 |
25.3 |
5.7 |
|
|
|
|
|
|
|
|
Net Cash - Beginning Balance |
308.5 |
254.2 |
250.9 |
244.8 |
236.5 |
|
Net Cash - Ending Balance |
229.3 |
286.8 |
244.5 |
270.2 |
242.2 |
|
Cash Interest Paid |
0.6 |
1.1 |
0.9 |
0.5 |
0.3 |
|
Cash Taxes Paid |
13.0 |
5.9 |
4.2 |
2.4 |
2.2 |
ANNUAL INCOME
STATEMENT
AS REPORTED
|
Financials in:
USD (mil) |
|
|
Except for share
items (millions) and per share items (actual units) |
|
|
|
31-Mar-2011 |
31-Mar-2010 |
31-Mar-2009 |
31-Mar-2008 |
31-Mar-2007 |
|
Period Length |
12 Months |
12 Months |
12 Months |
12 Months |
12 Months |
|
UpdateType/Date |
Updated Normal |
Updated Normal |
Updated Normal |
Updated Normal |
Updated Normal |
|
Filed Currency |
JPY |
JPY |
JPY |
JPY |
JPY |
|
Exchange Rate (Period Average) |
85.691434 |
92.941082 |
100.484331 |
114.302336 |
116.944303 |
|
Auditor |
Deloitte & Touche LLP |
Deloitte & Touche LLP |
Deloitte & Touche LLP |
Deloitte & Touche LLP |
Tohmatsu & Co. |
|
Auditor Opinion |
Unqualified |
Unqualified with Explanation |
Unqualified |
Unqualified |
Unqualified |
|
|
|
|
|
|
|
|
Net Sales |
868.7 |
734.5 |
967.0 |
938.9 |
821.5 |
|
Total Revenue |
868.7 |
734.5 |
967.0 |
938.9 |
821.5 |
|
|
|
|
|
|
|
|
Cost of Sales |
612.3 |
537.1 |
705.1 |
691.6 |
594.9 |
|
Shipping |
20.1 |
15.6 |
20.2 |
20.0 |
18.4 |
|
Sales Commission |
10.9 |
8.4 |
7.2 |
6.8 |
5.9 |
|
Patent Usage |
0.2 |
0.8 |
0.8 |
0.9 |
0.6 |
|
Advertising |
2.8 |
2.2 |
3.1 |
3.2 |
1.9 |
|
Entertainment |
1.8 |
1.5 |
2.1 |
2.0 |
2.0 |
|
Travel, Transpor. |
11.8 |
10.3 |
10.9 |
9.8 |
9.0 |
|
Payrolls |
78.7 |
74.7 |
74.7 |
69.4 |
60.6 |
|
Provision for bonuses |
7.8 |
7.0 |
6.4 |
6.3 |
6.2 |
|
Provision for dir's bonuses |
2.0 |
1.2 |
1.3 |
0.8 |
0.7 |
|
Periodic retirement benefit costs |
4.8 |
4.3 |
6.1 |
3.2 |
2.4 |
|
Prov. for dirs' retirment benefits |
0.2 |
0.2 |
0.3 |
0.3 |
0.3 |
|
Welfare expenses |
11.0 |
10.7 |
10.1 |
9.3 |
8.7 |
|
Taxes, other than income taxes |
2.6 |
2.4 |
2.8 |
2.5 |
2.4 |
|
Office Supplies |
1.3 |
1.2 |
1.4 |
1.4 |
1.3 |
|
Communication |
2.6 |
2.5 |
2.3 |
1.8 |
1.7 |
|
Depreciation |
4.8 |
4.2 |
4.0 |
3.6 |
3.3 |
|
Rental Expense |
7.3 |
7.0 |
6.8 |
4.8 |
4.4 |
|
Amort. of Goodwill |
0.8 |
0.1 |
0.0 |
0.1 |
0.3 |
|
Provision for doubtful accounts(SGA) |
0.6 |
0.1 |
0.2 |
0.0 |
- |
|
R & D expenses |
16.4 |
15.2 |
15.2 |
11.4 |
11.4 |
|
Other SG&A |
18.6 |
15.5 |
15.6 |
12.7 |
12.2 |
|
SP Rev.Allow.Doubt.Acct |
- |
- |
0.0 |
0.0 |
-0.2 |
|
SP Rev. Allow. Environmental Exp. |
- |
- |
- |
0.0 |
-0.1 |
|
SP Rev. Allow. Blg. Withdrawal Exp. |
- |
- |
- |
0.0 |
-0.1 |
|
SP Rev. Ligitation Loss |
- |
- |
- |
0.0 |
-0.1 |
|
SP Rev. G on Prov. for Plant warranty |
0.0 |
-0.2 |
0.0 |
- |
- |
|
SP Rev. G on Prov.for envir. measure |
0.0 |
-0.1 |
0.0 |
- |
- |
|
SP Loss Retir.Fix.Asset |
0.2 |
0.4 |
1.3 |
0.5 |
0.4 |
|
SP Loss Val. Fix. Asset |
- |
- |
- |
- |
0.0 |
|
SP Loss Impairment Assets |
0.2 |
0.2 |
1.2 |
4.5 |
0.0 |
|
SP Nonrecurring depreciation |
- |
0.0 |
0.7 |
0.0 |
- |
|
SP Loss Val. Inv. Sec. |
2.8 |
1.4 |
17.3 |
1.3 |
0.0 |
|
SP Environment Safety Prep. expense |
- |
- |
0.0 |
0.2 |
0.0 |
|
SP Reserve for Environment Safety Prep. |
- |
- |
- |
- |
0.0 |
|
SP Reserve for removal of building costs |
- |
- |
- |
- |
0.0 |
|
SP Restoration expense |
- |
- |
- |
0.0 |
0.0 |
|
SP Product Compensation |
- |
- |
0.0 |
0.3 |
4.2 |
|
SP Loss-Contract Cancelled |
- |
- |
- |
0.0 |
0.2 |
|
SP Loss Val. Membership |
0.1 |
0.5 |
0.0 |
0.1 |
0.1 |
|
SP Other Loss |
0.4 |
0.0 |
- |
- |
- |
|
NOP Amort.negative Goodwill |
0.0 |
0.0 |
0.0 |
-0.1 |
-0.1 |
|
Total Operating Expense |
823.2 |
724.1 |
916.8 |
868.8 |
753.1 |
|
|
|
|
|
|
|
|
NOP Interest Income |
2.5 |
1.2 |
2.3 |
2.0 |
1.4 |
|
NOP Dividend Income |
2.5 |
2.1 |
3.8 |
3.0 |
2.5 |
|
NOP Gain Equity Investment |
1.8 |
2.0 |
1.9 |
2.0 |
3.3 |
|
NOP Insurance Dividend |
- |
- |
0.5 |
1.1 |
1.4 |
|
NOP G-Managing Inv. Fund |
- |
- |
- |
0.0 |
2.2 |
|
NOP Other Non-Op.Income |
2.8 |
4.5 |
3.8 |
2.5 |
2.2 |
|
NOP Interest Expense |
-1.1 |
-1.2 |
-1.5 |
-1.4 |
-1.4 |
|
NOP Exchange Loss |
-1.4 |
0.0 |
- |
- |
- |
|
NOP L-Managing Inv. Fund |
-3.0 |
-1.8 |
-2.3 |
-0.3 |
0.0 |
|
NOP Provision of allow. for doubtful ac. |
-1.0 |
0.0 |
- |
- |
- |
|
NOP Other Non-Op.Expense |
-2.1 |
-1.6 |
-1.2 |
-2.7 |
-2.0 |
|
SP Gain Sale Fix.Asset |
0.1 |
0.1 |
0.4 |
1.2 |
2.5 |
|
SP Gain Sale Inv. Sec. |
0.1 |
1.3 |
0.7 |
0.0 |
1.1 |
|
SP Gains on equity changes |
0.1 |
0.0 |
- |
- |
- |
|
SP Gain Sale Memberships |
- |
- |
- |
0.0 |
0.1 |
|
SP L on liquidation of LT inv't in secs |
- |
- |
- |
0.0 |
0.0 |
|
SP Loss Sale Fix.Asset |
0.0 |
-0.4 |
-0.2 |
-0.2 |
-0.1 |
|
SP L on redemp. of invest. secs. |
-0.4 |
0.0 |
- |
- |
- |
|
SP Loss Change Equity |
- |
0.0 |
-0.2 |
0.0 |
- |
|
SP Loss Sale Inv. Secs. |
- |
- |
0.0 |
0.0 |
0.0 |
|
SP Loss Sale Affil.Stk. |
- |
0.0 |
-0.3 |
0.0 |
- |
|
SP Loss Sale Memberships |
- |
- |
- |
0.0 |
0.0 |
|
Net Income Before Taxes |
46.5 |
16.6 |
57.7 |
77.4 |
81.6 |
|
|
|
|
|
|
|
|
Provision for Income Taxes |
16.4 |
10.0 |
23.5 |
31.9 |
29.5 |
|
Net Income After Taxes |
30.1 |
6.6 |
34.3 |
45.5 |
52.2 |
|
|
|
|
|
|
|
|
MinorityInterest |
-3.0 |
-0.3 |
-1.0 |
-1.5 |
-1.9 |
|
Net Income Before Extra. Items |
27.1 |
6.2 |
33.2 |
44.0 |
50.3 |
|
Net Income |
27.1 |
6.2 |
33.2 |
44.0 |
50.3 |
|
|
|
|
|
|
|
|
Directors' Bonuses |
- |
- |
- |
- |
0.0 |
|
Adjustment |
-0.1 |
-0.1 |
-0.1 |
-0.1 |
0.0 |
|
Income Available to Com Excl ExtraOrd |
27.0 |
6.1 |
33.1 |
43.9 |
50.3 |
|
|
|
|
|
|
|
|
Income Available to Com Incl ExtraOrd |
27.0 |
6.1 |
33.1 |
43.9 |
50.3 |
|
|
|
|
|
|
|
|
Basic Weighted Average Shares |
54.4 |
54.5 |
54.5 |
54.6 |
54.6 |
|
Basic EPS Excluding ExtraOrdinary Items |
0.50 |
0.11 |
0.61 |
0.80 |
0.92 |
|
Basic EPS Including ExtraOrdinary Item |
0.50 |
0.11 |
0.61 |
0.80 |
0.92 |
|
Dilution Adjustment |
0.0 |
0.0 |
0.0 |
0.0 |
0.0 |
|
Diluted Net Income |
27.0 |
6.1 |
33.1 |
43.9 |
50.3 |
|
Diluted Weighted Average Shares |
54.4 |
54.5 |
54.5 |
54.6 |
54.6 |
|
Diluted EPS Excluding ExtraOrd Items |
0.50 |
0.11 |
0.61 |
0.80 |
0.92 |
|
Diluted EPS Including ExtraOrd Items |
0.50 |
0.11 |
0.61 |
0.80 |
0.92 |
|
DPS-Common Stock |
0.14 |
0.11 |
0.16 |
0.12 |
0.11 |
|
Gross Dividends - Common Stock |
7.6 |
5.9 |
8.7 |
6.7 |
6.1 |
|
Normalized Income Before Taxes |
50.9 |
19.1 |
77.2 |
83.3 |
83.8 |
|
|
|
|
|
|
|
|
Inc Tax Ex Impact of Sp Items |
17.7 |
10.9 |
31.4 |
34.4 |
30.2 |
|
Normalized Income After Taxes |
33.2 |
8.2 |
45.8 |
49.0 |
53.6 |
|
|
|
|
|
|
|
|
Normalized Inc. Avail to Com. |
30.1 |
7.7 |
44.7 |
47.3 |
51.7 |
|
|
|
|
|
|
|
|
Basic Normalized EPS |
0.55 |
0.14 |
0.82 |
0.87 |
0.95 |
|
Diluted Normalized EPS |
0.55 |
0.14 |
0.82 |
0.87 |
0.95 |
|
Rental Expense |
7.3 |
7.0 |
6.8 |
4.8 |
4.4 |
|
R & D expenses (SGA) |
16.4 |
15.2 |
15.2 |
11.4 |
11.4 |
|
R & D expenses (COGS) |
0.4 |
0.5 |
1.1 |
0.9 |
0.9 |
|
Advertising Expense |
2.8 |
2.2 |
3.1 |
3.2 |
1.9 |
|
Interest Expense |
1.1 |
1.2 |
1.5 |
1.4 |
1.4 |
|
Depreciation |
21.1 |
20.9 |
20.5 |
17.6 |
13.9 |
|
Amort of Goodwill |
0.8 |
0.0 |
0.0 |
0.0 |
0.2 |
|
Amortization of negative goodwill |
- |
- |
- |
-0.1 |
-0.1 |
|
Reported Operating Profit |
49.1 |
12.4 |
70.3 |
77.0 |
72.8 |
|
Reported Ordinary Profit |
50.2 |
17.7 |
77.7 |
83.3 |
82.4 |
|
Service Cost |
7.9 |
4.4 |
11.2 |
5.6 |
4.2 |
|
Interest Cost |
1.8 |
1.7 |
1.4 |
1.3 |
1.1 |
|
Expected Return of Plan Asset |
-1.1 |
-0.8 |
-0.8 |
-0.9 |
-0.8 |
|
Prior Service Costs |
0.5 |
0.4 |
0.4 |
0.3 |
0.7 |
|
Actuarial G/L |
3.2 |
3.3 |
1.9 |
1.1 |
1.2 |
|
Domestic Pension Plan Expense |
12.2 |
9.0 |
14.0 |
7.4 |
6.4 |
|
Defined contribution expense |
1.6 |
1.5 |
1.3 |
1.1 |
0.0 |
|
Total Pension Expense |
13.8 |
10.5 |
15.4 |
8.5 |
6.4 |
|
Discount Rate |
1.80% |
1.80% |
2.00% |
2.00% |
2.00% |
|
Expected Rate of Return |
2.00% |
2.00% |
2.00% |
2.00% |
2.00% |
INTERIM INCOME
STATEMENT
AS REPORTED
|
Financials in:
USD (mil) |
|
|
Except for share
items (millions) and per share items (actual units) |
|
|
|
30-Jun-2011 |
31-Mar-2011 |
31-Dec-2010 |
30-Sep-2010 |
30-Jun-2010 |
|
Period Length |
3 Months |
3 Months |
3 Months |
3 Months |
3 Months |
|
UpdateType/Date |
Updated Normal |
Updated Normal |
Updated Normal |
Updated Normal |
Updated Normal |
|
Filed Currency |
JPY |
JPY |
JPY |
JPY |
JPY |
|
Exchange Rate (Period Average) |
81.605269 |
82.241044 |
82.567473 |
85.838925 |
92.080323 |
|
|
|
|
|
|
|
|
Net sales |
243.3 |
280.3 |
225.5 |
188.4 |
180.2 |
|
Total Revenue |
243.3 |
280.3 |
225.5 |
188.4 |
180.2 |
|
|
|
|
|
|
|
|
Cost of Sales |
172.8 |
189.0 |
159.1 |
135.5 |
132.0 |
|
Total SGA |
57.4 |
- |
- |
- |
- |
|
Payroll |
- |
26.3 |
18.7 |
17.8 |
16.5 |
|
Reserve for Bonus |
- |
- |
4.0 |
3.0 |
3.3 |
|
Reserve for Director Bonus |
- |
1.3 |
0.3 |
0.2 |
0.2 |
|
Periodic Retirement Benefit |
- |
1.0 |
1.3 |
1.2 |
1.2 |
|
Reserve for Director Retirement Bonus |
- |
0.1 |
0.0 |
0.0 |
0.0 |
|
Reserve for Doubtful Account |
- |
- |
0.6 |
0.2 |
0.2 |
|
Other General Expenses |
- |
30.7 |
30.7 |
25.2 |
23.9 |
|
SP Rev. environment measure reserve |
- |
-0.1 |
- |
- |
- |
|
SP Other gain |
0.0 |
0.0 |
- |
0.0 |
0.0 |
|
SP L. on retire. of fixed assets |
- |
0.1 |
- |
0.1 |
- |
|
SP Loss Impairment Assets |
0.3 |
- |
- |
- |
0.0 |
|
SP L on val. of LT inv't. secs. |
1.1 |
0.8 |
1.8 |
0.3 |
0.0 |
|
SP Provision for environmental measures |
0.0 |
- |
- |
- |
0.1 |
|
SP L on val. of membership |
- |
0.0 |
0.0 |
0.1 |
- |
|
SP Other loss |
0.0 |
0.9 |
- |
0.1 |
0.0 |
|
NOP Amort. of negative goodwill |
0.0 |
0.0 |
0.0 |
- |
0.0 |
|
Total Operating Expense |
231.6 |
250.0 |
216.6 |
183.7 |
177.6 |
|
|
|
|
|
|
|
|
NOP Interest Income |
0.9 |
0.8 |
0.8 |
0.6 |
0.4 |
|
NOP Dividend Income |
1.5 |
0.2 |
1.0 |
0.1 |
1.1 |
|
NOP Foreign exchange gains. |
1.1 |
- |
- |
- |
0.0 |
|
NOP Equity gains |
0.9 |
0.7 |
0.4 |
0.2 |
0.6 |
|
NOP Other income |
0.9 |
1.0 |
0.4 |
0.7 |
0.7 |
|
NOP Interest Expense |
-0.3 |
-0.3 |
-0.3 |
-0.3 |
-0.2 |
|
NOP Donation |
-0.1 |
- |
- |
- |
-0.1 |
|
NOP Foreign exchange losses |
- |
-0.7 |
-0.4 |
-0.3 |
- |
|
NOP L on Investment Union |
- |
-2.9 |
- |
-0.1 |
- |
|
NOP Other expense |
-0.3 |
-1.5 |
-0.3 |
-0.4 |
-0.8 |
|
SP G on sale of fixed assets |
0.1 |
0.0 |
0.0 |
- |
0.1 |
|
SP G on sale of LT inv't. secs. |
0.0 |
0.1 |
0.0 |
0.0 |
0.0 |
|
SP Gains on Equity Changes |
- |
0.0 |
- |
0.1 |
- |
|
SP L on sale/retire. of fixed assets |
- |
- |
0.0 |
- |
- |
|
SP L on sale of LT inv't. secs. |
0.0 |
- |
- |
- |
-0.1 |
|
Net Income Before Taxes |
16.2 |
27.6 |
10.5 |
5.3 |
4.3 |
|
|
|
|
|
|
|
|
Provision for Income Taxes |
7.0 |
9.3 |
5.7 |
0.7 |
1.2 |
|
Net Income After Taxes |
9.2 |
18.3 |
4.7 |
4.6 |
3.1 |
|
|
|
|
|
|
|
|
MinorityInterest |
-0.9 |
-1.7 |
-0.5 |
-0.4 |
-0.6 |
|
Net Income Before Extra. Items |
8.4 |
16.6 |
4.3 |
4.3 |
2.6 |
|
Net Income |
8.4 |
16.6 |
4.3 |
4.3 |
2.6 |
|
|
|
|
|
|
|
|
Adjustment |
0.0 |
-0.1 |
0.0 |
0.0 |
0.0 |
|
Income Available to Com Excl ExtraOrd |
8.3 |
16.6 |
4.2 |
4.2 |
2.6 |
|
|
|
|
|
|
|
|
Income Available to Com Incl ExtraOrd |
8.3 |
16.6 |
4.2 |
4.2 |
2.6 |
|
|
|
|
|
|
|
|
Basic Weighted Average Shares |
54.3 |
54.3 |
54.5 |
54.5 |
54.5 |
|
Basic EPS Excluding ExtraOrdinary Items |
0.15 |
0.31 |
0.08 |
0.08 |
0.05 |
|
Basic EPS Including ExtraOrdinary Item |
0.15 |
0.31 |
0.08 |
0.08 |
0.05 |
|
Dilution Adjustment |
0.0 |
0.0 |
0.0 |
0.0 |
0.0 |
|
Diluted Net Income |
8.3 |
16.6 |
4.2 |
4.2 |
2.6 |
|
Diluted Weighted Average Shares |
54.3 |
54.3 |
54.5 |
54.5 |
54.5 |
|
Diluted EPS Excluding ExtraOrd Items |
0.15 |
0.31 |
0.08 |
0.08 |
0.05 |
|
Diluted EPS Including ExtraOrd Items |
0.15 |
0.31 |
0.08 |
0.08 |
0.05 |
|
DPS-Common Stock |
0.00 |
0.09 |
0.00 |
0.06 |
0.00 |
|
Gross Dividends - Common Stock |
0.0 |
4.6 |
0.0 |
3.2 |
0.0 |
|
Normalized Income Before Taxes |
17.7 |
29.3 |
13.1 |
5.8 |
4.4 |
|
|
|
|
|
|
|
|
Inc Tax Ex Impact of Sp Items |
7.5 |
9.9 |
6.8 |
0.7 |
1.2 |
|
Normalized Income After Taxes |
10.2 |
19.4 |
6.4 |
5.1 |
3.2 |
|
|
|
|
|
|
|
|
Normalized Inc. Avail to Com. |
9.3 |
17.7 |
5.9 |
4.7 |
2.6 |
|
|
|
|
|
|
|
|
Basic Normalized EPS |
0.17 |
0.33 |
0.11 |
0.09 |
0.05 |
|
Diluted Normalized EPS |
0.17 |
0.33 |
0.11 |
0.09 |
0.05 |
|
Interest Expense |
0.3 |
0.3 |
0.3 |
0.3 |
0.2 |
|
Depreciation |
5.4 |
5.6 |
5.7 |
5.1 |
4.8 |
|
Amort of goodwill |
0.2 |
0.0 |
0.8 |
0.0 |
0.0 |
|
Amortization of negative goodwill |
0.0 |
- |
- |
- |
0.0 |
|
Reported Operating Profit |
13.1 |
31.8 |
10.7 |
5.2 |
2.8 |
|
Reported Ordinary Profit |
17.5 |
29.1 |
12.3 |
5.7 |
4.4 |
ANNUAL BALANCE
SHEET
AS REPORTED
|
Financials in:
USD (mil) |
|
|
Except for share
items (millions) and per share items (actual units) |
|
|
|
31-Mar-2011 |
31-Mar-2010 |
31-Mar-2009 |
31-Mar-2008 |
31-Mar-2007 |
|
UpdateType/Date |
Updated Normal |
Updated Normal |
Updated Normal |
Updated Normal |
Updated Normal |
|
Filed Currency |
JPY |
JPY |
JPY |
JPY |
JPY |
|
Exchange Rate |
82.88 |
93.44 |
98.77 |
99.535 |
118.075 |
|
Auditor |
Deloitte & Touche LLP |
Deloitte & Touche LLP |
Deloitte & Touche LLP |
Deloitte & Touche LLP |
Tohmatsu & Co. |
|
Auditor Opinion |
Unqualified |
Unqualified with Explanation |
Unqualified |
Unqualified |
Unqualified |
|
|
|
|
|
|
|
|
Cash & Deposits |
235.3 |
167.9 |
163.5 |
117.2 |
102.6 |
|
Note&Acct. Rcvl. |
293.2 |
243.8 |
306.4 |
369.9 |
296.9 |
|
Marketable Sec. |
87.1 |
78.6 |
53.5 |
79.1 |
42.4 |
|
Inventories |
- |
- |
- |
- |
96.0 |
|
Inventories - finished goods |
17.5 |
14.4 |
16.7 |
16.0 |
- |
|
Inventories - work-in-process |
48.3 |
61.3 |
76.0 |
79.8 |
- |
|
Inventories - raw materials & supplies |
28.9 |
28.1 |
30.5 |
27.2 |
- |
|
Deferred Tax |
16.6 |
12.5 |
12.1 |
14.5 |
12.3 |
|
Other Curr.Asset |
12.6 |
13.3 |
23.2 |
11.2 |
6.3 |
|
Allow.Doubt.Acct |
-2.6 |
-1.8 |
-1.6 |
-1.9 |
-1.6 |
|
Total Current Assets |
736.9 |
618.0 |
680.5 |
712.9 |
554.9 |
|
|
|
|
|
|
|
|
Bldg.&Structures |
210.2 |
191.2 |
163.7 |
168.4 |
135.6 |
|
Accum. depr - bldg&struc |
-127.6 |
-111.6 |
-101.2 |
-101.0 |
- |
|
Mach.&Vehicles |
222.7 |
200.6 |
188.0 |
194.8 |
162.0 |
|
Accum. depr - machin&vehicles |
-180.3 |
-157.6 |
-141.8 |
-151.9 |
- |
|
Land |
63.9 |
53.3 |
48.8 |
46.6 |
38.6 |
|
Lease assets, gross |
3.7 |
2.5 |
1.0 |
- |
- |
|
Accum. depr - lease assets |
-1.4 |
-0.7 |
-0.2 |
- |
- |
|
Contr.-in-Prog. |
16.8 |
2.0 |
5.4 |
1.6 |
1.2 |
|
Other PP&E |
41.2 |
38.1 |
34.9 |
37.3 |
30.3 |
|
Accum. depr - other PPE |
-34.9 |
-32.2 |
-28.9 |
-30.5 |
- |
|
Depreciation |
- |
- |
- |
- |
-230.7 |
|
Total intangible assets |
- |
11.8 |
8.6 |
5.4 |
- |
|
Goodwill |
0.6 |
- |
- |
- |
0.0 |
|
Lease assets |
1.8 |
- |
- |
- |
- |
|
Consolid.Adj. |
- |
- |
- |
- |
0.0 |
|
Other Intangible |
11.1 |
- |
- |
- |
5.7 |
|
Invest. Securit. |
200.0 |
185.8 |
148.4 |
211.3 |
233.6 |
|
LT Loan |
2.8 |
3.5 |
2.3 |
2.2 |
0.2 |
|
Time deposit over 1 year |
22.0 |
0.0 |
- |
- |
- |
|
Deferred Tax |
7.4 |
7.0 |
5.6 |
5.2 |
3.3 |
|
Other Assets |
11.4 |
25.4 |
27.4 |
28.7 |
24.2 |
|
Allow.Doubt.Acct |
-1.5 |
-0.7 |
-0.6 |
-1.0 |
-0.9 |
|
Adjustment |
-0.1 |
0.0 |
- |
0.0 |
0.0 |
|
Total Assets |
1,206.8 |
1,036.4 |
1,042.0 |
1,129.8 |
957.7 |
|
|
|
|
|
|
|
|
Note&Acct. Pybl. |
166.4 |
120.3 |
152.8 |
202.0 |
167.7 |
|
ST Debt |
26.4 |
26.5 |
29.3 |
26.0 |
33.4 |
|
LT borrowings (current) |
1.3 |
0.0 |
0.7 |
0.8 |
- |
|
Curr.Corp.Bond |
0.8 |
0.0 |
0.0 |
15.1 |
0.0 |
|
Lease liabilities (current) |
1.6 |
1.2 |
0.8 |
0.0 |
- |
|
Corp.Tax Pybls. |
10.1 |
3.2 |
5.9 |
20.0 |
19.8 |
|
Sales Tax Pybls. |
3.2 |
2.0 |
3.8 |
3.3 |
2.6 |
|
Advances received |
29.2 |
45.7 |
75.0 |
56.4 |
44.7 |
|
Allow.Bonus |
17.9 |
15.6 |
16.2 |
19.9 |
15.3 |
|
Allow. Dir's Bonus |
2.1 |
1.2 |
1.3 |
1.0 |
0.7 |
|
Allow.Plant Depos |
6.8 |
6.5 |
5.0 |
5.7 |
3.7 |
|
Allow.Project Received |
0.3 |
0.3 |
0.3 |
1.2 |
0.6 |
|
Reserve for removal of building costs |
- |
- |
- |
- |
0.0 |
|
Reserve for environmental safety |
- |
0.0 |
0.0 |
0.0 |
- |
|
Other Curr.Liab. |
34.0 |
23.4 |
29.2 |
33.6 |
30.9 |
|
Adjustment |
- |
- |
0.1 |
- |
- |
|
Total Current Liabilities |
300.2 |
245.9 |
320.1 |
384.9 |
319.3 |
|
|
|
|
|
|
|
|
Corp. Bond |
37.0 |
27.8 |
26.3 |
25.1 |
12.7 |
|
LT Debt |
14.2 |
0.3 |
3.6 |
4.3 |
1.1 |
|
Lease liabilities (non-current) |
2.5 |
2.9 |
2.5 |
0.0 |
- |
|
Total Long Term Debt |
53.7 |
31.0 |
32.5 |
29.4 |
13.8 |
|
|
|
|
|
|
|
|
Accrued Directors Severance Benefit |
- |
1.4 |
1.3 |
4.5 |
3.8 |
|
Deferred Tax |
21.3 |
15.9 |
5.4 |
17.8 |
36.5 |
|
Res.Accrd.Retir. |
32.4 |
29.5 |
28.6 |
21.3 |
16.4 |
|
Allow.Dir.Retir. |
1.9 |
1.6 |
1.8 |
1.5 |
1.3 |
|
Reserve for Environment Safety Prep. |
0.8 |
3.0 |
3.3 |
3.3 |
2.6 |
|
Asset retirement obligations |
1.4 |
0.0 |
- |
- |
- |
|
Other LT Liab. |
6.3 |
5.0 |
4.8 |
5.2 |
3.0 |
|
Minority Interest |
19.9 |
16.1 |
15.0 |
16.6 |
13.4 |
|
Total Liabilities |
437.8 |
349.3 |
412.7 |
484.6 |
410.2 |
|
|
|
|
|
|
|
|
Common Stock |
69.4 |
61.6 |
58.2 |
57.8 |
48.7 |
|
Paid-in-Capital |
75.6 |
66.9 |
63.3 |
62.8 |
52.9 |
|
RetainedEarnings |
644.8 |
553.0 |
524.6 |
494.9 |
381.0 |
|
TreasuryStock |
-15.7 |
-12.3 |
-11.5 |
-11.4 |
-8.6 |
|
UnrlzedGain-Sec. |
25.1 |
33.7 |
15.0 |
43.6 |
77.2 |
|
Deferred gains or losses on hedges |
0.0 |
0.0 |
- |
- |
- |
|
Translation Adj. |
-30.4 |
-15.8 |
-20.3 |
-2.4 |
-3.7 |
|
Total Equity |
768.9 |
687.0 |
629.3 |
645.3 |
547.6 |
|
|
|
|
|
|
|
|
Total Liabilities & Shareholders' Equity |
1,206.8 |
1,036.3 |
1,041.9 |
1,129.8 |
957.7 |
|
|
|
|
|
|
|
|
S/O-Common Stock |
54.3 |
54.5 |
54.5 |
54.5 |
54.6 |
|
Total Common Shares Outstanding |
54.3 |
54.5 |
54.5 |
54.5 |
54.6 |
|
T/S-Common Stock |
2.3 |
2.1 |
2.1 |
2.0 |
1.9 |
|
Deferred Revenue-Current |
29.2 |
45.7 |
75.0 |
56.4 |
44.7 |
|
Full-Time Employees |
3,521 |
3,484 |
3,621 |
3,473 |
3,343 |
|
Number of Common Shareholders |
5,017 |
5,631 |
5,924 |
4,788 |
4,422 |
|
LT Debts Maturing within 1yr. |
2.1 |
3.5 |
0.7 |
15.9 |
5.2 |
|
LT Debts Maturing within 2yr. |
33.0 |
0.2 |
3.3 |
0.6 |
13.3 |
|
LT Debts Maturing within 3yr. |
5.2 |
26.9 |
0.2 |
3.4 |
0.4 |
|
LT Debts Maturing within 4yr. |
5.2 |
1.1 |
25.4 |
0.2 |
0.1 |
|
LT Debts Maturing within 5yr. |
3.5 |
0.0 |
1.0 |
25.2 |
- |
|
Remaining |
4.3 |
0.0 |
0.0 |
0.0 |
0.0 |
|
Total Long Term Debt, Supplemental |
53.2 |
31.6 |
30.6 |
45.3 |
19.0 |
|
Lease Maturing within 1yr. |
1.6 |
1.2 |
0.8 |
- |
- |
|
Lease Maturing within 2yr. |
1.4 |
1.2 |
0.8 |
- |
- |
|
Lease Maturing within 3yr. |
0.8 |
1.0 |
0.8 |
- |
- |
|
Lease Maturing within 4yr. |
0.3 |
0.6 |
0.7 |
- |
- |
|
Lease Maturing within 5yr. |
0.1 |
0.1 |
0.3 |
- |
- |
|
Capital Leases - Remaining Maturities |
0.0 |
0.0 |
- |
- |
- |
|
Total Capital Leases |
4.1 |
4.1 |
3.3 |
- |
- |
|
Pension Obligation |
115.3 |
105.5 |
92.5 |
84.3 |
70.4 |
|
Fair Value of Plan Asset |
67.1 |
56.2 |
43.2 |
49.6 |
46.6 |
|
Funded Status |
-48.1 |
-49.3 |
-49.3 |
-34.7 |
-23.8 |
|
Total Funded Status |
-48.1 |
-49.3 |
-49.3 |
-34.7 |
-23.8 |
|
Discount Rate |
1.80% |
1.80% |
2.00% |
2.00% |
2.00% |
|
Expected Rate of Return |
2.00% |
2.00% |
2.00% |
2.00% |
2.00% |
|
Unrecognized Prior Service Costs |
2.8 |
2.9 |
3.1 |
3.5 |
3.3 |
|
Unrecognized Actuarial Gains and Losses |
13.0 |
16.9 |
17.6 |
9.9 |
4.2 |
|
Reserve for Accrued Retirement Benefits |
-32.4 |
-29.5 |
-28.6 |
-21.3 |
-16.4 |
|
Net Assets Recognized on Balance Sheet |
-16.6 |
-9.7 |
-7.9 |
-7.9 |
-8.9 |
INTERIM BALANCE
SHEET
AS REPORTED
|
Financials in:
USD (mil) |
|
|
Except for share
items (millions) and per share items (actual units) |
|
|
|
30-Jun-2011 |
31-Mar-2011 |
31-Dec-2010 |
30-Sep-2010 |
30-Jun-2010 |
|
UpdateType/Date |
Updated Normal |
Updated Normal |
Updated Normal |
Updated Normal |
Updated Normal |
|
Filed Currency |
JPY |
JPY |
JPY |
JPY |
JPY |
|
Exchange Rate |
80.76 |
82.88 |
81.105 |
83.54 |
88.49 |
|
|
|
|
|
|
|
|
Cash & deposits |
231.4 |
235.3 |
195.4 |
214.6 |
182.9 |
|
Accounts & notes receivable, gross |
321.3 |
293.2 |
286.5 |
250.2 |
250.2 |
|
Marketable securities |
78.2 |
87.1 |
91.9 |
88.5 |
82.7 |
|
Finished goods |
19.7 |
17.5 |
16.0 |
14.7 |
14.7 |
|
Inventories - work-in-process |
53.9 |
48.3 |
69.2 |
54.4 |
55.4 |
|
Inventories - raw materials & supplies |
34.2 |
28.9 |
32.2 |
30.2 |
30.6 |
|
Other |
29.6 |
29.2 |
33.3 |
27.9 |
25.9 |
|
Allowance for doubtful accounts |
-2.8 |
-2.6 |
-3.2 |
-2.3 |
-2.1 |
|
Total Current Assets |
765.4 |
736.9 |
721.3 |
678.2 |
640.3 |
|
|
|
|
|
|
|
|
Buildings & structures, net |
85.0 |
82.6 |
86.0 |
83.8 |
82.2 |
|
Machineries, equipment, &vehicles, net |
42.3 |
42.4 |
44.1 |
44.8 |
43.4 |
|
Land |
65.9 |
63.9 |
64.8 |
58.3 |
56.0 |
|
Other, prop., plants, & equip., net |
40.9 |
25.5 |
18.9 |
11.2 |
10.5 |
|
Goodwill |
0.6 |
0.6 |
0.6 |
0.6 |
0.6 |
|
Other intangible |
12.8 |
12.8 |
12.3 |
12.4 |
12.0 |
|
Long-term investment in securities |
201.8 |
200.0 |
203.8 |
186.2 |
179.0 |
|
Other |
45.4 |
43.7 |
44.3 |
43.5 |
42.8 |
|
Allowance for doubtful accounts |
-1.5 |
-1.5 |
-0.5 |
-0.5 |
-0.6 |
|
Adjustment |
0.0 |
0.0 |
- |
- |
- |
|
Total Assets |
1,258.6 |
1,206.8 |
1,195.4 |
1,118.6 |
1,066.2 |
|
|
|
|
|
|
|
|
Trade accounts & notes payable |
174.1 |
166.4 |
160.2 |
126.0 |
121.7 |
|
Short-term borrowings |
28.3 |
26.4 |
30.4 |
30.3 |
28.3 |
|
LT borrowings (current) |
- |
1.3 |
0.8 |
- |
- |
|
Straight bonds (current) |
1.6 |
0.8 |
- |
- |
- |
|
Lease liabilities (current) |
- |
1.6 |
- |
- |
- |
|
Income taxes payable |
4.2 |
10.1 |
4.5 |
3.2 |
3.6 |
|
Reserve for bonuses |
9.5 |
17.9 |
10.1 |
15.7 |
7.7 |
|
Reserve for director's bonuses |
0.6 |
2.1 |
0.8 |
0.5 |
0.3 |
|
Reserve for plant warranties |
6.7 |
6.8 |
7.0 |
6.4 |
6.8 |
|
Reserve for project received |
0.8 |
0.3 |
1.0 |
0.3 |
0.5 |
|
Res. environmental and safety measures |
- |
- |
- |
- |
0.5 |
|
Other |
90.4 |
66.5 |
85.5 |
80.8 |
77.7 |
|
Total Current Liabilities |
316.2 |
300.2 |
300.3 |
263.2 |
247.1 |
|
|
|
|
|
|
|
|
Straight bonds |
37.1 |
37.0 |
37.8 |
37.5 |
35.4 |
|
Long-term borrowings |
15.1 |
14.2 |
3.7 |
3.4 |
3.3 |
|
Lease liabilities (non-current) |
- |
2.5 |
- |
- |
- |
|
Total Long Term Debt |
52.2 |
53.7 |
41.5 |
40.9 |
38.7 |
|
|
|
|
|
|
|
|
Deferred tax liabilities (non-current) |
- |
21.3 |
- |
- |
- |
|
Reserve for accrued retirement benefit |
33.4 |
32.4 |
33.3 |
32.1 |
30.5 |
|
Reserve for officers' retirement |
2.0 |
1.9 |
1.8 |
1.8 |
1.6 |
|
Reserve for Environment Safety Prep. |
0.8 |
0.8 |
0.8 |
0.8 |
0.8 |
|
Asset retirement obligations |
1.4 |
1.4 |
1.4 |
1.4 |
- |
|
Other |
31.6 |
6.3 |
25.6 |
19.2 |
20.1 |
|
Minority interests |
21.5 |
19.9 |
19.3 |
18.5 |
17.8 |
|
Total Liabilities |
459.2 |
437.8 |
424.0 |
377.8 |
356.5 |
|
|
|
|
|
|
|
|
Common stock |
71.2 |
69.4 |
70.9 |
68.9 |
65.0 |
|
Capital surplus |
77.6 |
75.6 |
77.1 |
74.8 |
70.6 |
|
Retained earnings |
665.5 |
644.8 |
642.1 |
622.5 |
583.5 |
|
Treasury stocks |
-16.2 |
-15.7 |
-16.6 |
-13.8 |
-13.0 |
|
Reserve by val. of investment sec. |
25.2 |
25.1 |
26.1 |
16.6 |
21.4 |
|
Deferred gains or losses on hedges |
0.0 |
0.0 |
- |
- |
- |
|
Cumulative translation adjustments |
-24.1 |
-30.4 |
-28.3 |
-28.2 |
-17.8 |
|
Total Equity |
799.3 |
768.9 |
771.3 |
740.7 |
709.7 |
|
|
|
|
|
|
|
|
Total Liabilities & Shareholders' Equity |
1,258.6 |
1,206.8 |
1,195.4 |
1,118.6 |
1,066.2 |
|
|
|
|
|
|
|
|
S/O-Common Stock |
54.3 |
54.3 |
54.2 |
54.5 |
54.5 |
|
Total Common Shares Outstanding |
54.3 |
54.3 |
54.2 |
54.5 |
54.5 |
|
T/S-Common Stock |
2.3 |
2.3 |
2.3 |
2.1 |
2.1 |
|
Full-Time Employees |
- |
3,521 |
3,500 |
3,473 |
3,490 |
ANNUAL CASH FLOWS
AS REPORTED
|
Financials in:
USD (mil) |
|
|
Except for share
items (millions) and per share items (actual units) |
|
|
|
31-Mar-2011 |
31-Mar-2010 |
31-Mar-2009 |
31-Mar-2008 |
31-Mar-2007 |
|
Period Length |
12 Months |
12 Months |
12 Months |
12 Months |
12 Months |
|
UpdateType/Date |
Updated Normal |
Updated Normal |
Updated Normal |
Updated Normal |
Updated Normal |
|
Filed Currency |
JPY |
JPY |
JPY |
JPY |
JPY |
|
Exchange Rate (Period Average) |
85.691434 |
92.941082 |
100.484331 |
114.302336 |
116.944303 |
|
Auditor |
Deloitte & Touche LLP |
Deloitte & Touche LLP |
Deloitte & Touche LLP |
Deloitte & Touche LLP |
Tohmatsu & Co. |
|
Auditor Opinion |
Unqualified |
Unqualified with Explanation |
Unqualified |
Unqualified |
Unqualified |
|
|
|
|
|
|
|
|
Net Income bf. Tax |
46.4 |
16.5 |
57.6 |
77.3 |
81.6 |
|
Depreciation |
21.1 |
20.9 |
20.5 |
17.6 |
13.9 |
|
Loss Impairment Assets |
0.2 |
0.2 |
1.2 |
4.5 |
0.0 |
|
Amort. Goodwill |
0.8 |
0.0 |
0.0 |
0.0 |
0.2 |
|
Loss (gain) on change in equity |
-0.1 |
0.0 |
- |
- |
- |
|
Allow. Bonus |
0.3 |
-1.5 |
-3.8 |
1.6 |
1.4 |
|
Allow. Dir's Bonus |
0.9 |
-0.4 |
0.3 |
0.2 |
0.7 |
|
Reserve for contruct losses |
0.0 |
-0.1 |
-0.6 |
0.4 |
-0.5 |
|
Reserve for plant warrant |
0.5 |
1.2 |
0.0 |
- |
- |
|
Reserve for removal of building |
- |
- |
- |
0.0 |
-0.6 |
|
Allow.Doubt.Acct. |
1.1 |
0.0 |
-0.2 |
-0.1 |
-1.0 |
|
Res.Accrd.Retir. |
-0.5 |
-0.8 |
7.0 |
1.7 |
-1.4 |
|
Allow.Dir.Retir.Bon. |
0.1 |
-0.3 |
0.2 |
0.0 |
-2.9 |
|
Accrued Directors'' retire |
-0.8 |
0.0 |
- |
- |
- |
|
Accrued Directors Severance Benefit |
- |
0.0 |
-3.1 |
-0.1 |
-0.2 |
|
Reserve for Environment Safety |
-1.2 |
-0.5 |
-0.1 |
0.2 |
-0.4 |
|
Inter.&Div. Income |
-5.0 |
-3.3 |
-6.1 |
-5.0 |
-3.9 |
|
Interest Expense |
1.1 |
1.2 |
1.5 |
1.4 |
1.4 |
|
Exchange Gain/Loss |
0.2 |
0.0 |
-0.2 |
0.0 |
0.0 |
|
Inv.Income-Equity |
-1.8 |
-2.0 |
-1.9 |
-2.0 |
-3.3 |
|
Sale/Disp/Val.PP&E |
0.1 |
0.7 |
0.9 |
-0.5 |
-2.1 |
|
Sale/Val. Inv. Sec. |
6.3 |
1.9 |
18.8 |
1.6 |
-3.0 |
|
G/L on sale of affiliated securities |
- |
0.0 |
0.3 |
0.0 |
- |
|
Sales G/L-Memberships |
- |
- |
0.0 |
0.0 |
-0.1 |
|
Val. Loss-Memberships |
0.1 |
0.5 |
0.0 |
0.1 |
0.1 |
|
Acct. Receivables |
-16.9 |
83.4 |
54.8 |
-15.0 |
-20.6 |
|
Inventories |
18.8 |
29.2 |
-8.0 |
-6.5 |
-11.7 |
|
Acct. Payables |
32.3 |
-42.4 |
-40.1 |
0.0 |
8.4 |
|
Sales Tax Payables |
1.0 |
-2.2 |
0.8 |
0.0 |
0.3 |
|
(Inc) Dec sales tax receivables |
3.1 |
0.0 |
- |
- |
- |
|
Dir. Bonus |
- |
- |
0.0 |
0.0 |
-0.4 |
|
Dir.Bonus-Minor.Int. |
- |
- |
0.0 |
0.0 |
0.0 |
|
Advances received |
-16.8 |
-36.0 |
24.1 |
1.2 |
11.5 |
|
Other |
7.7 |
-0.3 |
-8.5 |
-4.0 |
1.1 |
|
Inter.&Div. Received |
5.4 |
3.6 |
6.2 |
5.5 |
4.1 |
|
Interest Paid |
-1.1 |
-1.2 |
-1.4 |
-1.3 |
-1.4 |
|
Tax Paid |
-7.4 |
-12.2 |
-38.0 |
-35.8 |
-20.6 |
|
Income taxes refund, cash basis |
1.5 |
7.3 |
0.0 |
- |
- |
|
Adjustment |
- |
0.0 |
0.0 |
0.0 |
- |
|
Cash from Operating Activities |
97.4 |
63.3 |
82.3 |
43.0 |
50.7 |
|
|
|
|
|
|
|
|
Time Deposit Made |
-35.6 |
-16.9 |
-23.5 |
-0.3 |
-2.8 |
|
Time Deposit Matured |
19.2 |
12.8 |
24.6 |
2.2 |
0.0 |
|
Purch.Marktb.Sec. |
-1.2 |
0.0 |
0.0 |
0.0 |
0.0 |
|
Sale Marktb.Sec. |
1.5 |
1.8 |
1.3 |
4.4 |
5.1 |
|
Capital Expenditures |
-30.1 |
-26.6 |
-35.5 |
-20.9 |
-29.5 |
|
Sale PP&E |
0.5 |
0.9 |
3.6 |
2.0 |
4.6 |
|
Purch. Inv. Sec. |
-15.0 |
-8.1 |
-14.1 |
-17.8 |
-20.3 |
|
Sale Inv. Sec. |
3.2 |
4.5 |
10.4 |
11.3 |
10.7 |
|
Purch.Subsid.Stock |
- |
- |
- |
- |
0.0 |
|
Purchase of Treasury Stock of Subsidiary |
- |
- |
- |
- |
0.0 |
|
Loan Made |
-0.1 |
-1.5 |
0.0 |
-2.3 |
0.0 |
|
Loan Collected |
0.5 |
0.1 |
0.3 |
0.6 |
0.5 |
|
Purch.Subsid.Stock-conso. |
-5.3 |
0.0 |
- |
- |
- |
|
Proceeds from liquidation of subsidiarie |
0.2 |
0.0 |
- |
- |
- |
|
Purch. Intangible |
-2.8 |
-4.1 |
-2.6 |
-0.5 |
-0.5 |
|
Purchase of businesses |
- |
0.0 |
-1.5 |
0.0 |
- |
|
Sale Other Inv.Asset |
1.0 |
0.1 |
0.1 |
-0.1 |
1.1 |
|
Cash from Investing Activities |
-63.9 |
-36.9 |
-37.0 |
-21.4 |
-31.1 |
|
|
|
|
|
|
|
|
ST Debt, Net |
1.2 |
-8.9 |
5.9 |
-6.4 |
-7.2 |
|
Repayment of finance lease |
-1.3 |
-1.0 |
-0.4 |
0.0 |
- |
|
LT Debt Proceed |
14.8 |
0.0 |
0.0 |
3.5 |
0.1 |
|
LT Debt Paid |
-4.0 |
-0.7 |
-0.8 |
-5.6 |
-1.2 |
|
Bond Issued |
6.0 |
0.0 |
1.0 |
21.9 |
0.0 |
|
Bond Redeemed |
- |
0.0 |
-14.9 |
0.0 |
-17.1 |
|
Proceeds from stock issuance to minority |
0.0 |
0.3 |
0.0 |
- |
- |
|
Purchase of treasury stock of subsidiari |
0.0 |
0.0 |
- |
- |
- |
|
Sale-Treasury Stock |
0.7 |
0.0 |
- |
0.0 |
1.0 |
|
Purch.Treasury Stock |
-2.9 |
-0.1 |
0.0 |
-1.1 |
-1.7 |
|
Dividend Paid |
-6.3 |
-7.6 |
-8.1 |
-6.4 |
-5.6 |
|
Dividend Paid MI |
-0.8 |
-0.8 |
-1.0 |
-0.7 |
-0.5 |
|
Cash from Financing Activities |
7.4 |
-18.8 |
-18.5 |
5.1 |
-32.1 |
|
|
|
|
|
|
|
|
Foreign Exchange Effects |
-8.3 |
2.4 |
-7.5 |
1.4 |
2.0 |
|
Net Change in Cash |
32.6 |
10.0 |
19.2 |
28.0 |
-10.5 |
|
|
|
|
|
|
|
|
Net Cash - Beginning Balance |
254.2 |
224.3 |
188.3 |
137.5 |
144.9 |
|
Net Cash - Ending Balance |
286.8 |
234.4 |
207.5 |
165.5 |
134.4 |
|
Cash Interest Paid |
1.1 |
1.2 |
1.4 |
1.3 |
1.4 |
|
Cash Taxes Paid |
5.9 |
4.9 |
38.0 |
35.8 |
20.6 |
INTERIM CASH FLOWS
AS REPORTED
|
Financials in:
USD (mil) |
|
|
Except for share
items (millions) and per share items (actual units) |
|
|
|
31-Mar-2011 |
31-Dec-2010 |
30-Sep-2010 |
30-Jun-2010 |
31-Mar-2010 |
|
Period Length |
12 Months |
9 Months |
6 Months |
3 Months |
12 Months |
|
UpdateType/Date |
Updated Normal |
Updated Normal |
Updated Normal |
Updated Normal |
Updated Normal |
|
Filed Currency |
JPY |
JPY |
JPY |
JPY |
JPY |
|
Exchange Rate (Period Average) |
85.691434 |
86.812446 |
88.962162 |
92.080323 |
92.941082 |
|
|
|
|
|
|
|
|
Net Income bf. Tax |
46.4 |
19.8 |
9.6 |
4.3 |
16.5 |
|
Depreciation |
21.1 |
15.5 |
9.9 |
4.8 |
20.9 |
|
Loss Impairment Assets |
0.2 |
- |
- |
- |
0.2 |
|
Amortization of goodwill |
0.8 |
0.8 |
0.0 |
0.0 |
0.0 |
|
Loss (gain) on change in equity |
-0.1 |
-0.1 |
- |
- |
0.0 |
|
Gain of Negative Goodwill |
- |
- |
-0.1 |
- |
- |
|
Allow. Bonus |
0.3 |
-7.3 |
-1.6 |
-8.5 |
-1.5 |
|
Allow. Director's Bonus |
0.9 |
-0.3 |
-0.6 |
-0.9 |
-0.4 |
|
Reserve for contract losses |
0.0 |
0.7 |
0.0 |
0.2 |
-0.1 |
|
Reserve for plant warrant |
0.5 |
- |
- |
- |
1.2 |
|
Allow.Doubt.Acct. |
1.1 |
0.6 |
0.1 |
0.1 |
0.0 |
|
Res.Accrd.Retir. |
-0.5 |
-0.4 |
-0.5 |
-0.5 |
-0.8 |
|
Allow.Dir.Retir.Bon. |
0.1 |
0.0 |
0.0 |
0.0 |
-0.3 |
|
Accrued Directors'' retire |
-0.8 |
- |
- |
- |
0.0 |
|
Accrued Directors Severance Benefit |
- |
-0.8 |
-0.8 |
-0.7 |
0.0 |
|
Reserve for Environment Safety |
-1.2 |
-1.2 |
-1.1 |
-0.6 |
-0.5 |
|
Inter.&Div. Income |
-5.0 |
-4.0 |
-2.3 |
-1.5 |
-3.3 |
|
Interest Expense |
1.1 |
0.8 |
0.5 |
0.2 |
1.2 |
|
Exchange Gain/Loss |
0.2 |
0.2 |
- |
- |
0.0 |
|
Equity Gain/Loss |
-1.8 |
-1.2 |
-0.8 |
-0.6 |
-2.0 |
|
Sale/Disp/Val.PP&E |
0.1 |
0.0 |
0.0 |
-0.1 |
0.7 |
|
Sale/Val. Inv. Sec. |
6.3 |
2.2 |
0.5 |
0.1 |
1.9 |
|
G on sale of membership |
- |
- |
0.1 |
- |
- |
|
G/L on sale of affiliated securities |
- |
- |
- |
- |
0.0 |
|
Loss on valuation of membership |
0.1 |
0.1 |
0.1 |
- |
0.5 |
|
Acct. Receivables |
-16.9 |
-3.8 |
18.1 |
6.6 |
83.4 |
|
Inventories |
18.8 |
0.4 |
11.3 |
8.0 |
29.2 |
|
Acct. Payables |
32.3 |
21.4 |
-3.6 |
-4.2 |
-42.4 |
|
Sales Tax Payables |
1.0 |
0.9 |
2.0 |
1.5 |
-2.2 |
|
(Inc) Dec sales tax receivables |
3.1 |
3.6 |
3.6 |
3.4 |
0.0 |
|
Advances Received |
-16.8 |
-5.4 |
-6.7 |
-6.8 |
-36.0 |
|
Other |
7.7 |
5.4 |
7.1 |
7.1 |
-0.3 |
|
Inter.&Div. Received |
5.4 |
4.6 |
2.7 |
1.8 |
3.6 |
|
Interest Paid |
-1.1 |
-0.9 |
-0.5 |
-0.3 |
-1.2 |
|
Tax Paid |
-7.4 |
-5.6 |
-3.8 |
-2.3 |
-12.2 |
|
Income taxes refund |
1.5 |
1.4 |
1.4 |
0.1 |
7.3 |
|
Adjustment |
- |
- |
- |
- |
0.0 |
|
Cash from Operating Activities |
97.4 |
47.4 |
44.7 |
11.3 |
63.3 |
|
|
|
|
|
|
|
|
Time Deposit Made |
-35.6 |
-25.4 |
-13.4 |
-6.2 |
-16.9 |
|
Time Deposit Matured |
19.2 |
11.5 |
7.8 |
1.0 |
12.8 |
|
Purchase of short-term investment securi |
-1.2 |
-1.2 |
-1.1 |
0.0 |
0.0 |
|
Sales and redemption of sec. |
1.5 |
0.3 |
0.0 |
0.0 |
1.8 |
|
Capital Expenditures |
-30.1 |
-18.4 |
-5.1 |
-1.6 |
-26.6 |
|
Sale PP&E |
0.5 |
0.3 |
0.2 |
0.1 |
0.9 |
|
Purch. Inv. Sec. |
-15.0 |
-11.3 |
-7.4 |
-3.3 |
-8.1 |
|
Sale/Redemption of Inv. Sec. |
3.2 |
2.0 |
0.8 |
0.8 |
4.5 |
|
Loan Made |
-0.1 |
-0.1 |
0.0 |
0.0 |
-1.5 |
|
Loan Collected |
0.5 |
0.4 |
0.4 |
0.2 |
0.1 |
|
Purch.Subsid.Stock-conso. |
-5.3 |
-5.3 |
- |
- |
0.0 |
|
Liquidation of Affiliated |
0.2 |
0.2 |
0.2 |
- |
0.0 |
|
Purch. Intangible |
-2.8 |
-1.3 |
-1.1 |
-0.5 |
-4.1 |
|
Purchase of businesses |
- |
- |
- |
- |
0.0 |
|
Other investment activities |
1.0 |
1.3 |
1.4 |
0.2 |
0.1 |
|
Cash from Investing Activities |
-63.9 |
-47.0 |
-17.4 |
-9.4 |
-36.9 |
|
|
|
|
|
|
|
|
ST Debt, Net |
1.2 |
-0.3 |
0.5 |
0.2 |
-8.9 |
|
Repayments of finance lease obligations |
-1.3 |
-0.9 |
-0.6 |
-0.3 |
-1.0 |
|
LT Debt Proceed |
14.8 |
4.0 |
3.6 |
3.3 |
0.0 |
|
LT Debt Paid |
-4.0 |
-0.3 |
-0.2 |
-0.2 |
-0.7 |
|
Bond Issued |
6.0 |
5.9 |
5.8 |
5.6 |
0.0 |
|
Bond redemption |
- |
- |
- |
- |
0.0 |
|
Proceeds from stock issuance to minority |
0.0 |
- |
- |
- |
0.3 |
|
Treasury Stock of Affiliated Purchased |
0.0 |
0.0 |
0.0 |
- |
0.0 |
|
Sale-Treasury Stock |
0.7 |
- |
- |
- |
0.0 |
|
Purch.Treasury Stock |
-2.9 |
-2.9 |
0.0 |
0.0 |
-0.1 |
|
Dividend Paid |
-6.3 |
-6.2 |
-3.0 |
-2.9 |
-7.6 |
|
Dividend Paid MI |
-0.8 |
0.0 |
0.0 |
0.0 |
-0.8 |
|
Cash from Financing Activities |
7.4 |
-0.7 |
5.9 |
5.6 |
-18.8 |
|
|
|
|
|
|
|
|
Foreign Exchange Effects |
-8.3 |
-6.2 |
-7.8 |
-1.9 |
2.4 |
|
Net Change in Cash |
32.6 |
-6.4 |
25.3 |
5.7 |
10.0 |
|
|
|
|
|
|
|
|
Net Cash - Beginning Balance |
254.2 |
250.9 |
244.8 |
236.5 |
224.3 |
|
Net Cash - Ending Balance |
286.8 |
244.5 |
270.2 |
242.2 |
234.4 |
|
Cash Interest Paid |
1.1 |
0.9 |
0.5 |
0.3 |
1.2 |
|
Cash Taxes Paid |
5.9 |
4.2 |
2.4 |
2.2 |
4.9 |
Geographic Segments
Financials in: As Reported (mil)
|
|||||||||||||||||||||||||||||||||||||||||||||||||||||||||||||||||||||||||||||||||||||||||||||||||||||||||||||||||||||||||||||||||||||||||||||||||||||||||||||||||||||||||||||||||||||||||||||||||||||||||||||||||||||||||||||||||||||||||||||||||||||||||||||||||||||||||||||||||||||||||||||||||||||||||||||||||||||||||||||||||||||||||||||||||||||||||||||||||||||||||||||||||||||||||||||||||||||||||||||||||||||||||||||||||||||||||||||||||||||||||||||||||||||||||||||||||||||||||||||||||||||||||||||||||||||||||||||||||||||||||||||||||||||||||||||||||||||||||||||||||||||||||||||||||||||||||||||||||||||||||||||||||||||||||||||||||||||||||||||||||||||||||||||||||||||||||||||||||||||||||||||||||||||||||||||||||||||||||||||||||||||||||||||||||||||||||||||||||||||||||||||||||||||||||||||||||||||||||||||||||||||||||||||||||||||||||||||||||||||||||||||||||||||||||||||||||||||||||||||||||||||||||||||||||||||||||||||||||||||||||||||||||||||||||||||||||||||||||||||||||||||||||||||||||||||||||||||||||||||||
GEOGRAPHIC
SEGMENTS
Financials in: As Reported (mil)
|
||||||||||||||||||||||||||||||||||||||||||||||||||||||||||||||||||||||||||||||||||||||||||||||||||||||||||||||||||||||||||||||||||||||||||||||||||||||||||||||||||||||||||||||||||||||||||||||||||||||||||||||||||||||||||||||||||||||||||||||||||||||||||||||||||||||||||||||||||||||||||||||||||||||||||||||||||||||||||||||||||||||||||||||||||||||||||||||||||||||||||||||||||||||||||||||||||||||||||||||||||||||||||||||||||||||||||||||||||||||||||||||||||||||||||||||||||||||||||||||||||||||||||||||||||||||||||||||||||||||||||||||||||||||||||||||||||||||||||||||||||||||||||||||||||||||||||||||||||||||||||||||||||||||||||||||||||||||||||||||||||||||||||||||||||||||||||||||||||||||||||||||||||||||||||||||||||||||||||||||||||||||||||||||||||||||||||||||||||
BUSINESS SEGMENTS
Financials in: As Reported (mil)
|
|||||||||||||||||||||||||||||||||||||||||||||||||||||||||||||||||||||||||||||||||||||||||||||||||||||||||||||||||||||||||||||||||||||||||||||||||||||||||||||||||||||||||||||||||||||||||||||||||||||||||||||||||||||||||||||||||||||||||||||||||||||||||||||||||||||||||||||||||||||||||||||||||||||||||||||||||||||||||||||||||||||||||||||||||||||||||||||||||||||||||||||||||||||||||||||||||||||||||||||||||||||||||||||||||||||||||||||||||||||||||||||||||||||||||||||||||||||||||||||||||||||||||||||||||||||||||||||||||||||||||||||||||||||||||||||||||||||||||||||||||||||||||||||||||||||||||||||||||||||||||||||||||||||||||||||||||||||||||||||||||||||||||||||||||||||||||||||||||||||||||||||||||||||||||||||||||||||||||||||||||||||||||||||||||||||||||||||||||||||||||||||||||||||||||||||||||||||||||||||||||||||||||||||||||||||||||||||||||||||||||||||||||||||||||||||||||||||||||||||||||||||||||||||||||||||||||||||||||||||||||||||||||||||||||||||||||||||||||||||||||||||||||||||||||||||||||||||||||||||||
BUSINESS SEGMENTS
Financials in: As Reported (mil)
|
|||||||||||||||||||||||||||||||||||||||||||||||||||||||||||||||||||||||||||||||||||||||||||||||||||||||||||||||||||||||||||||||||||||||||||||||||||||||||||||||||||||||||||||||||||||||||||||||||||||||||||||||||||||||||||||||||||||||||||||||||||||||||||||||||||||||||||||||||||||||||||||||||||||||||||||||||||||||||||||||||||||||||||||||||||||||||||||||||||||||||||||||||||||||||||||||||||||||||||||||||||||||||||||||||||||||||||||||||||||||||||||||||||||||||||||||||||||||||||||||||||||||||||||||||||||||||||||||||||||||||||||||||||||||||||||||||||||||||||||||||||||||||||||||||||||||||||||||||||||||||||||||||||||||||||||||||||||||||||||||||||||||||||||||||||||||||||||||||||||||||||||||||||||||||||||||||||||||||||||||||||||||||||||||||||||||||||||||||||||||||||||||||||||||||||||||||||||||||||||||||||||||||||||||||||||||||||||||||||||||||||||||||||||||||||||||||||||||||||||||||||||||||||||||||||||||||||||||||||||||||
FOREIGN EXCHANGE RATES
|
Currency |
Unit
|
Indian Rupees |
|
US Dollar |
1 |
Rs.53.40 |
|
|
1 |
Rs.83.32 |
|
Euro |
1 |
Rs.70.44 |
RATING EXPLANATIONS
|
RATING |
STATUS |
PROPOSED CREDIT LINE |
|
|
>86 |
Aaa |
Possesses an extremely sound financial base with the strongest capability
for timely payment of interest and principal sums |
Unlimited |
|
71-85 |
Aa |
Possesses adequate working capital. No caution needed for credit
transaction. It has above average (strong) capability for payment of interest
and principal sums |
Large |
|
56-70 |
A |
Financial & operational base are regarded healthy. General
unfavourable factors will not cause fatal effect. Satisfactory capability for
payment of interest and principal sums |
Fairly Large |
|
41-55 |
Ba |
Overall operation is considered normal. Capable to meet normal
commitments. |
Satisfactory |
|
26-40 |
B |
Capability to overcome financial difficulties seems comparatively
below average. |
Small |
|
11-25 |
Ca |
Adverse factors are apparent. Repayment of interest and principal sums
in default or expected to be in default upon maturity |
Limited with
full security |
|
<10 |
C |
Absolute credit risk exists. Caution needed to be exercised |
Credit not
recommended |
|
-- |
NB |
New Business |
-- |
This score serves as a reference to assess SC’s credit risk
and to set the amount of credit to be extended. It is calculated from a composite
of weighted scores obtained from each of the major sections of this report. The
assessed factors and their relative weights (as indicated through %) are as
follows:
Financial
condition (40%) Ownership
background (20%) Payment
record (10%)
Credit history
(10%) Market trend
(10%) Operational
size (10%)
This report is issued at your request without any
risk and responsibility on the part of MIRA INFORM PRIVATE LIMITED (MIPL)
or its officials.