![]()
MIRA INFORM REPORT
|
Report Date : |
14.12.2011 |
IDENTIFICATION DETAILS
|
Name : |
WE COMPONENTS PTE. LTD. |
|
|
|
|
Formerly Known As : |
PLEXUS COMPONENTS PTE LTD Eff. |
|
|
|
|
Registered Office : |
10 Ubi Crescent #03-94/95 Ubi Techpark
Singapore 408564 |
|
|
|
|
Country : |
Singapore |
|
|
|
|
Financials (as on) : |
31.12.2010 |
|
|
|
|
Date of Incorporation : |
31.10.1997 |
|
|
|
|
Com. Reg. No.: |
199707469R |
|
|
|
|
Legal Form : |
Limited Private Company |
|
|
|
|
Line of Business : |
General Wholesale Trade |
|
|
|
|
No. of Employees
: |
Not Available |
RATING & COMMENTS
|
MIRA’s Rating : |
B |
|
RATING |
STATUS |
PROPOSED CREDIT LINE |
|
|
26-40 |
B |
Capability to overcome financial difficulties seems comparatively
below average. |
Small |
|
Maximum Credit Limit : |
S$394,000 |
|
|
|
|
Status : |
Moderate |
|
|
|
|
Payment
Behaviour : |
No Complaints |
|
|
|
|
Litigation : |
Clear |
NOTES :
Any query related to this report can be made
on e-mail : infodept@mirainform.com
while quoting report number, name and date.
ECGC Country Risk Classification List – September 30th, 2011
|
Country Name |
Previous Rating (30.06.2011) |
Current Rating (30.09.2011) |
|
Singapore |
a1 |
a1 |
|
Risk Category |
ECGC
Classification |
|
Insignificant |
A1 |
|
Low |
A2 |
|
Moderate |
B1 |
|
High |
B2 |
|
Very High |
C1 |
|
Restricted |
C2 |
|
Off-credit |
D |
Executive
Summary
|
: |
WE COMPONENTS PTE. LTD. |
|
|
Registration No |
: |
199707469R |
|
Date of Registration |
: |
31/10/1997 |
|
Former Name |
: |
PLEXUS COMPONENTS PTE LTD
Eff. date : 31/10/1997 Eff. date : 31/10/1997 |
|
Date of Change of Name |
: |
29/03/2011 |
|
Type of Company |
: |
LIMITED PRIVATE COMPANY |
|
Registered Address |
: |
10 UBI CRESCENT #03-94/95
UBI TECHPARK SINGAPORE 408564 |
|
Date of Change of Address |
: |
19/07/2004 |
|
Contact No. |
: |
6311 2900 |
|
Fax No. |
: |
6311 2933 |
|
Website |
: |
|
|
Registered Activities |
: |
1. GENERAL WHOLESALE
TRADE (INCLUDING GENERAL IMPORTERS AND EXPORTERS) 2. WHOLESALE ON A FEE OR
CONTRACT BASIS (EG COMMISSION AGENTS) |
|
Issued Ordinary Capital* |
: |
$9,450,000.00 SINGAPORE,
DOLLARS ,NO. OF SHARE : 9,276,797 |
|
Issued Preference Capital |
: |
NA |
|
Paid-Up Ordinary Capital |
: |
$9,450,000.00 SINGAPORE, DOLLARS |
|
Paid-Up Preference
Capital |
: |
NA |
|
* Number of Shares
includes number of Issued Treasury Shares |
||
|
Issued Treasury Capital |
: |
NA |
|
Paid-Up Treasury Capital |
: |
NA |
|
No. of Local Subsidiaries |
: |
1 |
|
No. of Local Associates |
: |
NA |
|
Auditor |
: |
RSM CHIO LIM LLP |
|
Bankers / Financiers |
: |
DBS BANK LTD. UNITED OVERSEAS BANK
LIMITED STANDARD CHARTERED BANK |
|
Turnover |
: |
SINGAPORE, DOLLARS
87,838,579.00 (FY2010) |
|
Net Worth |
: |
SINGAPORE, DOLLARS
7,887,288.00 (FY2010) |
|
No. of Bank Charges |
: |
6 |
|
No. of Litigation Suits |
: |
NA |
|
S1000 / SME 500 / FG50
Ranking |
: |
|
|
Compounded Annual Growth
Rate (CAGR) |
: |
19.74% (6
years) |
Credit Recommendation
|
Recommended Credit Line |
: |
S$394,000 |
SHAREHOLDER DETAILS
|
: |
WE HOLDINGS LTD. |
|
|
SHAREHOLDER ID |
: |
198600445D |
|
NATIONALITY |
: |
SINGAPORE |
|
ADDRESS |
: |
10 UBI CRESCENT #03-95 UBI TECHPARK SINGAPORE 408564 |
|
NO. OF ORD SHARES |
: |
9,276,797 |
|
% OF SHAREHOLDING |
: |
100% |
|
CURRENCY |
: |
SINGAPORE, DOLLARS |
OFFICER DETAILS
|
: |
NG
BOO GAN |
|
|
ADDRESS |
: |
24
SIN MING WALK #01-01 BISHAN PARK CONDOMINIUM SINGAPORE 575572 |
|
POSITION |
: |
DIRECTOR |
|
DATE OF APPT |
: |
02/03/1998 |
|
NATIONALITY |
: |
SINGAPORE
CITIZEN |
|
I/C PASSPORT |
: |
S6804415D |
|
|
||
|
NAME |
: |
SIM
MONG KEANG |
|
ADDRESS |
: |
220
DUCHESS AVENUE CASABELLA SINGAPORE 266337 |
|
POSITION |
: |
DIRECTOR |
|
DATE OF APPT |
: |
31/10/1997 |
|
NATIONALITY |
: |
SINGAPORE
CITIZEN |
|
I/C PASSPORT |
: |
S6928302J |
|
|
||
|
NAME |
: |
LOH
ENG LOCK KELVIN |
|
ADDRESS |
: |
84
KEW DRIVE KEW GROVE SINGAPORE 467991 |
|
POSITION |
: |
DIRECTOR |
|
DATE OF APPT |
: |
06/05/2011 |
|
NATIONALITY |
: |
SINGAPORE
CITIZEN |
|
I/C PASSPORT |
: |
S7421147Z |
KEY PERSONNEL PROFILE
|
SIM MONG KEANG |
|
|
NRIC Number: |
S6928302J |
|
Available Address: |
220 DUCHESS AVENUE
CASABELLA SINGAPORE 266337 |
Current Business Interest
|
No. |
Name |
Position |
Appt Date |
#of Share |
% |
|
MAXIMUS FORTUNE PTE. LTD. |
DIRECTOR |
11/11/2009 |
1 |
50.00 |
|
|
2 |
W SOLUTIONS PTE. LTD. |
DIRECTOR |
02/09/2011 |
95000 |
95.00 |
|
3 |
WE COMPONENTS PTE. LTD. |
DIRECTOR |
31/10/1997 |
- |
- |
|
4 |
WE HOLDINGS LTD. |
DIRECTOR |
02/06/2010 |
- |
- |
|
5 |
WE MICROELECTRONICS PTE. LTD. |
DIRECTOR |
29/06/2002 |
- |
- |
|
6 |
WE SYSTEMS PTE. LTD. |
DIRECTOR |
02/06/2010 |
- |
- |
Previous Business
|
No. |
Name |
Status |
Position |
Appt Date |
Last Known
Inactive Date |
|
ACX SOLUTIONS PTE. LTD. |
LIVE COMPANY |
DIRECTOR/SHR |
16/09/2004 |
01/11/2010 |
|
|
2 |
CE DISTRIBUTION CENTRE (ASIA)
PTE. LTD. |
LIVE COMPANY |
DIRECTOR/SHR |
13/07/2005 |
10/11/2010 |
|
3 |
CHILISIN CORPORATION (ASIA)
PTE. LTD. |
STRUCK OFF |
DIRECTOR |
06/09/2005 |
- |
|
4 |
CORE LINK RESOURCES PTE. LTD. |
LIVE COMPANY |
DIRECTOR/SHR |
12/07/2006 |
27/07/2010 |
|
5 |
J ONE GLOBAL SOLUTION (S) PTE.
LTD. |
STRUCK OFF |
DIRECTOR/SHR |
03/04/2004 |
15/07/2010 |
|
6 |
NUSTAR PRIVATE LIMITED |
LIVE COMPANY |
DIRECTOR/SHR |
13/07/2005 |
27/09/2011 |
|
7 |
PLEXUS COMPONENTS |
TERMINATION |
OWNER |
14/10/1997 |
- |
|
8 |
PLEXUS ELECTRONICS PTE. LTD. |
LIVE COMPANY |
DIRECTOR/SHR |
08/08/2007 |
23/12/2010 |
|
9 |
SALIENT CONSULTING PTE LTD |
STRUCK OFF |
DIRECTOR |
16/12/1999 |
- |
|
10 |
SEED SYSTEM PTE. LTD. |
LIVE COMPANY |
DIRECTOR/SHR |
14/08/2002 |
18/11/2011 |
|
11 |
TATLY PLEXUS TECHNOLOGY PTE
LTD |
LIVE COMPANY |
DIRECTOR/SHR |
17/11/2001 |
14/10/2011 |
|
12 |
THAT AQUARIUM |
LIVE |
OWNER |
28/05/2002 |
01/01/2006 |
|
13 |
WE COMPONENTS PTE. LTD. |
LIVE COMPANY |
SHAREHOLDER |
- |
22/10/2011 |
|
14 |
WE MICROELECTRONICS PTE. LTD. |
LIVE COMPANY |
SHAREHOLDER |
- |
06/10/2011 |
Bankruptcy Record
|
Case
No. |
Year |
Date
of Filing |
Petitioner
Name |
Amount |
|
|
|
|
|
Litigation Search – Writ of Summons
|
Court |
Case No. |
Year |
Date
of Filing |
Amount |
Cause
Category |
|
|
|
|
|
|
SUBSIDIARIES AND ASSOCIATE
COMPANIES
|
Company |
Shareholdings (%) |
|
|
|
|
100 |
|
BANKERS/
FINANCIERS
Subject
enjoys a normal banking routine with its bankers. To date, there have been 6 bank
charges registered against Subject by its bankers. The charge numbers are:
|
Charge
No. |
: |
C200811123 |
|
|
|
Date of Registration |
: |
17/12/2008 |
|
|
Chargee |
: |
DBS BANK LTD. |
|
|
Amount Secured and
Currency |
: |
All Monies |
|
|
Address |
: |
6 SHENTON WAY, DBS BUILDING TOWER ONE SINGAPORE 068809 |
|
|
|||
|
2) |
Charge No. |
: |
C200805199 |
|
|
Date of Registration |
: |
09/06/2008 |
|
|
Chargee |
: |
UNITED OVERSEAS BANK LIMITED |
|
|
Amount Secured and
Currency |
: |
All Monies |
|
|
Address |
: |
80 RAFFLES PLACE UOB PLAZA SINGAPORE 048624 |
|
|
|||
|
3) |
Charge No. |
: |
C200805110 |
|
|
Date of Registration |
: |
05/06/2008 |
|
|
Chargee |
: |
DBS BANK LTD. |
|
|
Amount Secured and
Currency |
: |
All Monies |
|
|
Address |
: |
6 SHENTON WAY, DBS BUILDING TOWER ONE SINGAPORE 068809 |
|
|
|||
|
4) |
Charge No. |
: |
C200800980 |
|
|
Date of Registration |
: |
22/01/2008 |
|
|
Chargee |
: |
UNITED OVERSEAS BANK LIMITED |
|
|
Amount Secured and
Currency |
: |
All Monies |
|
|
Address |
: |
80 RAFFLES PLACE UOB PLAZA SINGAPORE 048624 |
|
|
|||
|
5) |
Charge No. |
: |
C200402652 |
|
|
Date of Registration |
: |
03/06/2004 |
|
|
Chargee |
: |
STANDARD CHARTERED BANK |
|
|
Amount Secured and
Currency |
: |
All Monies |
|
|
Address |
: |
6 BATTERY ROAD SINGAPORE 049909 |
|
|
|||
|
6) |
Charge No. |
: |
C200305916 |
|
|
Date of Registration |
: |
09/12/2003 |
|
|
Chargee |
: |
UNITED OVERSEAS BANK LIMITED |
|
|
Amount Secured and
Currency |
: |
All Monies |
|
|
Address |
: |
80 RAFFLES
PLACE UOB PLAZA SINGAPORE 048624 |
LITIGATION
Clear
COMPLIANCE RECORDS
|
Date of Last AGM |
: |
|
|
Date of Last AR |
: |
27/07/2011 |
|
Date of A/C Laid At Last AGM |
: |
31/12/2010 |
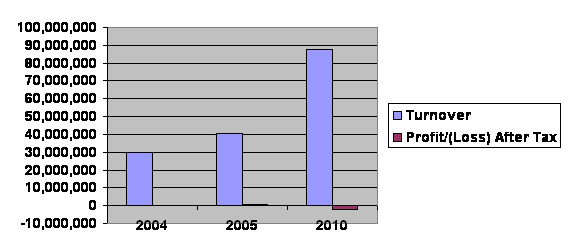
FINANCIAL HIGHLIGHTS
|
Financial Figures |
|||
|
|
DEC 2010 |
DEC 2005 |
DEC 2004 |
|
Currency |
SINGAPORE,
DOLLARS |
SGD - SIN |
SINGAPORE,
DOLLARS |
|
Profit and Loss Key Figures |
|
|
|
|
87,838,579 |
40,774,316 |
29,796,116 |
|
|
Profit/(Loss) Before Tax |
(1,877,387) |
654,243 |
55,280 |
|
Profit After Tax attributable to
Shareholders |
(2,067,344) |
418,901 |
(22,120) |
|
|
|
|
|
|
Balance Sheet Key Figures |
|
|
|
|
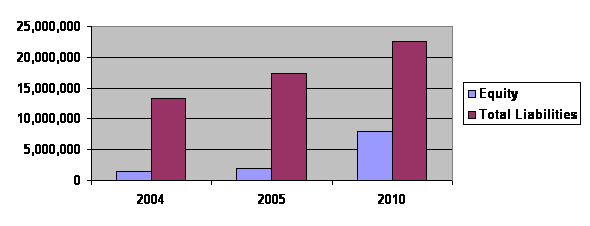
Total Assets |
30,388,685 |
19,205,698 |
14,850,044 |
|
Current Assets |
27,167,118 |
17,845,828 |
13,207,516 |
|
Non Current Assets |
3,221,567 |
1,359,870 |
1,642,528 |
|
|
|
|
|
|
Total Liabilities |
22,501,397 |
17,325,486 |
13,362,747 |
|
Current Liabilities |
22,501,397 |
16,638,058 |
12,386,119 |
|
Non Current Liabilities |
0 |
687,428 |
976,628 |
|
|
|
|
|
|
Shareholders' Funds |
7,887,288 |
1,880,212 |
1,487,297 |
|
Share Capital |
9,450,000 |
200,000 |
200,000 |
|
Total Reserves |
(1,562,712) |
1,680,212 |
1,287,297 |
|
|
|
|
|
FINANCIAL RATIOS
|
|
|||
|
|
DEC
2010 |
DEC
2005 |
DEC
2004 |
|
Growth % |
|
|
|
|
NA |
NA |
NA |
|
|
|
|
|
|
|
Profitability |
|
|
|
|
Profit Margin (%) |
NA |
1.03 |
NA |
|
Return on Equity (%) |
NA |
22.28 |
NA |
|
Return on Assets (%) |
NA |
2.18 |
NA |
|
|
|
|
|
|
Leverage |
|
|
|
|
Total Debt/Equity (Times) |
2.85 |
9.21 |
8.98 |
|
Current Debt/Equity (Times) |
2.85 |
8.85 |
8.33 |
|
Long Term Debt To Equity (Times) |
NA |
0.37 |
0.66 |
|
Total Asset To Total Equity (Times) |
3.85 |
10.21 |
9.98 |
|
|
|
|
|
|
Asset Management |
|
|
|
|
Total Assets Turnover (Times) |
2.89 |
2.12 |
2.01 |
|
Fixed Assets Turnover (Times) |
27.27 |
29.98 |
18.14 |
|
|
|
|
|
|
Liquidity |
|
|
|
|
Current Ratio (Times) |
1.21 |
1.07 |
1.07 |
|
|
|
|
|
FINANCIAL
HIGHLIGHTS
|
Financial Figures |
|||
|
|
DEC 2010 |
DEC 2005 |
DEC 2004 |
|
Currency |
SINGAPORE,
DOLLARS |
SINGAPORE,
DOLLARS |
|
|
Profit and Loss Key Figures |
|
|
|
|
* |
0 |
0 |
|
|
Profit/(Loss) Before Tax |
* |
0 |
0 |
|
Profit After Tax attributable to
Shareholders |
* |
0 |
0 |
|
|
|
|
|
|
Balance Sheet Key Figures |
|
|
|
|
Total Assets |
25,574,553 |
18,118,831 |
14,400,151 |
|
Current Assets |
22,098,457 |
16,643,603 |
12,698,880 |
|
Non Current Assets |
3,476,096 |
1,475,228 |
1,701,271 |
|
|
|
|
|
|
Total Liabilities |
16,944,279 |
15,377,169 |
12,423,380 |
|
Current Liabilities |
16,944,279 |
14,697,472 |
11,464,411 |
|
Non Current Liabilities |
0 |
679,697 |
958,969 |
|
|
|
|
|
|
Shareholders' Funds |
8,630,274 |
2,741,662 |
1,976,771 |
|
Share Capital |
9,450,000 |
200,000 |
200,000 |
|
Total Reserves |
(819,726) |
2,541,662 |
1,776,771 |
|
|
|
|
|
* As per Companies Act, section 201 Accounts, Consolidated
accounts and directors report, sub-section 3A.
FINANCIAL RATIOS
|
|
|||
|
|
DEC
2010 |
DEC
2005 |
DEC
2004 |
|
Growth % |
|
|
|
|
NA |
NA |
NA |
|
|
|
|
|
|
|
Profitability |
|
|
|
|
Profit Margin (%) |
0.00 |
0.00 |
0.00 |
|
Return on Equity (%) |
0.00 |
0.00 |
0.00 |
|
Return on Assets (%) |
0.00 |
0.00 |
0.00 |
|
|
|
|
|
|
Leverage |
|
|
|
|
Total Debt/Equity (Times) |
1.96 |
5.61 |
6.28 |
|
Current Debt/Equity (Times) |
1.96 |
5.36 |
5.80 |
|
Long Term Debt To Equity (Times) |
0.00 |
0.25 |
0.49 |
|
Total Asset To Total Equity (Times) |
2.96 |
6.61 |
7.28 |
|
|
|
|
|
|
Asset Management |
|
|
|
|
Total Assets Turnover (Times) |
0.00 |
0.00 |
0.00 |
|
Fixed Assets Turnover (Times) |
0.00 |
0.00 |
0.00 |
|
|
|
|
|
|
Liquidity |
|
|
|
|
Current Ratio (Times) |
1.30 |
1.13 |
1.11 |
|
|
|
|
|
FINANCIAL
COMMENTARY
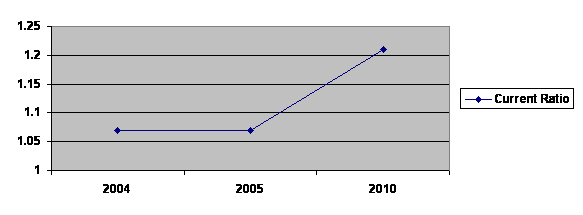
Compound Annual Growth Rate
The company's CAGR is 19.74% (6 years).
CAGR is the year-over-year growth rate of a company over a specified
period. Instead of looking at the average growth rate, CAGR allow users to look
at the annualized growth rate of a company over a given period, a more
indicative measure of growth of a company’s performance over a given period.
Profitability
We are unable to comment on
Subject's profitability.
Liquidity
Current ratio stood at 1.21 times in FY10.
This means that the group has SINGAPORE, DOLLARS 1.21 of current assets for
every SINGAPORE, DOLLARS of current liability incurred.
A minimum figure of 1.0 would be considered the lowest limit that this
figure should reach. Any business that has a current ratio near 1.0 may be
heading for liquidity problems, and would need to be closely monitored. A
figure greater than 2.0 would be more desirable, to act as a buffer against any
short-term liquidity problems, and give creditors/bank managers a degree of
comfort when granting credit/finance.
Leverage
Total debt-to-equity ratio
notched 2.85 times in FY10. This means that the group requires additional
external financing of SINGAPORE, DOLLARS 2.85 for every SINGAPORE, DOLLARS
injected into its operations.
Generally, a total debt-to-equity ratio of less than 0.5
times is preferred. The ratio measures the proportion of the company's reliance
on external debt for financing, relative to the shareholder's fund. A lower
ratio would imply a greater financial safety and operating freedom for the
company.
Efficiency Ratio
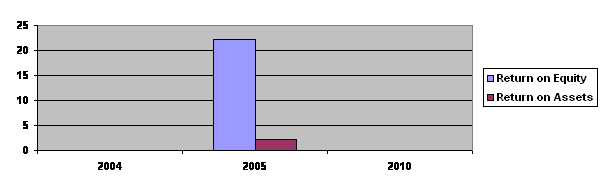
We are unable to comment on Subject's return on equity.
We are unable to comment on Subject's return on assets.
Total assets turnover ratio logged at 2.89 times in FY10. This ratio
measures the group's ability to make productive use of its total assets to
generate sales which reflects the efficiency of the management in utilising its
resources.
FOREIGN EXCHANGE RATES
|
Currency |
Unit
|
Indian Rupees |
|
US Dollar |
1 |
Rs.53.40 |
|
UK Pound |
1 |
Rs.83.32 |
|
Euro |
1 |
Rs.70.44 |
RATING EXPLANATIONS
|
RATING |
STATUS |
PROPOSED CREDIT LINE |
|
|
>86 |
Aaa |
Possesses an extremely sound financial base with the strongest
capability for timely payment of interest and principal sums |
Unlimited |
|
71-85 |
Aa |
Possesses adequate working capital. No caution needed for credit
transaction. It has above average (strong) capability for payment of interest
and principal sums |
Large |
|
56-70 |
A |
Financial & operational base are regarded healthy. General
unfavourable factors will not cause fatal effect. Satisfactory capability for
payment of interest and principal sums |
Fairly Large |
|
41-55 |
Ba |
Overall operation is considered normal. Capable to meet normal
commitments. |
Satisfactory |
|
26-40 |
B |
Capability to overcome financial difficulties seems comparatively
below average. |
Small |
|
11-25 |
Ca |
Adverse factors are apparent. Repayment of interest and principal sums
in default or expected to be in default upon maturity |
Limited with
full security |
|
<10 |
C |
Absolute credit risk exists. Caution needed to be exercised |
Credit not
recommended |
|
---- |
NB |
New Business |
---- |
This score serves as a reference to assess SC’s credit risk
and to set the amount of credit to be extended. It is calculated from a composite
of weighted scores obtained from each of the major sections of this report. The
assessed factors and their relative weights (as indicated through %) are as
follows:
Financial
condition (40%) Ownership
background (20%) Payment
record (10%)
Credit history
(10%) Market trend
(10%) Operational
size (10%)
This report is issued at your request without any
risk and responsibility on the part of MIRA INFORM PRIVATE LIMITED (MIPL)
or its officials.