![]()
MIRA INFORM REPORT
|
Report Date : |
29.12.2011 |
IDENTIFICATION DETAILS
|
Name : |
SIEMENS AG |
|
|
|
|
Registered Office : |
Wittelsbacherplatz 2, Munich, 80333 |
|
|
|
|
Country : |
Germany |
|
|
|
|
Financials (as on) : |
30.09.2010 |
|
|
|
|
Year of Establishment : |
1847 |
|
|
|
|
Com. Reg. No.: |
6684 |
|
|
|
|
Legal Form : |
Public Parent Company |
|
|
|
|
Line of Business : |
Subject is engaged in electronics and electrical engineering |
|
|
|
|
No. of Employees
: |
405,000 |
RATING & COMMENTS
|
MIRA’s Rating : |
Aa |
|
RATING |
STATUS |
PROPOSED CREDIT LINE |
|
|
71-85 |
Aa |
Possesses adequate working capital. No caution needed for credit
transaction. It has above average (strong) capability for payment of interest
and principal sums |
Large |
|
Status : |
Excellent |
|
Payment
Behaviour : |
Regular |
|
Litigation : |
Clear |
NOTES :
Any query related to this report can be made
on e-mail : infodept@mirainform.com
while quoting report number, name and date.
ECGC Country Risk Classification List – September 30th, 2011
|
Country Name |
Previous Rating (30.06.2011) |
Current Rating (30.09.2011) |
|
Germany |
a1 |
a1 |
|
Risk Category |
ECGC
Classification |
|
Insignificant |
A1 |
|
Low |
A2 |
|
Moderate |
B1 |
|
High |
B2 |
|
Very High |
C1 |
|
Restricted |
C2 |
|
Off-credit |
D |
Company name & address
Siemens AG
Wittelsbacherplatz 2
Munich, 80333
Germany
Tel: 49-89-63600
Fax: 49-89-63652000
Synthesis
|
Employees: |
405,000 |
||||
|
Company Type: |
Public Parent |
||||
|
Corporate Family: |
1507 Companies |
||||
|
Traded: |
|
||||
|
Incorporation Date: |
1847 |
||||
|
Auditor: |
Ernst & Young LLP |
|
Fiscal Year End: |
30-Sep-2011 |
|
Reporting Currency: |
Euro |
|
Annual Sales: |
102,421.7 1 |
|
Net Income: |
8,561.3 |
|
Total Assets: |
139,862.8 2 |
|
Market Value: |
90,451.7 |
|
|
(09-Dec-2011) |
Business Description
|
Siemens AG is engaged in electronics and electrical engineering. The
Company is an integrated technology company with activities in the fields of
industry, energy and healthcare. Siemens operates in six segments: Industry,
Energy, Healthcare, Equity Investments, Siemens IT Solutions and Services and
Siemens Financial Services (SFS). Industry, Energy and Healthcare are
reported along with 14 divisions, which comprise the divisions, Industry
Automation, Drive Technologies, Building Technologies, OSRAM, Industry
Solutions and Mobility, belonging to the Industry Sector, the Divisions,
Fossil Power Generation, Renewable Energy, Oil and Gas, Power Transmission
and Power Distribution, belonging to the Energy Sector and the Divisions,
Imaging and Information Technology (IT), Workflow and Solutions and
Diagnostics, belonging to the Healthcare Sector. In November 2009, Siemens
acquired a controlling interest of 100 % in Solel Solar Systems Ltd., Beit
Shemesh/Israel (Solel). For the fiscal year ended 30 September 2011, Siemens
AG's total revenue increased 7% to EUR73.52B. Net profit from continuing
operations increased 67% to EUR6.84B. Total revenue reflects an increase in
demand for the Company's products especially in the Industry and Energy
business divisions. Net profit from continuing operations benefited from
lower interest expenses, as well as higher result in affiliated companies. |
Industry
|
Industry |
Scientific and Technical Instruments |
|
ANZSIC 2006: |
2419 - Other Professional and Scientific
Equipment Manufacturing |
|
NACE 2002: |
3320 - Manufacture of instruments and
appliances for measuring, checking, testing, navigating and other purposes,
except industrial process control equipment |
|
NAICS 2002: |
334515 - Instrument Manufacturing for
Measuring and Testing Electricity and Electrical Signals |
|
UK SIC 2003: |
3320 - Manufacture of instruments and
appliances for measuring, checking, testing, navigating and other purposes,
except industrial process control equipment |
|
US SIC 1987: |
3825 - Instruments for Measuring and
Testing of Electricity and Electrical Signals |
Key Executive
|
Name |
Title |
|
Peter Loescher |
President of the Managing Board, Chief Executive Officer |
|
Raj Batra |
President of Industry Automation Division—USA |
|
Eduard Kaeser |
Chief Financial Officer |
|
Tom Kopanski |
Senior Vice President, Sales—USA |
|
Lothar Adler |
Member of the Supervisory Board, Employee Representative |
Significant
Developments
|
* number of significant developments within the last 12 months
News
|
Title |
Date |
|
Notice of AGM |
28-Dec-2011 |
|
Indian markets make somber start amid
weakness in Asian peers |
28-Dec-2011 |
|
US Patent Issued to Siemens Energy on Dec.
20 for "Turbine Airfoil Cooling System with Divergent Film Cooling
Hole" (Florida Inventor) |
28-Dec-2011 |
|
WIPO PUBLISHES PATENT OF SIEMENS
CONCENTRATED SOLAR POWER, SIEMENS AKTIENGESELLSCHAFT FOR "SOLAR
COLLECTOR ASSEMBLY WITH AT LEAST ONE CLINCHING... |
28-Dec-2011 |
|
WIPO PUBLISHES PATENT OF SIEMENS
CONCENTRATED SOLAR POWER, SIEMENS AKTIENGESELLSCHAFT FOR "SOLAR
COLLECTOR ASSEMBLY WITH PARABOLIC REFLECTOR AND... |
28-Dec-2011 |
|
Financial Summary |
|
|
|
Stock Snapshot |
|
|
Registered No.(DEU):
6684
1 - Profit &
Loss Item Exchange Rate: USD 1 = EUR 0.717768
2 - Balance Sheet Item Exchange Rate:
USD 1 = EUR 0.7453231
|
|||||||||||||||||||||||||||||||||||||||||||||||||||||||||||||||||||||||||||||||||||||||||||||||||||||||||||||||||||||||||||||||||||||||||||||||||||||||||||||||||||||||||||||||||||||||||||||||||||||||||||||||||||||||||||||||||||||||||||||||||||||||||||||||||||||||||||||||||||||||||||||||||||||||||||||||||||||||||||||||||||||||||||||||||||||||||||||||||||||||||||||||||||||||||||||||||||||||||||||||||||||||||||||||||||||||||||||||||||||||||||||||||||||||||||||||||||||||||||||||||||||||||||||||||||||||||||||||||||||||||||||||||||||||||||||||||||||||||||||||||||||||||||||||||||||||||||||||||||||||||||||||||||||||||||||||||||||||||||||||||||||||||||||||||||||||||||||||||||||||||||||||||||||||||||||||||||||||||||||||||||||||||||||||||||||||||||||||||||||||||||||||||||||||||||||||||||||||||||||||||||||||||||||||||||||||||||||||||||||||||||||||||||||||||||||||||||||||||||||||||||||||||||||||||||||||||||||||||||||||||||||||||||||||||||||||||||||||||||||||||||||||||||||||||||||||||||||||||||||||
The company acquired 30 percent stake in Archimede Solar, Italy, which is engaged in manufacturing solar thermal systems, making it a full-range provider to the solar thermal power industry. In the past few years, the company acquired various companies, including UGS Corp. and Dade Behring. Through the acquisition of UGS Corp., Siemens bridged the gap between virtual product and production planning, and real-life manufacturing. The company’s intelligent factory concept links these two different processes. The integration of these two processes reduced manufacturing errors, slashed production ramp-up time and cut time-to-market by 40%.
The company’s intelligent factory concept links these two different processes. The integration of these two processes reduced manufacturing errors, slashed production ramp-up time and cut time-to-market by 40%. The acquisition of Dade Behring, a leading US in vitro diagnostics company, made Siemens the world’s only integrated diagnostic company. The UGS acquisition brings the product-life cycle management software and the Dade Behring acquisition can help the company in providing integrated healthcare diagnostic solutions. To strengthen its position in the expanding solar thermal power market, Siemens acquired Solel Solar Systems, a solar thermal power technology company.
Under the agreement, Siemens will fund and further develop the ‘oxyfuel’ turbines over the next five years. Clean Energy Systems has proven that the TriGen technology on a small scale over that past 15 years. Now, in collaboration with Maersk Oil, Siemens and the U.S. Department of Energy, it is testing TriGen on a commercial scale power plant in California. David Henson, head of the Conceptual Engineering and Services business segment of Siemens Energy, said, “We at Siemens are very pleased to work with Maersk Oil on the development of this promising technology.” Henson said, “The new turbine, named SXT-150, is backed by our vast experience in turbine development. Siemens’ turbine work is focused on providing the materials capable of withstanding high pressures and temperatures, handling the corrosive environment resulting from the CO2 and steam mixture, and implementing changes to increase power.
In Prenzlau, Vattenfall is seeking new solutions for the future. The project consists of a biogas unit, three wind turbines of 2 MW each, two combined heat and power plants and an electrolysis unit that generates the hydrogen. Together with its partners, Vattenfall is now planning to expand its pilot activities for generating hydrogen to store wind energy in several major projects, including one in the state of Brandenburg. The project brings together energy supplier Enertrag AG, French oil and gas company Total SA and Siemens AG, as well as research institutions and environmental organizations. The initiative is supported by several German states and the German Ministry of Transport and is known as the Performing Energy Alliance for Hydrogen from Wind.Dec 07, 2011South Africa Awards 238 MW Of Wind And Solar Contracts To Mainstream Renewable Power Consortium. The Mainstream Renewable Power Ltd.
However, corruption charges leveled against it and declining operating efficiency are a few areas of concern. Nonetheless, the company’s expansion in growth markets together with rising demand for renewable energy and favorable government initiatives could provide growth opportunities. However, international fraud, coupled with the company’s dependence on third party suppliers and global economic slowdown, could affect the company’s operations adversely.Growth strategy through AcquisitionsSiemens employs a strategy of acquiring companies and adding them to its business portfolio to strengthen its market position. In 2010, the company acquired Tesla Power & Automation, eHouse manufacturing division of Integrated Electrical Services, Inc located in Texas. This newly acquired business provides custom packaging of electrical equipment and drive systems into custom manufactured enclosures called eHouses.
In addition, the North American Electric Reliability Council (NERC) and Federal Energy Regulatory Commission (FERC) plan to modernize the electricity transmission system of the US to adapt to renewable resource development. Such stimulus programs for renewable energy would significantly increase the demand for wind and solar products and benefit the players in the sector, including Siemens. The Chinese government plans to double its wind installed capacity, which is one-third of the world's total new installed capacity in 2009. This would help China meet its 2020 target of 30,000 MW, ten years ahead of its renewable plan. The company, with the appropriate mix of tax policy, government procurement along with transmission grid development, interconnection standards, and other forms of public sector support, could significantly benefit from the program.Growing IVD MarketSiemens Healthcare, the subsidiary of Siemens AG, is a global supplier in the diagnostic field.
To strengthen its position in the expanding solar thermal power market, Siemens acquired Solel Solar Systems, a solar thermal power technology company. These strategic acquisitions will bring in new capabilities and improve the market position of Siemens globally.Extensive Research and Development EffortWith the company operating in technology intensive businesses, innovation is considered the top priority, since it creates a competitive advantage. Innovation continues to be the cornerstone of the company’s business strategy with its strong research and development (R&D) efforts that focus on improving its offerings. In 2009, Siemens spent €3,846m on its research and development activities, which accounted for 5.1% of the total revenue. The Industry Sector invested €1,700m with an R&D intensity of 4.9%; the Energy Sector €800 billion with an R&D intensity of 3.1%; and the Healthcare Sector €1,100m with an R&D intensity of 9.0%.
|
|
Helpful |
Harmful |
|
Internal Origin |
Strengths ·
Extensive Research and Development Effort |
Weaknesses |
|
External Origin |
Opportunities ·
Expansion into Growth markets |
Threats ·
Stringent Regulatory Environment |
Overview
Siemens AG is a world leader in electronics and engineering. It provides
numerous products and solutions to industrial, energy, healthcare, and consumer
products sectors. The company’s dominant market position, combined with
extensive research and development activities, provides it a competitive
advantage. However, corruption charges leveled against it and declining
operating efficiency are a few areas of concern. Nonetheless, the company’s
expansion in growth markets together with rising demand for renewable energy
and favorable government initiatives could provide growth opportunities.
However, international fraud, coupled with the company’s dependence on third
party suppliers and global economic slowdown, could affect the company’s
operations adversely.
Strengths
Extensive
Research and Development Effort
With the company operating in technology intensive businesses,
innovation is considered the top priority, since it creates a competitive
advantage. Innovation continues to be the cornerstone of the company’s business
strategy with its strong research and development (R&D) efforts that focus
on improving its offerings. In 2009, Siemens spent €3,846m on its research and
development activities, which accounted for 5.1% of the total revenue. The
Industry Sector invested €1,700m with an R&D intensity of 4.9%; the Energy
Sector €800 billion with an R&D intensity of 3.1%; and the Healthcare
Sector €1,100m with an R&D intensity of 9.0%. As of September 2010, the
company held about 58,000 patents, and on an average employed 30,100 people.
The company’s 178 research and development facilities are located in over 30
countries. The company’s patent position in 2010 was third in Germany, second
in Europe and 13th in the US. Strong research and development efforts will
allow the company to innovate and attract industry attention, which creates an edge
over its competitors.
Growth Strategy through Acquisitions
Siemens employs a strategy of acquiring companies and adding them to its
business portfolio to strengthen its market position. In 2010, the company
acquired Tesla Power & Automation, eHouse manufacturing division of
Integrated Electrical Services, Inc located in Texas. This newly acquired
business provides custom packaging of electrical equipment and drive systems
into custom manufactured enclosures called eHouses. The company also acquired
IRIS Telecom in Turkey through its joint venture with Nokia Oyj. The company
acquired 30 percent stake in Archimede Solar, Italy, which is engaged in
manufacturing solar thermal systems, making it a full-range provider to the
solar thermal power industry. In the past few years, the company acquired
various companies, including UGS Corp. and Dade Behring. Through the
acquisition of UGS Corp., Siemens bridged the gap between virtual product and
production planning, and real-life manufacturing. The company’s intelligent
factory concept links these two different processes. The integration of these
two processes reduced manufacturing errors, slashed production ramp-up time and
cut time-to-market by 40%. The acquisition of Dade Behring, a leading US in
vitro diagnostics company, made Siemens the world’s only integrated diagnostic
company. The UGS acquisition brings the product-life cycle management software
and the Dade Behring acquisition can help the company in providing integrated
healthcare diagnostic solutions. To strengthen its position in the expanding
solar thermal power market, Siemens acquired Solel Solar Systems, a solar
thermal power technology company. These strategic acquisitions will bring in
new capabilities and improve the market position of Siemens globally.
Leading Market Position
A leading position in its existing and emerging businesses helped
Siemens achieve successful expansion of its portfolio. The company generates
about two-thirds of its revenue from businesses that are No. 1 or No. 2 in
their markets. Siemens is the market leader in the energy and environmental
care, automation and control, industrial and public infrastructure, and
healthcare sectors. The company ranks first as an application service provider,
processing an average of 170 million transactions daily. Every second computed
tomography scanner used in German clinics is from Siemens; about 75% of the
automobiles made in Germany are built in factories equipped with Siemens
automation technology and more than half of the power plants connected to
Germany‘s power grid use turbines and generators from Siemens. In Brazil, the
company’s growth is four times faster than that of the national GDP with all
its businesses ranked as No. 1 or No. 2 in the market. Overall, the company’s
holds No.2 market position in fossil power generation, No.2 position in oil and
gas and industrial applications, No. 1 position in instrumentation and
controls, and No.5 position in wind power and No.1 in off-shore wind power
sectors. With the market witnessing the emergence of an increasing number of
companies across the industry, the company’s leading market position provides a
competitive advantage. Additionally, a leading market position complements the
company’s industrial portfolio and helps in securing new contracts.
Weaknesses
Declining revenue coupled with decreasing profit margins indicates
operational inefficiency of the company. The company’s revenue declined over
the past two years. For the fiscal year ended 2010, the company reported
revenue of €75,978m, reflecting a decrease of 0.8 % over €76,651m in 2009; and
a decrease of 0.9% over €77,327m in 2008. The company’s operating income also
decreased 6.8% from €6,347m in 2009 to €5,916m in 2010. The company’s operating
expense was €1,611m compared to €632m in 2009. The operating margin also
decreased from 8.3% in 2009 to 7.8% in 2010 and inventory turnover decreased
from 3.96 in 2009 to 3.63 in 2010. The company’s sales growth also reported a
decline in the fiscal year ended 2010. The company's operational inefficiency
in 2010 could be due to its weak competitive positioning. The company's
underperformance, if not revived, will affect its growth adversely.
Involvement in Litigations
Involvement in illegal acts or corruption may lead to contracts being
cancelled and also limit the company’s ability to participate in business with
governments or non-governmental organizations and result in declining orders,
which would have a material adverse effect on its business. Siemens is facing allegations
of corruption, criminal breach of fiduciary duty including fraud, as well as
bribery, money laundering and tax evasion. It is reported that Siemens was
involved in a number of incidents of corruption in about 11 of its business
units. In 2007, a court in Munich fined Siemens €201m for the alleged bribery
of public officials in Libya, Russia, and Nigeria in return for the awarding
contracts. As a result, the Nigerian government canceled a contract due to the
bribery findings. It was reported that the company spent around €1.3 billion
during 1999 through 2006 on dubious payments. Additionally, in June 2009, it
was reported that Siemens spent approximately €57.5m illegally in Greece to win
a contract for the former state-owned telephone operator, OTE. Greek officials
are also investigating alleged corruption in deals between Siemens and the
state, involving security systems for the 2004 Athens Olympics. The company
paid around €96m, €510m and €347m in 2009, 2008 and 2007 respectively, to
outside advisors engaged in connection with investigations into alleged
violations of anti-corruption laws and related matters as well as remediation
activities. The company also paid a huge amount in 2010, which substantially
increased its operating expense from €632m in 2009 to €1,611m in 2010, thus
reducing its profit margin.
Opportunities
Siemens could capture growing opportunities in the healthcare industry.
Healthcare costs in industrial nations are estimated to account for more than
10% of GDP. The increasing population of people aged above 65, who consume more
medical solutions than younger people and are more prone to chronic diseases,
holds significant market potential for the company. Demographic change is one
of the major trends in today’s world, which is intensifying the demand for
healthcare further. The United Nations Population Division estimated that the
number of people over the age of 60 throughout the world will triple to nearly
2 billion by 2050. Globally, the population of older persons is growing at a
rate of 2.6% annually. According to the United Nations Population Division,
people aged 60 are projected to account for 22% of the total world population
by 2050, up from 11% in 2009. In developed economies such as the US, the UK,
France, Germany and Japan, the percentage of the 65 and older population is in
double digits and is expected to grow for the next seven years. While developed
countries have managed to slow down their overall population growth, their
citizens’ longevity will cause problems in the future. Such a situation will
increase the healthcare costs in those countries. The pace of aging population
is faster in developing countries than in developed countries. Due to the large
volume of the overall population in countries such as China and India, the
number of people getting older is quite high. In 2009, the number of persons
aged above 60 increased three and a half times to 737 million. There were 12
countries with more than 10 million people each aged above 60, including China,
160 million; India, 89 million; the US, 56 million; Japan 38 million; the
Russian Federation 25 million; and Germany, 21 million. By 2050, 32 countries
are expected to have over 10 million people each aged above 60, including five
countries with more than 50 million older people: China, 440 million; India,
316 million; the US, 111 million, Indonesia, 72 million; and Brazil, 64
million. Such elderly population is expected to exert increasing pressure on
the healthcare system, thus creating demand for the company’s offerings.
Expansion into Growth markets
Siemens’s rapid expansion in the growing market segments leads to
significant cash flows. In 2010, the company started the operation of a solar
thermal power plant in Lebrija, Spain, with a capacity of 50 megawatts. As
Spain is one of the leading solar markets in Europe, the company could tap the
potential in the market and explore avenues of growth and development. The
company started operation of an ultra modern plant where it manufactures
SOMATOM Spirit CT scanners in Shanghai, China, adding more potential products
in its healthcare portfolio. The company is also building smart grids that
permit low-loss, long-distance transmission of green electricity to urban areas
and developing innovative concepts for batteries that help offset power supply
fluctuations by serving as mobile power storage units. These expansions in new
markets would deliver higher revenue and strengthen its market leadership
position.
Growing IVD Market
Siemens Healthcare, the subsidiary of Siemens AG, is a global supplier
in the diagnostic field. The company provides a wide variety of diagnostic
testing systems and consumables, which include clinical chemistry and
immunodiagnostics, molecular diagnostics, hematology, hemostasis, microbiology,
point-of-care testing and clinical laboratory automation solutions. According
to in-house forecasts, the worldwide in-vitro diagnostics market in 2009 was
valued at around $40.4 billion. The market is expected to grow at a CAGR of
5.5% during 2009-2016 to reach $58.95 billion by 2016. Immuno Chemistry,
Genetic Testing, and Clinical Chemistry are the key growth categories in the
global in vitro diagnostics market. Immuno Chemistry with a growth rate of 10%
between 2002 and 2009 and a forecast growth rate of 8.2% between 2009 and 2016
was the fastest growing category in Asia Pacific. Genetic Testing is the
fastest growing category in Europe and North America with growth rates of 10.1%
and 6.2% respectively, between 2002 and 2009. Between 2009 and 2016, the
category is forecast to grow 6% in Europe and 6.3% in North America. In 2016,
Immuno Chemistry, the largest category, is expected to result in revenue of
$4,010.4 million (at a CAGR of 8.2% from 2009 to 2016) in Asia Pacific;
$3,701.9 million (CAGR of 4.7%) in Europe; and $10,109.7 million in North
America (CAGR of 5.7%). Clinical Chemistry category, in 2016, is forecast to
generate revenues of $3,242.9 million in Asia Pacific; $2,822.7 million in
Europe; and $5,689.8 million in North America. Major drivers for the growth in
this market include a growing and longer-living world population, associated
rising incidence of chronic diseases, insufficient staffing levels, and
government funding and reimbursement. IVD testing is an important contributing
factor that aids physicians in diagnosis. This is a factor that led to strong
and sustained growth in the market in the past and is expected to continue in
the future.
Favorable Government Initiatives
Companies focusing on renewable sources of energy such as Siemens are
expected to benefit from new governmental initiatives. The US administration
has set a goal to double the US renewable energy production in three years,
earmarking more than $70 billion for the renewable energy sector. The
provisions include grants and guaranteed loans available for various
applications, including systems for individual homes, rural small businesses
and agriculture producers. The proposed doubling of renewable energy within the
next three years would increase the share of renewable energy by roughly 6% of
the US electricity supply by the end of 2011. The Renewable Energy 401(k) Tax
Credit is estimated to lead to $100 billion in clean energy investment and
500,000 new green jobs over the next three years. In addition, the North
American Electric Reliability Council (NERC) and Federal Energy Regulatory
Commission (FERC) plan to modernize the electricity transmission system of the
US to adapt to renewable resource development. Such stimulus programs for
renewable energy would significantly increase the demand for wind and solar
products and benefit the players in the sector, including Siemens. The Chinese
government plans to double its wind installed capacity, which is one-third of
the world's total new installed capacity in 2009. This would help China meet
its 2020 target of 30,000 MW, ten years ahead of its renewable plan. The
company, with the appropriate mix of tax policy, government procurement along
with transmission grid development, interconnection standards, and other forms
of public sector support, could significantly benefit from the program.
Rising Demand for Renewable Energy Sources
The importance of climate change increased the interest of various
companies in power generation through renewable energy sources. The company’s
energy businesses are trying to integrate their business with renewable energy
sources to protect the environment and lessen the effect of green house gases.
It is forecast that the world electricity demand will double by 2030, with
renewable energy as the third largest contributor to global electricity
production and that renewable energy could meet around one fourth of the total
electricity demand by 2030. According to in-house data, the global wind energy
market is projected to reach around 456,202 MW by 2015 and around 756,061 MW by
2020. Siemens focuses on the development of wind power, solar, nuclear, hydro,
fuel cell technology and gas-to-liquid power. The company installed a total of
7,800 wind turbines with a capacity of around 9 GW. Governments across the
world provide subsidies to encourage such a shift to renewable energy sources.
Out of the 9 GW installed capacity, the company installed 800 MW offshore wind
turbines and has more than 3 GW order backlog for offshore wind power. The
company also started the operations of a solar thermal plant in Spain.
Increasing demand for renewable energy will increase the demand for the
company’s products and services such as wind power plants, hydro and fuel
cells. It will provide high growth potential for the company’s products in the
future.
Threats
Stringent
Regulatory Environment
Siemens has operations globally and faces risks from the protectionist
trade policies and changes in the political and regulatory environment such as
foreign exchange import and export controls, tariffs and other trade barriers
and price or exchange controls. This could affect the company’s business in
several national markets, impact the sales and profitability and make the
repatriation of profits difficult, and could expose to penalties, sanctions and
damage the company’s reputation. For example, the company conducts business
with customers in countries that are subject to export control regulations,
embargos, sanctions or other forms of trade restrictions imposed by the U.S.,
the European Union or other countries or organizations. Recently, the business
with customers in Iran was subjected to regulation under Resolution 1929 (2010)
of the Security Council of the United Nations; the U.S. Comprehensive Iran
Sanctions, Accountability, and Divestment Act of 2010, enacted on July 1, 2010;
as well as the Council Regulation (EU) No. 961/2010 of October 25, 2010, on
restrictive measures against Iran and repealing Regulation (EC) No. 423/2007.
New or tightened export control regulations, sanctions, embargos or other forms
of trade restrictions imposed on Iran could result in a curtailment of existing
business and adaptation of its policies. In addition, the termination of
operations in Iran could expose the company to customer claims and other
actions.
Global Economic Slowdown and Market Dynamics
The company could face several challenges due to global economic
slowdown. According to The World Bank, overall global GDP is expected to be
3.3% in 2011, before picking up to 3.5% in 2012, well below the 8.1% growth
rate in 2007. Economic growth slowed sharply in Europe, the US and Japan. GDP
growth in the US in 2010 was 3.3% and is forecast to decrease to 2.9% in 2011.
For Eurozone, the GDP growth in 2010 was 0.7% and is forecast to increase marginally
to 1.3% in 2011. The company operates in around twelve businesses worldwide and
could be affected by weakening market conditions. The current uncertainties in
economic conditions influence international capital market and make it
difficult for companies to plan budgets and forecasting. The company is
currently facing downward pricing pressure and is exposed to a market downturn
and slower growth due to high competition in the markets. The financial crisis
may stem the flow of capital expenditure by companies. Funding for growth
expansion plans now made it more difficult for companies to obtain financing
for their operations. The slowdown in the world economy limits Siemens’s future
business operations and revenue. The current financial crisis not only put
pressure on companies’ cash flows through lower commodity prices, but also made
it difficult and expensive for these companies to access external finance.
Healthcare Reform Bill
The healthcare reform bill signed by President Obama on March 23, 2010,
requires the players to subsidize healthcare bill through substantial annual
excise tax on medical device sales, commencing in 2013. The significant reforms
to the US healthcare system include provisions, among other things, to impose
new and increased taxes or to reduce and limit Medicare reimbursements. These
initiatives will result in reduced medical procedure volumes, impacting the
volume and price levels of products sold, and increased cost level. The
initiative by the government may harm business activities, results of
operations and the financial performance of the company.
International Fraud
Siemens AG falsified its accounts to make huge gains. Siemens and three
of its subsidiaries pleaded guilty to paying $1.4 billion in contract-winning
bribes to foreign officials. Siemens was guilty of violating the Foreign
Corrupt Practices Act (FCPA) and agreed to pay $1.6 billion as penalty. Much of
the money was carried as cash in suitcases, and paid in bribes to foreign
officials, winning Siemens AG lucrative development contracts. The
investigation against Siemens AG - coordinated by the US Department of Justice,
the Securities and Exchange Commission, and German authorities - found that
Siemens started systematically falsifying its corporate in the mid-1990s. Such
false practices would tarnish the company’s image in short to medium term.
|
Corporate Family
|
Corporate
Structure News: |
|
|
|
|
Siemens AG |
|
|
Company Name |
Company Type |
Location |
Country |
Industry |
Sales |
Employees |
|
|
Parent |
Munich |
Germany |
Scientific and Technical Instruments |
102,421.7 |
405,000 |
|
|
|
Joint venture with Dräger Medical Ag & Co. Kg. Joint venture with Nokia Siemens Networks Oy. Acquisition of Nem Standard Fasel Manufacturing B.V.
proposed/announced.See corporate
structure news on Siemens AG for details Acquisition of VISTAGY Inc proposed/announced.See corporate
structure news on Siemens AG for details Acquisition of Nem Energy Services B.V. proposed/announced.See corporate
structure news on Siemens AG for details
|
|||||||
|
OSRAM AG |
Subsidiary |
München |
Germany |
Personal and Household Products |
6,349.2 |
40,000 |
|
|
Acquisition of Encelium Technologies Inc proposed/announced. See corporate
structure news on Siemens AG for details |
|||||||
|
Subsidiary |
Regensburg |
Germany |
Semiconductors |
931.8 |
4,600 |
|
|
|
Subsidiary |
Bayan Lepas, Penang |
Malaysia |
Semiconductors |
401.2 |
2,500 |
|
|
|
Subsidiary |
Nové Zámky |
Slovakia |
Electronic Instruments and Controls |
137.9 |
1,849 |
|
|
|
Subsidiary |
Traunreut, Bayern |
Germany |
Construction - Supplies and Fixtures |
292.4 |
1,250 |
|
|
|
Pending acquisition by OSRAM GmbH.See corporate
structure news on Siemens AG for details |
|||||||
|
Subsidiary |
Traunreut, Bayern |
Germany |
Consumer Financial Services |
|
1 |
|
|
|
Subsidiary |
Cinisello Balsamo |
Italy |
Electronic Instruments and Controls |
7.4 |
10 |
|
|
|
Subsidiary |
Traunreut, Bayern |
Germany |
Consumer Financial Services |
|
|
|
|
|
Subsidiary |
Milano, MI |
Italy |
Electronic Instruments and Controls |
337.3 |
1,022 |
|
|
|
Subsidiary |
Foshan, Guangdong Province |
China |
Electronic Instruments and Controls |
133.0 |
1,000 |
|
|
|
Subsidiary |
Bruntál |
Czech Republic |
Electronic Instruments and Controls |
57.0 |
979 |
|
|
|
Subsidiary |
Molsheim |
France |
Construction - Supplies and Fixtures |
326.5 |
976 |
|
|
|
Subsidiary |
Molsheim |
France |
Electronic Instruments and Controls |
322.5 |
874 |
|
|
|
Subsidiary |
Sonepat, Haryana |
India |
Electronic Instruments and Controls |
|
800 |
|
|
|
Subsidiary |
Tultitlán, Estado de México |
Mexico |
Electronic Instruments and Controls |
25.0 |
700 |
|
|
|
Subsidiary |
Osasco, SP |
Brazil |
Electronic Instruments and Controls |
125.0 |
650 |
|
|
|
Subsidiary |
Wipperfürth |
Germany |
Electronic Instruments and Controls |
139.0 |
600 |
|
|
|
Subsidiary |
Ansan-si, Gyeonggi-do |
Korea, Republic of |
Electronic Instruments and Controls |
111.7 |
280 |
|
|
|
Subsidiary |
Beccar, Buenos Aires |
Argentina |
Electronic Instruments and Controls |
48.9 |
226 |
|
|
|
Subsidiary |
Buenos Aires |
Argentina |
Electronic Instruments and Controls |
60.0 |
190 |
|
|
|
Subsidiary |
Istanbul |
Turkey |
Electronic Instruments and Controls |
30.0 |
100 |
|
|
|
Subsidiary |
Bangkok |
Thailand |
Electronic Instruments and Controls |
12.0 |
100 |
|
|
|
Subsidiary |
Singapore, Singapore |
Singapore |
Electronic Instruments and Controls |
12.0 |
100 |
|
|
|
Subsidiary |
St Helens |
United Kingdom |
Construction - Supplies and Fixtures |
87.8 |
96 |
|
|
|
Subsidiary |
Yokohama |
Japan |
Electronic Instruments and Controls |
|
90 |
|
|
|
Subsidiary |
Taipei |
Taiwan |
Electronic Instruments and Controls |
|
85 |
|
|
|
Subsidiary |
Torrejon De Ardoz, Madrid |
Spain |
Electronic Instruments and Controls |
81.4 |
78 |
|
|
|
Subsidiary |
Haninge |
Sweden |
Electronic Instruments and Controls |
10.7 |
64 |
|
|
|
Subsidiary |
Warszawa |
Poland |
Electronic Instruments and Controls |
|
50 |
|
|
|
Subsidiary |
Midrand |
South Africa |
Electronic Instruments and Controls |
60.0 |
44 |
|
|
|
Subsidiary |
Winterthur |
Switzerland |
Electronic Instruments and Controls |
|
43 |
|
|
|
Subsidiary |
Athens |
Greece |
Electronic Instruments and Controls |
29.4 |
30 |
|
|
|
Subsidiary |
Wien |
Austria |
Electronic Instruments and Controls |
8.5 |
30 |
|
|
|
Subsidiary |
Lysaker |
Norway |
Electronic Instruments and Controls |
37.4 |
27 |
|
|
|
Subsidiary |
Carnaxide |
Portugal |
Electronic Instruments and Controls |
23.8 |
25 |
|
|
|
Subsidiary |
Pennant Hills, NSW |
Australia |
Furniture and Fixtures |
20.9 |
25 |
|
|
|
Subsidiary |
Tåstrup |
Denmark |
Electronic Instruments and Controls |
27.7 |
20 |
|
|
|
Subsidiary |
Petaling Jaya, Selangor |
Malaysia |
Electronic Instruments and Controls |
13.0 |
20 |
|
|
|
Subsidiary |
Espoo |
Finland |
Miscellaneous Capital Goods |
7.1 |
20 |
|
|
|
Subsidiary |
Petaling Jaya, Selangor |
Malaysia |
Electronic Instruments and Controls |
16.9 |
15 |
|
|
|
Subsidiary |
Budapest |
Hungary |
Electronic Instruments and Controls |
14.8 |
13 |
|
|
|
Subsidiary |
Zagreb |
Croatia |
Electronic Instruments and Controls |
1.0 |
6 |
|
|
|
Subsidiary |
Smolensk |
Russian Federation |
Electronic Instruments and Controls |
29.6 |
|
|
|
|
Subsidiary |
Makati City |
Philippines |
Electronic Instruments and Controls |
5.8 |
|
|
|
|
Subsidiary |
Dubai |
United Arab Emirates |
Electronic Instruments and Controls |
|
|
|
|
|
Subsidiary |
Capelle aan den IJssel |
Netherlands |
Electronic Instruments and Controls |
|
|
|
|
|
Subsidiary |
Tangerang |
Indonesia |
Electronic Instruments and Controls |
|
|
|
|
|
Subsidiary |
Ho Chi Minh City |
Viet Nam |
Electronic Instruments and Controls |
|
|
|
|
|
Subsidiary |
Sofia |
Bulgaria |
Electronic Instruments and Controls |
|
|
|
|
|
Subsidiary |
Bucharest |
Romania |
Electronic Instruments and Controls |
|
|
|
|
|
Subsidiary |
Moscow |
Russian Federation |
Electronic Instruments and Controls |
|
|
|
|
|
Subsidiary |
Beograd |
Serbia |
Furniture and Fixtures |
|
|
|
|
|
Subsidiary |
Hanoi |
Viet Nam |
Miscellaneous Capital Goods |
|
|
|
|
|
Subsidiary |
Nairobi |
Kenya |
Electronic Instruments and Controls |
|
|
|
|
|
Subsidiary |
Mostar |
Bosnia and Herzegovina |
Business Services |
|
|
|
|
|
Subsidiary |
Santiago de Chile |
Chile |
Furniture and Fixtures |
|
|
|
|
|
Subsidiary |
Kunshan |
China |
Electronic Instruments and Controls |
|
|
|
|
|
Subsidiary |
Hong Kong |
China |
Electronic Instruments and Controls |
|
|
|
|
|
Subsidiary |
Bogotá |
Colombia |
Engineering Consultants |
|
|
|
|
|
Subsidiary |
Shenyang |
China |
Electronic Instruments and Controls |
|
|
|
|
|
Subsidiary |
Hong Kong |
Hong Kong |
Furniture and Fixtures |
|
|
|
|
|
Subsidiary |
Hong Kong |
Hong Kong |
Electronic Instruments and Controls |
|
|
|
|
|
Subsidiary |
Tehran |
Iran |
Electronic Instruments and Controls |
|
|
|
|
|
Subsidiary |
Yokohama |
Japan |
Electronic Instruments and Controls |
|
|
|
|
|
Subsidiary |
Yokosuka-shi |
Japan |
Furniture and Fixtures |
|
|
|
|
|
Subsidiary |
Seoul |
Korea, Republic of |
Electronic Instruments and Controls |
|
|
|
|
|
Subsidiary |
Barendrecht |
Netherlands |
Furniture and Fixtures |
|
|
|
|
|
Subsidiary |
Lima |
Peru |
Furniture and Fixtures |
|
|
|
|
|
Subsidiary |
Beijing |
China |
Electronic Instruments and Controls |
7,835.1 |
33,600 |
|
|
|
Subsidiary |
Yizheng, Jaingsu Province |
China |
Electronic Instruments and Controls |
|
1,500 |
|
|
|
Subsidiary |
Suzhou, Jiangsu Province |
China |
Electronic Instruments and Controls |
170.9 |
800 |
|
|
|
Subsidiary |
Jinan City, Shan Dong |
China |
Electronic Instruments and Controls |
125.9 |
497 |
|
|
|
Subsidiary |
Guangzhou |
China |
Electronic Instruments and Controls |
|
|
|
|
|
Subsidiary |
Wuhan |
China |
Electronic Instruments and Controls |
|
|
|
|
|
Subsidiary |
Nanjing, Jaingsu Province |
China |
Scientific and Technical Instruments |
140.5 |
2 |
|
|
|
Subsidiary |
Wuxi, Jiangsu Province |
China |
Miscellaneous Capital Goods |
|
|
|
|
|
Subsidiary |
Beijing |
China |
Miscellaneous Capital Goods |
|
|
|
|
|
Subsidiary |
Shanghai |
China |
Communications Equipment |
|
|
|
|
|
Subsidiary |
Shanghai |
China |
Medical Equipment and Supplies |
|
|
|
|
|
Subsidiary |
Shanghai |
China |
Electronic Instruments and Controls |
|
|
|
|
|
Subsidiary |
Shanghai |
China |
Electronic Instruments and Controls |
|
|
|
|
|
Subsidiary |
Tianjin |
China |
Miscellaneous Capital Goods |
|
|
|
|
|
Subsidiary |
Hangzhou |
China |
Electronic Instruments and Controls |
|
|
|
|
|
Subsidiary |
Suzhou, Jiangsu Province |
China |
Medical Equipment and Supplies |
|
|
|
|
|
Subsidiary |
Beijing |
China |
Consumer Financial Services |
|
|
|
|
|
Subsidiary |
Shanghai |
China |
Electronic Instruments and Controls |
|
|
|
|
|
Subsidiary |
Xi'an, Shanxi Province |
China |
Communications Equipment |
|
|
|
|
|
Subsidiary |
Shanghai |
China |
Construction Services |
|
|
|
|
|
Subsidiary |
Shanghai |
China |
Electronic Instruments and Controls |
|
|
|
|
|
Subsidiary |
Shanghai |
China |
Electronic Instruments and Controls |
|
|
|
|
|
Subsidiary |
Huludao |
China |
Miscellaneous Capital Goods |
|
|
|
|
|
Subsidiary |
Tianjin |
China |
Engineering Consultants |
|
|
|
|
|
Subsidiary |
Shenzhen |
China |
Medical Equipment and Supplies |
|
|
|
|
|
Subsidiary |
Nanjing |
China |
Engineering Consultants |
|
|
|
|
|
Subsidiary |
Beijing |
China |
Real Estate Operations |
|
|
|
|
|
Subsidiary |
Dalian |
China |
Electronic Instruments and Controls |
|
|
|
|
|
Subsidiary |
Wuxi |
China |
Electronic Instruments and Controls |
|
|
|
|
|
Subsidiary |
Taicang |
China |
Electronic Instruments and Controls |
|
|
|
|
|
Subsidiary |
Wuxi |
China |
Medical Equipment and Supplies |
|
|
|
|
|
Subsidiary |
Tianjin |
China |
Electric Utilities |
|
|
|
|
|
Subsidiary |
Maharashtra |
India |
Miscellaneous Capital Goods |
350.0 |
17,200 |
|
|
|
Subsidiary |
Praha |
Czech Republic |
Communications Equipment |
1,541.5 |
10,500 |
|
|
|
Subsidiary |
São Paulo, SP |
Brazil |
Electronic Instruments and Controls |
2,125.2 |
10,170 |
|
|
|
Subsidiary |
São Paulo, SP |
Brazil |
Communications Equipment |
|
|
|
|
|
Subsidiary |
Manaus, AM |
Brazil |
Semiconductors |
|
|
|
|
|
Subsidiary |
São Caetano do Sul |
Brazil |
Software and Programming |
|
|
|
|
|
Subsidiary |
São Paulo |
Brazil |
Software and Programming |
|
|
|
|
|
Subsidiary |
Curitiba, Parana |
Brazil |
Communications Services |
|
10,000 |
|
|
|
Subsidiary |
Belo Horizonte, Minas Gerais |
Brazil |
Communications Services |
|
10,000 |
|
|
|
Subsidiary |
México, D.F. |
Mexico |
Electronic Instruments and Controls |
736.2 |
9,500 |
|
|
|
Subsidiary |
México |
Mexico |
Software and Programming |
|
|
|
|
|
Subsidiary |
México |
Mexico |
Software and Programming |
|
|
|
|
|
Subsidiary |
Wien |
Austria |
Communications Equipment |
3,294.6 |
8,664 |
|
|
|
Subsidiary |
Linz |
Austria |
Engineering Consultants |
1,669.5 |
1,500 |
|
|
|
Subsidiary |
St Chamond |
France |
Miscellaneous Capital Goods |
185.4 |
749 |
|
|
|
Subsidiary |
Sheffield |
United Kingdom |
Personal Services |
341.7 |
501 |
|
|
|
Subsidiary |
Dammam |
Saudi Arabia |
Construction Services |
|
266 |
|
|
|
Subsidiary |
Wien |
Austria |
Real Estate Operations |
109.7 |
395 |
|
|
|
Subsidiary |
Mainz |
Germany |
Business Services |
73.2 |
255 |
|
|
|
Subsidiary |
Wien |
Austria |
Audio and Video Equipment |
10.9 |
20 |
|
|
|
Subsidiary |
Budapest |
Hungary |
Software and Programming |
16.9 |
218 |
|
|
|
Subsidiary |
Wien, Wien |
Austria |
Software and Programming |
59.5 |
175 |
|
|
|
Subsidiary |
Wien, Wien |
Austria |
Business Services |
20.9 |
160 |
|
|
|
Subsidiary |
Ljubljana |
Slovenia |
Electronic Instruments and Controls |
75.8 |
131 |
|
|
|
Subsidiary |
Linz, Oberösterreich |
Austria |
Software and Programming |
37.0 |
95 |
|
|
|
Subsidiary |
Innsbruck |
Austria |
Computer Services |
4.8 |
55 |
|
|
|
Subsidiary |
Wien |
Austria |
Consumer Financial Services |
|
35 |
|
|
|
Subsidiary |
Wien |
Austria |
Business Services |
1.0 |
|
|
|
|
Subsidiary |
Wien |
Austria |
Security Systems and Services |
1.0 |
|
|
|
|
Subsidiary |
Wien |
Austria |
Electronic Instruments and Controls |
|
|
|
|
|
Subsidiary |
Eisenstadt |
Austria |
Scientific and Technical Instruments |
|
|
|
|
|
Subsidiary |
Laatzen |
Germany |
Scientific and Technical Instruments |
|
|
|
|
|
Subsidiary |
Linz |
Austria |
Electronic Instruments and Controls |
|
|
|
|
Subsidiary |
Linz |
Austria |
Software and Programming |
|
|
|
|
Subsidiary |
Wien |
Austria |
Appliance and Tool |
|
|
|
|
Subsidiary |
Linz |
Austria |
Software and Programming |
|
|
|
|
Subsidiary |
Wien |
Austria |
Investment Services |
|
|
|
|
Subsidiary |
Wien |
Austria |
Software and Programming |
|
|
|
|
Subsidiary |
Graz |
Austria |
Medical Equipment and Supplies |
|
|
|
|
VA Technologie AG |
Subsidiary |
|
|
|
|
|
|
Subsidiary |
Guanajuato, Guanajuato |
Mexico |
Electronic Instruments and Controls |
|
450 |
|
|
Subsidiary |
Linz, Oberösterreich |
Austria |
Construction Services |
9.5 |
270 |
|
|
Subsidiary |
Berlin |
Germany |
Computer Services |
36.2 |
125 |
|
|
Subsidiary |
Haidian District, Beijing |
China |
Metal Mining |
30.0 |
100 |
|
|
Subsidiary |
Camberley |
United Kingdom |
Electronic Instruments and Controls |
|
|
|
|
Subsidiary |
Manchester |
United Kingdom |
Electronic Instruments and Controls |
394.0 |
731 |
|
|
Subsidiary |
Camberley |
United Kingdom |
Nonclassifiable Industries |
|
|
|
|
Subsidiary |
Madhya Pradesh |
India |
Metal Mining |
|
|
|
|
Subsidiary |
Jakarta Pusat, Jakarta Pusat |
Indonesia |
Metal Mining |
|
|
|
|
Subsidiary |
Saint Denis |
France |
Electronic Instruments and Controls |
365.0 |
8,055 |
|
|
Subsidiary |
Bidart |
France |
Computer Networks |
18.9 |
149 |
|
|
Subsidiary |
Erlangen, Erlangen |
Germany |
Medical Equipment and Supplies |
11,906.0 |
8,000 |
|
|
Subsidiary |
Dubai |
United Arab Emirates |
Biotechnology and Drugs |
8.0 |
100 |
|
|
Subsidiary |
Budapest |
Hungary |
Medical Equipment and Supplies |
|
15 |
|
|
Subsidiary |
Eschborn |
Germany |
Medical Equipment and Supplies |
1.0 |
|
|
|
Subsidiary |
Algés |
Portugal |
Medical Equipment and Supplies |
|
21 |
|
|
Subsidiary |
Midrand |
South Africa |
Medical Equipment and Supplies |
|
21 |
|
|
Subsidiary |
Petaling Jaya |
Malaysia |
Medical Equipment and Supplies |
|
13 |
|
|
Subsidiary |
Newmarket |
New Zealand |
Medical Equipment and Supplies |
|
9 |
|
|
Subsidiary |
Tokyo |
Japan |
Biotechnology and Drugs |
1.0 |
|
|
|
Subsidiary |
Mumbai |
India |
Electronic Instruments and Controls |
2,687.7 |
7,488 |
|
|
Subsidiary |
Mumbai |
India |
Computer Services |
1.0 |
5,500 |
|
|
Subsidiary |
Chennai |
India |
Security Systems and Services |
1.0 |
120 |
|
|
Subsidiary |
Vadodara, Gujarat |
India |
Medical Equipment and Supplies |
16.6 |
|
|
|
Subsidiary |
Chennai |
India |
Engineering Consultants |
|
|
|
|
Subsidiary |
Mumbai |
India |
Miscellaneous Financial Services |
|
|
|
|
Subsidiary |
Bangalore |
India |
Medical Equipment and Supplies |
|
|
|
|
Subsidiary |
Bangalore |
India |
Business Services |
|
|
|
|
Subsidiary |
Mumbai |
India |
Software and Programming |
|
|
|
|
Subsidiary |
Kolkatta |
India |
Miscellaneous Fabricated Products |
|
|
|
|
Subsidiary |
Chennai |
India |
Business Services |
|
|
|
|
Subsidiary |
Kanchipuram |
India |
Engineering Consultants |
|
|
|
|
Subsidiary |
Plano, TX |
United States |
Computer Networks |
1,218.7 |
7,200 |
|
|
Branch |
Milford, OH |
United States |
Medical Equipment and Supplies |
225.4 |
700 |
|
|
Branch |
Pittsburgh, PA |
United States |
Engineering Consultants |
83.0 |
401 |
|
|
Subsidiary |
Maryland Heights, MO |
United States |
Retail (Technology) |
102.9 |
300 |
|
|
Branch |
Livonia, MI |
United States |
Business Services |
39.6 |
200 |
|
|
Subsidiary |
Milano |
Italy |
Computer Hardware |
53.0 |
133 |
|
|
Subsidiary |
Kista, Stockholm |
Sweden |
Software and Programming |
34.8 |
88 |
|
|
Branch |
Ann Arbor, MI |
United States |
Retail (Technology) |
20.8 |
80 |
|
|
Branch |
Ames, IA |
United States |
Retail (Technology) |
20.6 |
60 |
|
|
Branch |
San Jose, CA |
United States |
Software and Programming |
22.1 |
50 |
|
|
Branch |
West Chester, OH |
United States |
Retail (Technology) |
12.0 |
35 |
|
|
Branch |
Fairport, NY |
United States |
Software and Programming |
13.2 |
30 |
|
|
Branch |
Downers Grove, IL |
United States |
Computer Services |
6.6 |
30 |
|
|
Branch |
State College, PA |
United States |
Engineering Consultants |
5.2 |
25 |
|
|
Branch |
San Diego, CA |
United States |
Software and Programming |
|
13 |
|
|
Branch |
Köln |
Germany |
Software and Programming |
75.0 |
|
|
|
Tecnomatix Technologies
Ltd |
Subsidiary |
|
|
|
|
|
|
Subsidiary |
Newington, NH |
United States |
Retail (Technology) |
34.3 |
100 |
|
|
EDS PLM Solutions Inc |
Branch |
|
|
|
|
|
|
Subsidiary |
Urdorf, Zurich |
Switzerland |
Software and Programming |
|
70 |
|
|
Subsidiary |
Zürich |
Switzerland |
Communications Equipment |
1,402.6 |
5,076 |
|
|
Subsidiary |
Adliswil |
Switzerland |
Medical Equipment and Supplies |
|
13 |
|
|
Subsidiary |
Zürich |
Switzerland |
Consumer Financial Services |
|
10 |
|
|
Subsidiary |
Zürich |
Switzerland |
Investment Services |
|
|
|
|
Subsidiary |
Zürich |
Switzerland |
Software and Programming |
|
|
|
|
Subsidiary |
Burlington, ON |
Canada |
Electronic Instruments and Controls |
2,677.4 |
5,000 |
|
|
Subsidiary |
Peterborough, ON |
Canada |
Scientific and Technical Instruments |
117.3 |
350 |
|
|
Branch |
Edmonton, AB |
Canada |
Electronic Instruments and Controls |
65.9 |
200 |
|
|
Branch |
Saskatoon, SK |
Canada |
Electronic Instruments and Controls |
50.5 |
150 |
|
|
Branch |
Thornhill, ON |
Canada |
Electronic Instruments and Controls |
43.6 |
130 |
|
|
Branch |
Cambridge, ON |
Canada |
Electronic Instruments and Controls |
39.7 |
120 |
|
|
Branch |
Ottawa, ON |
Canada |
Electronic Instruments and Controls |
25.9 |
75 |
|
|
Branch |
Trois-Rivieres, QC |
Canada |
Electronic Instruments and Controls |
25.6 |
75 |
|
|
Branch |
Richmond, BC |
Canada |
Electronic Instruments and Controls |
23.6 |
70 |
|
|
Branch |
Markham, ON |
Canada |
Miscellaneous Capital Goods |
11.4 |
35 |
|
|
Subsidiary |
Regina, SK |
Canada |
Electronic Instruments and Controls |
31.6 |
32 |
|
|
Branch |
Mississauga, ON |
Canada |
Electronic Instruments and Controls |
10.2 |
30 |
|
|
Branch |
London, ON |
Canada |
Electronic Instruments and Controls |
10.1 |
30 |
|
|
Branch |
Stoney Creek, ON |
Canada |
Electronic Instruments and Controls |
10.1 |
30 |
|
|
Branch |
Kirkland Lake, ON |
Canada |
Electronic Instruments and Controls |
10.0 |
30 |
|
|
Branch |
Moncton, NB |
Canada |
Electronic Instruments and Controls |
10.0 |
30 |
|
|
Branch |
Sarnia, ON |
Canada |
Electronic Instruments and Controls |
7.7 |
23 |
|
|
Branch |
Quebec, QC |
Canada |
Electronic Instruments and Controls |
6.7 |
20 |
|
|
Subsidiary |
St Denis |
France |
Miscellaneous Capital Goods |
1,600.0 |
4,356 |
|
|
Subsidiary |
Toulouse |
France |
Miscellaneous Financial Services |
6.4 |
74 |
|
|
Subsidiary |
Saint-Denis |
France |
Scientific and Technical Instruments |
300.0 |
|
|
|
Subsidiary |
Saint-Denis |
France |
Software and Programming |
|
|
|
|
Subsidiary |
Champigny-sur-Marne |
France |
Retail (Specialty) |
|
|
|
|
Subsidiary |
Bussy Saint-Georges |
France |
Engineering Consultants |
|
|
|
|
Subsidiary |
Brande |
Denmark |
Miscellaneous Capital Goods |
2,835.7 |
3,913 |
|
|
Subsidiary |
Jakarta |
Indonesia |
Miscellaneous Capital Goods |
209.5 |
3,700 |
|
|
Subsidiary |
Buenos Aires |
Argentina |
Communications Equipment |
598.7 |
3,500 |
|
|
Subsidiary |
Villa Ballester, Buenos Aires |
Argentina |
Software and Programming |
452.3 |
2,000 |
|
|
Siemens
Energy & Automation, Inc./ Process Industries Division |
Division |
Alpharetta, GA |
United States |
Business Services |
|
3,324 |
|
Subsidiary |
Halfway House |
South Africa |
Communications Services |
1,000.0 |
3,200 |
|
|
Subsidiary |
Mayville |
South Africa |
Medical Equipment and Supplies |
|
|
|
|
Subsidiary |
Midrand |
South Africa |
Software and Programming |
|
|
|
|
Subsidiary |
Midrand |
South Africa |
Real Estate Operations |
|
|
|
|
Subsidiary |
Moscow |
Russian Federation |
Communications Equipment |
534.2 |
3,000 |
|
|
Subsidiary |
Moscow |
Russian Federation |
Medical Equipment and Supplies |
|
|
|
|
Subsidiary |
Finspång, Östergötland |
Sweden |
Electronic Instruments and Controls |
1,310.0 |
2,725 |
|
|
Subsidiary |
Trollhättan, Västra Götaland |
Sweden |
Miscellaneous Capital Goods |
1,310.0 |
2,725 |
|
|
Subsidiary |
Los Angeles, CA |
United States |
Medical Equipment and Supplies |
|
2,554 |
|
|
Subsidiary |
Milano, MI |
Italy |
Electronic Instruments and Controls |
2,097.7 |
2,510 |
|
|
Subsidiary |
Milano |
Italy |
Biotechnology and Drugs |
1.0 |
80 |
|
|
Branch |
Rome |
Italy |
Medical Equipment and Supplies |
1.0 |
25 |
|
|
Subsidiary |
Milan |
Italy |
Consumer Financial Services |
|
|
|
|
Subsidiary |
Milano |
Italy |
Medical Equipment and Supplies |
|
|
|
|
Subsidiary |
Milano |
Italy |
Software and Programming |
|
|
|
|
Subsidiary |
Mohelnice |
Czech Republic |
Electronic Instruments and Controls |
376.2 |
2,502 |
|
|
Subsidiary |
Tokyo |
Japan |
Electronic Instruments and Controls |
75.0 |
2,450 |
|
|
Subsidiary |
Tokyo |
Japan |
Medical Equipment and Supplies |
|
|
|
|
Subsidiary |
Tokyo |
Japan |
Consumer Financial Services |
|
|
|
|
Subsidiary |
Tokyo |
Japan |
Medical Equipment and Supplies |
|
|
|
|
Subsidiary |
Sagamihara-shi |
Japan |
Medical Equipment and Supplies |
|
|
|
|
Subsidiary |
Tokyo |
Japan |
Medical Equipment and Supplies |
|
|
|
|
Subsidiary |
Tres Cantos, Madrid |
Spain |
Communications Equipment |
1,619.1 |
2,318 |
|
|
Subsidiary |
Getafe, Madrid |
Spain |
Aerospace and Defense |
47.2 |
116 |
|
|
Subsidiary |
Getxo, Vizcaya |
Spain |
Miscellaneous Fabricated Products |
46.5 |
73 |
|
|
Subsidiary |
Cornella De Llobregat, Barcelona |
Spain |
Software and Programming |
13.7 |
57 |
|
|
Subsidiary |
Tres Cantos |
Spain |
Software and Programming |
|
|
|
|
Subsidiary |
Den Haag |
Netherlands |
Scientific and Technical Instruments |
|
2,300 |
|
|
Subsidiary |
Den Haag |
Netherlands |
Medical Equipment and Supplies |
|
|
|
|
Subsidiary |
's-Hertogenbosch |
Netherlands |
Software and Programming |
|
|
|
|
Subsidiary |
Zoetermeer |
Netherlands |
Software and Programming |
|
|
|
|
Subsidiary |
Hague |
Netherlands |
Rental and Leasing |
|
|
|
|
Subsidiary |
Istanbul |
Turkey |
Computer Hardware |
|
2,295 |
|
|
Subsidiary |
Warszawa |
Poland |
Electronic Instruments and Controls |
481.9 |
2,276 |
|
|
Subsidiary |
Warszawa |
Poland |
Consumer Financial Services |
|
65 |
|
|
Subsidiary |
Warsaw |
Poland |
Medical Equipment and Supplies |
|
|
|
|
Subsidiary |
Warsaw |
Poland |
Software and Programming |
|
|
|
|
Subsidiary |
Warsaw |
Poland |
Software and Programming |
|
|
|
|
Subsidiary |
Singapore, Singapore |
Singapore |
Computer Networks |
|
2,218 |
|
|
Subsidiary |
Singapore |
Singapore |
Miscellaneous Capital Goods |
|
2,200 |
|
|
Subsidiary |
Bayswater, VIC |
Australia |
Natural Gas Utilities |
1,203.3 |
2,080 |
|
|
Joint Venture |
Melbourne, VIC |
Australia |
Miscellaneous Financial Services |
400.8 |
3,000 |
|
|
Subsidiary |
Milton, QLD |
Australia |
Medical Equipment and Supplies |
|
|
|
|
Subsidiary |
Budapest |
Hungary |
Miscellaneous Capital Goods |
411.4 |
2,026 |
|
|
Subsidiary |
Budapest |
Hungary |
Electronic Instruments and Controls |
82.8 |
305 |
|
|
Subsidiary |
Budapest |
Hungary |
Real Estate Operations |
|
|
|
|
Subsidiary |
Budapest |
Hungary |
Medical Equipment and Supplies |
|
|
|
|
Subsidiary |
Cordoba, Cordoba |
Argentina |
Software and Programming |
452.3 |
2,000 |
|
|
Subsidiary |
Zug |
Switzerland |
Business Services |
|
2,000 |
|
|
Subsidiary |
Buc Cedex |
France |
Security Systems and Services |
|
500 |
|
|
Subsidiary |
Volketswil, Zurich |
Switzerland |
Electronic Instruments and Controls |
143.1 |
375 |
|
|
Subsidiary |
Atlanta, GA |
United States |
Software and Programming |
8.9 |
35 |
|
|
Subsidiary |
Buc |
France |
Appliance and Tool |
250.0 |
|
|
|
Subsidiary |
Dübendorf |
Switzerland |
Miscellaneous Fabricated Products |
75.0 |
|
|
|
Subsidiary |
Alcobendas |
Spain |
Construction Services |
|
|
|
|
Subsidiary |
Moscow |
Russian Federation |
Communications Equipment |
|
|
|
|
Subsidiary |
Frankfurt |
Germany |
Engineering Consultants |
1.0 |
200 |
|
|
Subsidiary |
Brampton, ON |
Canada |
Security Systems and Services |
68.0 |
165 |
|
|
Subsidiary |
Volketswil |
Switzerland |
Electronic Instruments and Controls |
|
10 |
|
|
Subsidiary |
München |
Germany |
Consumer Financial Services |
58.5 |
1,877 |
|
|
Subsidiary |
Erlangen, Bayern |
Germany |
Consumer Financial Services |
|
45 |
|
|
Subsidiary |
München, Bayern |
Germany |
Investment Services |
32.2 |
2 |
|
|
Subsidiary |
München |
Germany |
Consumer Financial Services |
|
2 |
|
|
Subsidiary |
München |
Germany |
Consumer Financial Services |
|
|
|
|
Subsidiary |
Wien, Wien |
Austria |
Railroads |
581.7 |
1,825 |
|
|
Subsidiary |
Upplands Väsby |
Sweden |
Communications Equipment |
620.9 |
1,761 |
|
|
Subsidiary |
Solna, Stockholm |
Sweden |
Consumer Financial Services |
73.4 |
144 |
|
|
Subsidiary |
Upplands Väsby, Stockholm |
Sweden |
Medical Equipment and Supplies |
9.1 |
29 |
|
|
Subsidiary |
Sollentuna, Stockholm |
Sweden |
Engineering Consultants |
11.3 |
14 |
|
|
Subsidiary |
Upplands Väsby |
Sweden |
Software and Programming |
|
|
|
|
Subsidiary |
Bruxelles |
Belgium |
Electronic Instruments and Controls |
993.5 |
1,619 |
|
|
Subsidiary |
Bruxelles |
Belgium |
Security Systems and Services |
10.2 |
48 |
|
|
Subsidiary |
Meerbeke |
Belgium |
Software and Programming |
6.6 |
25 |
|
|
Subsidiary |
Bruxelles |
Belgium |
Commercial Banks |
5.8 |
9 |
|
|
Subsidiary |
Seoul |
Korea, Republic of |
Electronic Instruments and Controls |
524.3 |
1,535 |
|
|
Subsidiary |
Zug |
Switzerland |
Electric Utilities |
1,598.9 |
1,500 |
|
|
Subsidiary |
Beijing |
China |
Communications Equipment |
|
1,500 |
|
|
Subsidiary |
Lincoln |
United Kingdom |
Miscellaneous Capital Goods |
434.8 |
1,484 |
|
|
Subsidiary |
Oslo |
Norway |
Electronic Instruments and Controls |
732.6 |
1,458 |
|
|
Subsidiary |
Oslo, Oslo |
Norway |
|
334.6 |
|
|
|
Subsidiary |
Frankenthal |
Germany |
Miscellaneous Capital Goods |
130.8 |
1,425 |
|
|
Subsidiary |
Zweibrücken, Rheinland-Pfalz |
Germany |
Miscellaneous Capital Goods |
171.7 |
470 |
|
|
Subsidiary |
Amadora |
Portugal |
Electronic Instruments and Controls |
664.6 |
1,413 |
|
|
Subsidiary |
Letohrad |
Czech Republic |
Electronic Instruments and Controls |
|
1,393 |
|
|
Subsidiary |
Bratislava |
Slovakia |
Electronic Instruments and Controls |
|
|
|
|
Division |
Mountain View, CA |
United States |
Medical Equipment and Supplies |
|
1,370 |
|
|
Subsidiary |
Karachi |
Pakistan |
Engineering Consultants |
175.4 |
1,308 |
|
|
Subsidiary |
Ruhstorf |
Germany |
Electronic Instruments and Controls |
521.3 |
1,300 |
|
|
Subsidiary |
Singapore |
Singapore |
Crops |
349.3 |
1,300 |
|
|
Subsidiary |
Espoo |
Finland |
Electronic Instruments and Controls |
390.9 |
1,291 |
|
|
Subsidiary |
Espoo |
Finland |
Software and Programming |
20.9 |
407 |
|
|
Branch |
Marupes novads |
Latvia |
Electronic Instruments and Controls |
25.5 |
75 |
|
|
Subsidiary |
Bogotá DC |
Colombia |
Electronic Instruments and Controls |
354.2 |
1,290 |
|
|
Subsidiary |
Singapore |
Singapore |
Appliance and Tool |
366.8 |
1,254 |
|
|
Subsidiary |
Singapore |
Singapore |
Medical Equipment and Supplies |
422.1 |
665 |
|
|
Subsidiary |
Batam, Riau |
Indonesia |
Medical Equipment and Supplies |
|
|
|
|
Subsidiary |
Singapore |
Singapore |
Medical Equipment and Supplies |
|
|
|
|
Subsidiary |
Ballerup |
Denmark |
Electronic Instruments and Controls |
595.1 |
1,236 |
|
|
Subsidiary |
Taastrup |
Denmark |
Software and Programming |
|
250 |
|
|
Subsidiary |
Helsingør |
Denmark |
Miscellaneous Capital Goods |
71.3 |
220 |
|
|
Subsidiary |
Brønshøj |
Denmark |
Medical Equipment and Supplies |
11.6 |
41 |
|
|
Subsidiary |
Allerød |
Denmark |
Software and Programming |
|
|
|
|
Subsidiary |
Abu Dhabi |
United Arab Emirates |
Electronic Instruments and Controls |
|
1,200 |
|
|
Subsidiary |
Krefeld |
Germany |
Retail (Specialty) |
|
1,200 |
|
|
Siemens
Energy & Automation, Inc./ Industrial Control Products Business Inc. |
Division |
Batavia, IL |
United States |
Scientific and Technical Instruments |
|
1,200 |
|
Subsidiary |
Istanbul, Istanbul |
Turkey |
Miscellaneous Fabricated Products |
191.0 |
1,009 |
|
|
Subsidiary |
Istanbul |
Turkey |
Consumer Financial Services |
|
|
|
|
Subsidiary |
Konstanz |
Germany |
Business Services |
1.0 |
1,000 |
|
|
Subsidiary |
Chaoyang District, Beijing |
China |
Miscellaneous Capital Goods |
|
1,000 |
|
|
Joint Venture |
Kuala Lumpur |
Malaysia |
Metal Mining |
|
1,000 |
|
|
Subsidiary |
Wien, Wien |
Austria |
Electronic Instruments and Controls |
550.0 |
975 |
|
|
Subsidiary |
São Paulo, SP |
Brazil |
Electronic Instruments and Controls |
614.2 |
970 |
|
|
Subsidiary |
Bratislava |
Slovakia |
Electronic Instruments and Controls |
298.3 |
955 |
|
|
Subsidiary |
Bratislava |
Slovakia |
Software and Programming |
50.8 |
723 |
|
|
Subsidiary |
Bratislava |
Slovakia |
Software and Programming |
6.5 |
168 |
|
|
Subsidiary |
Bratislava |
Slovakia |
Software and Programming |
|
|
|
|
Subsidiary |
Athens |
Greece |
Computer Hardware |
344.0 |
800 |
|
|
Subsidiary |
Trutnov |
Czech Republic |
Electronic Instruments and Controls |
90.2 |
792 |
|
|
Subsidiary |
Zagreb |
Croatia |
Electronic Instruments and Controls |
170.6 |
780 |
|
|
Subsidiary |
Tlajomulco De Zuniga, Jalisco |
Mexico |
Miscellaneous Capital Goods |
20.0 |
750 |
|
|
Subsidiary |
Cairo |
Egypt |
Engineering Consultants |
364.9 |
700 |
|
|
Subsidiary |
Petaling Jaya, Selangor |
Malaysia |
Electronic Instruments and Controls |
183.8 |
700 |
|
|
Subsidiary |
Cainta Rizal |
Philippines |
Communications Services |
15.2 |
700 |
|
|
Subsidiary |
Wittgensdorf, Sachsen |
Germany |
Iron and Steel |
|
650 |
|
|
Subsidiary |
Penig, Sachsen |
Germany |
Auto and Truck Parts |
|
630 |
|
|
Subsidiary |
Wien |
Austria |
Computer Services |
|
625 |
|
|
Subsidiary |
Buenos Aires |
Argentina |
Computer Services |
|
|
|
|
Subsidiary |
Kowloon |
Hong Kong |
Electronic Instruments and Controls |
90.0 |
600 |
|
|
Subsidiary |
Hong Kong |
Hong Kong |
Software and Programming |
|
|
|
|
Subsidiary |
München |
Germany |
Railroads |
1.0 |
600 |
|
|
Subsidiary |
Budapest |
Hungary |
Miscellaneous Capital Goods |
79.7 |
579 |
|
|
Subsidiary |
Lubliniec |
Poland |
Electronic Instruments and Controls |
|
553 |
|
|
Subsidiary |
Tübingen, Baden-Württemberg |
Germany |
Miscellaneous Capital Goods |
233.3 |
550 |
|
|
Subsidiary |
Caernarvon |
United Kingdom |
Chemical Manufacturing |
148.0 |
525 |
|
|
Subsidiary |
Bucharest |
Romania |
Electronic Instruments and Controls |
|
523 |
|
|
Subsidiary |
Brasov |
Romania |
Engineering Consultants |
|
|
|
|
Subsidiary |
Shinagawa-ku, Tokyo |
Japan |
Medical Equipment and Supplies |
|
506 |
|
|
Subsidiary |
Nordenham |
Germany |
Electronic Instruments and Controls |
139.3 |
500 |
|
|
Subsidiary |
Erlangen |
Germany |
Medical Equipment and Supplies |
131.6 |
500 |
|
|
Subsidiary |
Herford, Nordrhein-Westfalen |
Germany |
Medical Equipment and Supplies |
|
150 |
|
|
Subsidiary |
St Denis |
France |
Medical Equipment and Supplies |
80.6 |
149 |
|
|
Siemens
Audiológiai Technika Kereskedelmi és Szolgáltató Kft |
Subsidiary |
Budapest |
Hungary |
Medical Equipment and Supplies |
|
12 |
|
Joint Venture |
Buenos Aires, Buenos Aires |
Argentina |
Office Equipment |
90.0 |
500 |
|
|
Subsidiary |
Taipei |
Taiwan |
Electronic Instruments and Controls |
|
500 |
|
|
Subsidiary |
Wien, Wien |
Austria |
Software and Programming |
215.0 |
480 |
|
|
Subsidiary |
Chungchongbuk-d |
Korea, Republic of |
Electronic Instruments and Controls |
|
480 |
|
|
Subsidiary |
Riyadh |
Saudi Arabia |
Construction Services |
350.0 |
475 |
|
|
Subsidiary |
Durach, Bayern |
Germany |
Electronic Instruments and Controls |
269.2 |
470 |
|
|
Subsidiary |
Dublin |
Ireland |
Electronic Instruments and Controls |
219.0 |
469 |
|
|
Joint Venture |
Wien, Wien |
Austria |
|
162.4 |
465 |
|
|
Subsidiary |
Providencia |
Chile |
Electronic Instruments and Controls |
68.9 |
413 |
|
|
Subsidiary |
Rosh Ha'ayin |
Israel |
Electronic Instruments and Controls |
241.6 |
400 |
|
|
Subsidiary |
Worcester, MA |
United States |
Miscellaneous Capital Goods |
241.6 |
400 |
|
|
Subsidiary |
Sao Paulo |
Brazil |
Miscellaneous Fabricated Products |
|
15 |
|
|
Subsidiary |
Willstätt |
Germany |
Construction - Supplies and Fixtures |
122.7 |
400 |
|
|
Subsidiary |
Sheffield |
Germany |
Miscellaneous Fabricated Products |
|
|
|
|
Subsidiary |
Deerfield, IL |
United States |
Healthcare Facilities |
77.2 |
400 |
|
|
Subsidiary |
Caracas |
Venezuela |
Construction Services |
429.7 |
385 |
|
|
Subsidiary |
Thessaloniki |
Greece |
Electronic Instruments and Controls |
41.8 |
375 |
|
|
Subsidiary |
St Denis |
France |
Medical Equipment and Supplies |
217.8 |
374 |
|
|
Subsidiary |
Algiers |
Algeria |
Engineering Consultants |
350.0 |
369 |
|
|
Subsidiary |
Voerde |
Germany |
Electronic Instruments and Controls |
109.5 |
360 |
|
|
Branch |
Burlington, ON |
Canada |
Schools |
|
360 |
|
|
Subsidiary |
Makati City |
Philippines |
Miscellaneous Capital Goods |
58.9 |
350 |
|
|
Subsidiary |
Schweinfurt, Bayern |
Germany |
Miscellaneous Capital Goods |
39.8 |
350 |
|
|
Joint Venture |
Shanghai, Shanghai |
China |
Miscellaneous Capital Goods |
30.0 |
350 |
|
|
Subsidiary |
Bucharest |
Romania |
Miscellaneous Capital Goods |
30.0 |
350 |
|
|
Subsidiary |
Tehran |
Iran |
Electronic Instruments and Controls |
|
350 |
|
|
Subsidiary |
Madrid |
Spain |
Engineering Consultants |
68.9 |
346 |
|
|
Subsidiary |
Milano |
Italy |
Personal and Household Products |
283.0 |
336 |
|
|
Subsidiary |
Sungnam, Kyunggi-do |
Korea, Republic of |
Communications Equipment |
167.7 |
332 |
|
|
Subsidiary |
Cornella De Llobregat, Barcelona |
Spain |
Personal and Household Products |
216.3 |
326 |
|
|
Subsidiary |
Praha |
Czech Republic |
Computer Networks |
20.9 |
321 |
|
|
Subsidiary |
Dammam |
Saudi Arabia |
Engineering Consultants |
26.7 |
320 |
|
|
Subsidiary |
Dammam |
Saudi Arabia |
Engineering Consultants |
|
320 |
|
|
Subsidiary |
Deerfield, IL |
United States |
Medical Equipment and Supplies |
1,739.2 |
310 |
|
|
Branch |
Newark, DE |
United States |
Medical Equipment and Supplies |
430.5 |
1,500 |
|
|
Subsidiary |
West Sacramento, CA |
United States |
Medical Equipment and Supplies |
96.6 |
300 |
|
|
Branch |
Norwood, MA |
United States |
Medical Equipment and Supplies |
119.6 |
200 |
|
|
Subsidiary |
Milano |
Italy |
Medical Equipment and Supplies |
1.0 |
|
|
|
Simea GmbH
& Co. KG Ges. zur Fertigung elektronischer Komponenten |
Subsidiary |
Wien, Wien |
Austria |
|
29.0 |
310 |
|
Subsidiary |
Kiev |
Ukraine |
Electronic Instruments and Controls |
350.0 |
300 |
|
|
Subsidiary |
Casablanca |
Morocco |
Electronic Instruments and Controls |
|
300 |
|
|
Subsidiary |
Hanoi, Hanoi |
Viet Nam |
Miscellaneous Capital Goods |
|
300 |
|
|
Subsidiary |
Erlangen, Bayern |
Germany |
Computer Services |
|
299 |
|
|
Subsidiary |
Bremen, Bremen |
Germany |
Electronic Instruments and Controls |
232.5 |
290 |
|
|
Subsidiary |
Luxembourg-Hamm |
Luxembourg |
Electronic Instruments and Controls |
127.3 |
270 |
|
|
Subsidiary |
Dong Da District, Hanoi |
Viet Nam |
Metal Mining |
63.0 |
265 |
|
|
Subsidiary |
Günzburg |
Germany |
Appliance and Tool |
|
265 |
|
|
Subsidiary |
Hawalli |
Kuwait |
Appliance and Tool |
|
261 |
|
|
Subsidiary |
Torino |
Italy |
Construction and Agriculture Machinery |
130.0 |
253 |
|
|
Subsidiary |
Leonding, Oberösterreich |
Austria |
Miscellaneous Capital Goods |
78.0 |
250 |
|
|
Subsidiary |
Bamberg |
Germany |
Electronic Instruments and Controls |
146.4 |
320 |
|
|
Subsidiary |
St Louis |
France |
Electronic Instruments and Controls |
136.9 |
229 |
|
|
Subsidiary |
Cairo Montenotte |
Italy |
Electronic Instruments and Controls |
52.8 |
155 |
|
|
Subsidiary |
Basel |
Switzerland |
Miscellaneous Capital Goods |
|
|
|
|
Subsidiary |
South Windsor, NSW |
Australia |
Miscellaneous Capital Goods |
29.2 |
250 |
|
|
Subsidiary |
Meckenheim, Nordrhein-Westfalen |
Germany |
Computer Services |
|
250 |
|
|
Subsidiary |
Belgrade |
Serbia |
Electronic Instruments and Controls |
|
249 |
|
|
Subsidiary |
Belgrade |
Serbia |
Software and Programming |
|
|
|
|
Subsidiary |
Wien, Wien |
Austria |
|
28.7 |
241 |
|
|
Division |
Lowell, MA |
United States |
Miscellaneous Fabricated Products |
79.7 |
240 |
|
|
Subsidiary |
Sudbury |
United Kingdom |
Medical Equipment and Supplies |
99.0 |
239 |
|
|
Subsidiary |
Camberley |
United Kingdom |
Chemical Manufacturing |
123.4 |
237 |
|
|
Subsidiary |
Wien, Wien |
Austria |
|
238.9 |
232 |
|
|
Subsidiary |
Essen, Nordrhein-Westfalen |
Germany |
Software and Programming |
25.2 |
230 |
|
|
Subsidiary |
Wien, Wien |
Austria |
|
|
224 |
|
|
Subsidiary |
Alcobendas, Madrid |
Spain |
Appliance and Tool |
95.8 |
220 |
|
|
Subsidiary |
North Ryde, NSW |
Australia |
Medical Equipment and Supplies |
29.2 |
220 |
|
|
Division |
Saint Paul, MN |
United States |
Electronic Instruments and Controls |
|
220 |
|
|
Subsidiary |
Stoke Poges |
United Kingdom |
Miscellaneous Financial Services |
207.8 |
208 |
|
|
Subsidiary |
Dubai |
United Arab Emirates |
Security Systems and Services |
350.0 |
200 |
|
|
Subsidiary |
Norcross, GA |
United States |
Electronic Instruments and Controls |
152.6 |
200 |
|
|
Division |
Blue Bell, PA |
United States |
Electronic Instruments and Controls |
152.6 |
200 |
|
|
Subsidiary |
Almaty |
Kazakhstan |
Electronic Instruments and Controls |
100.0 |
200 |
|
|
Subsidiary |
Zaventem |
Belgium |
Furniture and Fixtures |
80.0 |
200 |
|
|
Subsidiary |
St Quentin |
France |
Furniture and Fixtures |
15.9 |
56 |
|
|
Subsidiary |
Calgary, AB |
Canada |
Electronic Instruments and Controls |
66.7 |
200 |
|
|
Subsidiary |
Irati , Paraná |
Brazil |
Miscellaneous Capital Goods |
38.0 |
200 |
|
|
Subsidiary |
Irving, TX |
United States |
Construction Services |
37.6 |
200 |
|
|
Subsidiary |
Erlangen |
Germany |
Electronic Instruments and Controls |
32.7 |
200 |
|
|
Subsidiary |
Mühlhausen/Thüringen, Thüringen |
Germany |
Scientific and Technical Instruments |
|
200 |
|
|
Subsidiary |
Malvern, PA |
United States |
Computer Services |
|
200 |
|
|
Subsidiary |
Milano |
Italy |
Miscellaneous Financial Services |
76.7 |
198 |
|
|
Subsidiary |
Zaventem |
Belgium |
Electronic Instruments and Controls |
81.0 |
197 |
|
|
Subsidiary |
Singapore |
Singapore |
Electronic Instruments and Controls |
63.1 |
193 |
|
|
Joint Venture |
Canonsburg, PA |
United States |
Engineering Consultants |
|
190 |
|
|
Subsidiary |
Damascus |
Syria |
Electronic Instruments and Controls |
|
185 |
|
|
Subsidiary |
Dhaka |
Bangladesh |
Electronic Instruments and Controls |
|
180 |
|
|
Subsidiary |
Tlalnepantla De Baz, Estado De Mexico |
Mexico |
Miscellaneous Capital Goods |
0.0 |
175 |
|
|
Subsidiary |
Renens VD, Vaud |
Switzerland |
Computer Services |
|
175 |
|
|
Subsidiary |
Lima |
Peru |
Electronic Instruments and Controls |
218.2 |
174 |
|
|
Subsidiary |
Berlin, Berlin |
Germany |
Miscellaneous Fabricated Products |
35.7 |
171 |
|
|
Subsidiary |
Hamburg, Hamburg |
Germany |
Electronic Instruments and Controls |
24.0 |
170 |
|
|
Subsidiary |
Berlin |
Germany |
Medical Equipment and Supplies |
39.8 |
168 |
|
|
Subsidiary |
Swords |
Ireland |
Biotechnology and Drugs |
189.7 |
167 |
|
|
Subsidiary |
Apapa, Lagos |
Nigeria |
Engineering Consultants |
|
155 |
|
|
Vermietungsgesellschaft
Objekt 12 GmbH & Co. Objekt München KG |
Subsidiary |
Düsseldorf, Nordrhein-Westfalen |
Germany |
Real Estate Operations |
|
153 |
|
Subsidiary |
Livonia, MI |
United States |
Retail (Technology) |
51.5 |
150 |
|
|
Subsidiary |
Bergen, Hordaland |
Norway |
Electronic Instruments and Controls |
32.9 |
150 |
|
|
Subsidiary |
Bayswater, VIC |
Australia |
Medical Equipment and Supplies |
29.2 |
150 |
|
|
Subsidiary |
Nashua, NH |
United States |
Miscellaneous Capital Goods |
|
150 |
|
|
Subsidiary |
Troisdorf, Nordrhein-Westfalen |
Germany |
Electronic Instruments and Controls |
|
150 |
|
|
Subsidiary |
Velizy Villacoublay |
France |
Software and Programming |
31.2 |
149 |
|
|
Division |
Rothschild, WI |
United States |
Miscellaneous Fabricated Products |
|
148 |
|
|
Division |
Thomasville, GA |
United States |
Biotechnology and Drugs |
|
148 |
|
|
Subsidiary |
Gyeonggi-Do |
Korea, Republic of |
Miscellaneous Capital Goods |
34.0 |
145 |
|
|
HanseCom
Gesellschaft für Informations- und Kommunikationsdienstleistungen mbH |
Subsidiary |
Hamburg, Hamburg |
Germany |
Computer Services |
28.2 |
140 |
|
Subsidiary |
Taipei City, Taipei City |
Taiwan |
Miscellaneous Capital Goods |
101.9 |
125 |
|
|
Subsidiary |
Calgary, AB |
Canada |
Electronic Instruments and Controls |
41.7 |
125 |
|
|
Subsidiary |
Alzenau |
Germany |
Engineering Consultants |
26.0 |
125 |
|
|
Subsidiary |
Crawley |
United Kingdom |
Electronic Instruments and Controls |
45.9 |
120 |
|
|
Division |
Canonsburg, PA |
United States |
Miscellaneous Capital Goods |
29.4 |
120 |
|
|
Division |
Shrewsbury, MA |
United States |
Miscellaneous Fabricated Products |
|
120 |
|
|
Subsidiary |
München |
Germany |
Rental and Leasing |
654.4 |
115 |
|
|
Subsidiary |
Alzenau, Bayern |
Germany |
Public Sector and Government |
18.1 |
115 |
|
|
Subsidiary |
Tunis |
Tunisia |
Communications Equipment |
12.0 |
110 |
|
|
Subsidiary |
Stonehouse |
United Kingdom |
Scientific and Technical Instruments |
0.0 |
105 |
|
|
Subsidiary |
Göteborg, Västra Götaland |
Sweden |
Biotechnology and Drugs |
2.9 |
104 |
|
|
Subsidiary |
Taipei |
Taiwan |
Electronic Instruments and Controls |
75.0 |
100 |
|
|
Subsidiary |
Sewickley, PA |
United States |
Chemical Manufacturing |
54.9 |
100 |
|
|
Subsidiary |
Velizy Villacoublay |
France |
Software and Programming |
33.8 |
100 |
|
|
Subsidiary |
Amman |
Jordan |
Construction Services |
30.0 |
100 |
|
|
Subsidiary |
Vilnius |
Lithuania |
Miscellaneous Capital Goods |
24.0 |
100 |
|
|
Subsidiary |
Dubai |
United Arab Emirates |
Miscellaneous Capital Goods |
24.0 |
100 |
|
|
Subsidiary |
Shanghai Nanhui District, Shanghai |
China |
Miscellaneous Capital Goods |
20.0 |
100 |
|
|
Subsidiary |
Jakarta |
Indonesia |
Miscellaneous Capital Goods |
17.0 |
100 |
|
|
Subsidiary |
Malvern, PA |
United States |
Healthcare Facilities |
14.5 |
100 |
|
|
Subsidiary |
Elk Grove Vlg, IL |
United States |
Miscellaneous Capital Goods |
13.3 |
100 |
|
|
Subsidiary |
Halfway House |
South Africa |
Miscellaneous Capital Goods |
12.0 |
100 |
|
|
Subsidiary |
Bucharest |
Romania |
Office Equipment |
2.0 |
100 |
|
|
Subsidiary |
Wan Chai, HKG |
Hong Kong |
Miscellaneous Capital Goods |
|
100 |
|
|
Subsidiary |
Nanjing, Jiangsu |
China |
Metal Mining |
|
100 |
|
|
Subsidiary |
Sarajevo |
Bosnia and Herzegovina |
Electronic Instruments and Controls |
|
100 |
|
|
Division |
Towanda, PA |
United States |
Chemical Manufacturing |
90.1 |
90 |
|
|
Subsidiary |
Petaling Jaya, Selangor |
Malaysia |
Biotechnology and Drugs |
30.0 |
90 |
|
|
Subsidiary |
Seoul, Seoul |
Korea, Republic of |
Medical Equipment and Supplies |
|
87 |
|
|
Subsidiary |
Klagenfurt |
Austria |
Computer Services |
23.4 |
85 |
|
|
Subsidiary |
Kassel, Hessen |
Germany |
Engineering Consultants |
|
85 |
|
|
Subsidiary |
New York, NY |
United States |
Electronic Instruments and Controls |
21,300.0 |
80 |
|
|
Subsidiary |
Malvern, PA |
United States |
Software and Programming |
|
5,000 |
|
|
Subsidiary |
Knoxville, TN |
United States |
Medical Equipment and Supplies |
401.7 |
963 |
|
|
Subsidiary |
Knoxville, TN |
United States |
Medical Equipment and Supplies |
|
500 |
|
|
Division |
Knoxville, TN |
United States |
Miscellaneous Capital Goods |
|
300 |
|
|
Division |
Knoxville, TN |
United States |
Medical Equipment and Supplies |
|
65 |
|
|
Subsidiary |
|
|
|
|
|
|
|
Subsidiary |
Knoxville, TN |
United States |
Medical Equipment and Supplies |
|
550 |
|
|
Branch |
Issaquah, WA |
United States |
Medical Equipment and Supplies |
169.1 |
525 |
|
|
Branch |
Flanders, NJ |
United States |
Medical Equipment and Supplies |
158.1 |
491 |
|
|
Subsidiary |
Piscataway, NJ |
United States |
Medical Equipment and Supplies |
211.0 |
350 |
|
|
Subsidiary |
West Palm Beach, FL |
United States |
Medical Equipment and Supplies |
83.5 |
427 |
|
|
Subsidiary |
Orleans, ON |
Canada |
Healthcare Facilities |
1.3 |
5 |
|
|
Branch |
La Mirada, CA |
United States |
Medical Equipment and Supplies |
61.5 |
150 |
|
|
Branch |
Concord, CA |
United States |
Medical Equipment and Supplies |
112.7 |
350 |
|
|
Branch |
Cypress, CA |
United States |
Medical Equipment and Supplies |
119.6 |
200 |
|
|
Branch |
Mountain View, CA |
United States |
Medical Equipment and Supplies |
82.2 |
200 |
|
|
Branch |
Norwood, MA |
United States |
Medical Equipment and Supplies |
48.3 |
150 |
|
|
Branch |
Atlanta, GA |
United States |
Medical Equipment and Supplies |
35.9 |
125 |
|
|
Branch |
Alpharetta, GA |
United States |
Scientific and Technical Instruments |
49.0 |
75 |
|
|
Branch |
Houston, TX |
United States |
Medical Equipment and Supplies |
35.9 |
60 |
|
|
Branch |
Cary, NC |
United States |
Medical Equipment and Supplies |
14.5 |
45 |
|
|
Branch |
Youngstown, OH |
United States |
Computer Hardware |
36.8 |
41 |
|
|
Subsidiary |
Orlando, FL |
United States |
Miscellaneous Capital Goods |
1,750.0 |
2,000 |
|
|
Branch |
Charlotte, NC |
United States |
Electronic Instruments and Controls |
203.7 |
799 |
|
|
Branch |
Alpharetta, GA |
United States |
Electronic Instruments and Controls |
152.6 |
200 |
|
|
Branch |
Houston, TX |
United States |
Miscellaneous Capital Goods |
115.3 |
100 |
|
|
Branch |
Irving, TX |
United States |
Electronic Instruments and Controls |
76.3 |
100 |
|
|
Branch |
Orlando, FL |
United States |
Electronic Instruments and Controls |
10.4 |
40 |
|
|
Branch |
Southfield, MI |
United States |
Engineering Consultants |
6.2 |
30 |
|
|
Branch |
Houston, TX |
United States |
Miscellaneous Capital Goods |
23.1 |
20 |
|
|
Branch |
La Porte, TX |
United States |
Retail (Home Improvement) |
5.2 |
20 |
|
|
Subsidiary |
Jacksonville, FL |
United States |
Aerospace and Defense |
|
15 |
|
|
Division |
Grand Rapids, MI |
United States |
Miscellaneous Capital Goods |
625.0 |
2,000 |
|
|
Branch |
Norcross, GA |
United States |
Miscellaneous Capital Goods |
10.9 |
20 |
|
|
Branch |
Charlotte, NC |
United States |
Engineering Consultants |
4.1 |
20 |
|
|
Subsidiary |
Boca Raton, FL |
United States |
Communications Equipment |
1,750.0 |
1,500 |
|
|
Branch |
San Carlos, CA |
United States |
Communications Services |
107.3 |
250 |
|
|
Branch |
Reston, VA |
United States |
Electronic Instruments and Controls |
202.0 |
200 |
|
|
Branch |
Irving, TX |
United States |
Business Services |
28.7 |
120 |
|
|
Branch |
Cypress, CA |
United States |
Electronic Instruments and Controls |
101.0 |
100 |
|
|
Branch |
Englewood, CO |
United States |
Computer Hardware |
75.0 |
80 |
|
|
Branch |
Pittsburgh, PA |
United States |
Electronic Instruments and Controls |
40.4 |
40 |
|
|
Branch |
Tucker, GA |
United States |
Scientific and Technical Instruments |
19.6 |
30 |
|
|
Branch |
Southfield, MI |
United States |
Business Services |
4.6 |
25 |
|
|
Subsidiary |
Buffalo Grove, IL |
United States |
Miscellaneous Capital Goods |
2,000.0 |
1,300 |
|
|
Branch |
Pine Brook, NJ |
United States |
Construction Services |
211.2 |
400 |
|
|
Branch |
Mt Prospect, IL |
United States |
Electronic Instruments and Controls |
228.9 |
300 |
|
|
Branch |
Florham Park, NJ |
United States |
Construction - Supplies and Fixtures |
69.6 |
300 |
|
|
Branch |
Plymouth, MI |
United States |
Electronic Instruments and Controls |
152.6 |
200 |
|
|
Branch |
Hayward, CA |
United States |
Scientific and Technical Instruments |
54.4 |
200 |
|
|
Branch |
Overland Park, KS |
United States |
Electronic Instruments and Controls |
114.5 |
150 |
|
|
Branch |
Longwood, FL |
United States |
Electronic Instruments and Controls |
114.5 |
150 |
|
|
Branch |
St Rose, LA |
United States |
Electronic Instruments and Controls |
75.0 |
130 |
|
|
Branch |
Oklahoma City, OK |
United States |
Electronic Instruments and Controls |
84.7 |
111 |
|
|
Branch |
Cleveland, OH |
United States |
Electronic Instruments and Controls |
68.7 |
90 |
|
|
Branch |
Phoenix, AZ |
United States |
Healthcare Facilities |
17.9 |
90 |
|
|
Branch |
Nashville, TN |
United States |
Electronic Instruments and Controls |
61.0 |
80 |
|
|
Branch |
Richmond, VA |
United States |
Construction Services |
42.2 |
80 |
|
|
Branch |
Syracuse, NY |
United States |
Scientific and Technical Instruments |
21.8 |
80 |
|
|
Branch |
Cincinnati, OH |
United States |
Electronic Instruments and Controls |
57.2 |
75 |
|
|
Branch |
Omaha, NE |
United States |
Business Services |
12.8 |
75 |
|
|
Branch |
Anchorage, AK |
United States |
Construction Services |
13.9 |
74 |
|
|
Branch |
Amherst, NY |
United States |
Electronic Instruments and Controls |
49.6 |
65 |
|
|
Branch |
Louisville, KY |
United States |
Scientific and Technical Instruments |
17.7 |
65 |
|
|
Branch |
Worthington, OH |
United States |
Electronic Instruments and Controls |
45.8 |
60 |
|
|
Branch |
Tampa, FL |
United States |
Communications Equipment |
19.7 |
60 |
|
|
Branch |
Roseville, MN |
United States |
Miscellaneous Capital Goods |
14.7 |
60 |
|
|
Branch |
West Sacramento, CA |
United States |
Electronic Instruments and Controls |
38.2 |
50 |
|
|
Branch |
Jacksonville, FL |
United States |
Scientific and Technical Instruments |
13.6 |
50 |
|
|
Branch |
Mechanicsburg, PA |
United States |
Miscellaneous Capital Goods |
12.3 |
50 |
|
|
Branch |
Bridgeville, PA |
United States |
Electronic Instruments and Controls |
35.1 |
46 |
|
|
Branch |
Rochester, NY |
United States |
Electronic Instruments and Controls |
34.3 |
45 |
|
|
Branch |
Charlotte, NC |
United States |
Scientific and Technical Instruments |
12.2 |
45 |
|
|
Branch |
Cromwell, CT |
United States |
Scientific and Technical Instruments |
12.2 |
45 |
|
|
Branch |
Austin, TX |
United States |
Business Services |
6.3 |
37 |
|
|
Branch |
Latham, NY |
United States |
Scientific and Technical Instruments |
9.5 |
35 |
|
|
Branch |
Palm City, FL |
United States |
Construction Services |
6.6 |
35 |
|
|
Branch |
Bohemia, NY |
United States |
Electronic Instruments and Controls |
22.9 |
30 |
|
|
Branch |
Virginia Beach, VA |
United States |
Electronic Instruments and Controls |
22.9 |
30 |
|
|
Branch |
West Allis, WI |
United States |
Construction Services |
15.8 |
30 |
|
|
Branch |
San Antonio, TX |
United States |
Miscellaneous Capital Goods |
7.4 |
30 |
|
|
Branch |
Sandy, UT |
United States |
Business Services |
5.5 |
30 |
|
|
Branch |
Lafayette, LA |
United States |
Electronic Instruments and Controls |
19.1 |
25 |
|
|
Branch |
Blue Bell, PA |
United States |
Miscellaneous Capital Goods |
6.1 |
25 |
|
|
Branch |
Tallahassee, FL |
United States |
Electronic Instruments and Controls |
15.3 |
20 |
|
|
Branch |
Diberville, MS |
United States |
Construction Services |
10.6 |
20 |
|
|
Division |
Hoffman Estates, IL |
United States |
Medical Equipment and Supplies |
598.0 |
1,000 |
|
|
Subsidiary |
Danvers, MA |
United States |
Electronic Instruments and Controls |
1,750.0 |
800 |
|
|
Branch |
El Paso, TX |
United States |
Electronic Instruments and Controls |
707.0 |
700 |
|
|
Branch |
Manchester, NH |
United States |
Scientific and Technical Instruments |
424.5 |
650 |
|
|
Branch |
Hillsborough, NH |
United States |
Electronic Instruments and Controls |
457.8 |
600 |
|
|
Branch |
St Marys, PA |
United States |
Electronic Instruments and Controls |
173.5 |
500 |
|
|
Division |
Exeter, NH |
United States |
Chemical Manufacturing |
106.1 |
300 |
|
|
Branch |
Exeter, NH |
United States |
Miscellaneous Capital Goods |
93.1 |
300 |
|
|
Branch |
Winchester, KY |
United States |
Photography |
86.8 |
250 |
|
|
Branch |
Versailles, KY |
United States |
Electronic Instruments and Controls |
73.2 |
240 |
|
|
Branch |
Wellsboro, PA |
United States |
Furniture and Fixtures |
111.4 |
200 |
|
|
Branch |
Corbin, KY |
United States |
Miscellaneous Fabricated Products |
33.0 |
170 |
|
|
Branch |
Bethlehem, PA |
United States |
Electronic Instruments and Controls |
76.3 |
100 |
|
|
Subsidiary |
Mississauga, ON |
Canada |
Furniture and Fixtures |
34.0 |
100 |
|
|
Branch |
Westfield, IN |
United States |
Retail (Specialty) |
17.5 |
94 |
|
|
Branch |
Central Falls, RI |
United States |
Business Services |
159.6 |
93 |
|
|
Branch |
Warren, PA |
United States |
Fabricated Plastic and Rubber |
18.2 |
80 |
|
|
Branch |
Ontario, CA |
United States |
Electronic Instruments and Controls |
50.5 |
50 |
|
|
Branch |
Monroeville, PA |
United States |
Business Services |
5.9 |
50 |
|
|
Branch |
Phoenix, AZ |
United States |
Business Services |
4.7 |
40 |
|
|
Branch |
Tampa, FL |
United States |
Electronic Instruments and Controls |
22.9 |
30 |
|
|
Branch |
Hayward, CA |
United States |
Electronic Instruments and Controls |
22.9 |
30 |
|
|
Branch |
Columbia, MD |
United States |
Retail (Specialty) |
4.7 |
25 |
|
|
Subsidiary |
Sacramento, CA |
United States |
Railroads |
330.0 |
350 |
|
|
Branch |
Lake Oswego, OR |
United States |
Electronic Instruments and Controls |
5.2 |
20 |
|
|
Siemens
Medical Solutions USA, Inc./ Oncology Care Systems Group |
Division |
Concord, CA |
United States |
Medical Equipment and Supplies |
|
331 |
|
Subsidiary |
Richardson, TX |
United States |
Business Services |
14.7 |
300 |
|
|
Division |
Minnetonka, MN |
United States |
Electronic Instruments and Controls |
76.4 |
294 |
|
|
Branch |
Houston, TX |
United States |
Miscellaneous Capital Goods |
311.3 |
270 |
|
|
Subsidiary |
Alpharetta, GA |
United States |
Electronic Instruments and Controls |
2,100.0 |
250 |
|
|
Branch |
Grand Prairie, TX |
United States |
Electronic Instruments and Controls |
143.0 |
550 |
|
|
Branch |
Alpharetta, GA |
United States |
Scientific and Technical Instruments |
136.0 |
500 |
|
|
Branch |
Arlington, TX |
United States |
Miscellaneous Fabricated Products |
132.8 |
400 |
|
|
Branch |
West Chicago, IL |
United States |
Electronic Instruments and Controls |
122.7 |
380 |
|
|
Branch |
Cincinnati, OH |
United States |
Electronic Instruments and Controls |
81.6 |
320 |
|
|
Branch |
Richland, MS |
United States |
Electronic Instruments and Controls |
89.4 |
275 |
|
|
Branch |
Flowood, MS |
United States |
Scientific and Technical Instruments |
163.3 |
250 |
|
|
Branch |
Austin, TX |
United States |
Electronic Instruments and Controls |
160.2 |
210 |
|
|
Branch |
Lebanon, OH |
United States |
Miscellaneous Capital Goods |
108.8 |
200 |
|
|
Branch |
Bartlesville, OK |
United States |
Scientific and Technical Instruments |
54.6 |
200 |
|
|
Branch |
Johnson City, TN |
United States |
Construction Services |
37.6 |
200 |
|
|
Branch |
Houston, TX |
United States |
Construction Services |
32.8 |
200 |
|
|
Branch |
Houston, TX |
United States |
Miscellaneous Capital Goods |
173.0 |
150 |
|
|
Subsidiary |
Hauppauge, NY |
United States |
Electronic Instruments and Controls |
10.0 |
105 |
|
|
Branch |
Bellefontaine, OH |
United States |
Electronic Instruments and Controls |
76.3 |
100 |
|
|
Branch |
Duluth, GA |
United States |
Scientific and Technical Instruments |
65.3 |
100 |
|
|
Branch |
Troy, MI |
United States |
Retail (Home Improvement) |
19.4 |
75 |
|
|
Branch |
Suwanee, GA |
United States |
Electronic Instruments and Controls |
51.9 |
68 |
|
|
Branch |
Pomona, CA |
United States |
Electronic Instruments and Controls |
15.1 |
58 |
|
|
Branch |
Fort Washington, PA |
United States |
Construction Services |
9.4 |
50 |
|
|
Branch |
New Kensington, PA |
United States |
Miscellaneous Transportation |
6.3 |
50 |
|
|
Branch |
Auburn Hills, MI |
United States |
Electronic Instruments and Controls |
9.8 |
48 |
|
|
Branch |
Little Rock, AR |
United States |
Electronic Instruments and Controls |
30.5 |
40 |
|
|
Branch |
Roebuck, SC |
United States |
Scientific and Technical Instruments |
9.5 |
35 |
|
|
Branch |
Atlanta, GA |
United States |
Electronic Instruments and Controls |
19.1 |
25 |
|
|
Branch |
Houston, TX |
United States |
Construction Services |
4.7 |
25 |
|
|
Branch |
Pryor, OK |
United States |
Electric Utilities |
19.0 |
21 |
|
|
Branch |
N Chesterfield, VA |
United States |
Electronic Instruments and Controls |
15.3 |
20 |
|
|
Branch |
Beltsville, MD |
United States |
Communications Equipment |
65.6 |
200 |
|
|
Subsidiary |
Princeton, NJ |
United States |
Medical Equipment and Supplies |
|
200 |
|
|
Subsidiary |
Wendell, NC |
United States |
Electronic Instruments and Controls |
|
189 |
|
|
Branch |
Jackson, TN |
United States |
Electronic Instruments and Controls |
24.2 |
24 |
|
|
Subsidiary |
Trenton, NJ |
United States |
Miscellaneous Capital Goods |
76.4 |
175 |
|
|
Subsidiary |
Norwalk, CT |
United States |
Business Services |
3,750.0 |
167 |
|
|
Branch |
Minnetonka, MN |
United States |
Software and Programming |
43.2 |
275 |
|
|
Branch |
Redmond, WA |
United States |
Software and Programming |
11.8 |
75 |
|
|
Subsidiary |
Blytheville, AR |
United States |
Miscellaneous Capital Goods |
75.0 |
150 |
|
|
Branch |
Decatur, AL |
United States |
Iron and Steel |
13.7 |
60 |
|
|
Branch |
Huger, SC |
United States |
Miscellaneous Capital Goods |
6.7 |
40 |
|
|
Subsidiary |
Morrison, IL |
United States |
Electronic Instruments and Controls |
23.4 |
150 |
|
|
Siemens
Medical Solutions Health Services Corporation/ Home Health Solutions
Corporation |
Division |
Altoona, PA |
United States |
Software and Programming |
|
145 |
|
Subsidiary |
Columbus, OH |
United States |
Furniture and Fixtures |
22.5 |
115 |
|
|
Division |
Salt Lake City, UT |
United States |
Medical Equipment and Supplies |
29.0 |
90 |
|
|
Subsidiary |
Pittsburgh, PA |
United States |
Business Services |
|
82 |
|
|
Division |
Portland, OR |
United States |
Scientific and Technical Instruments |
21.8 |
80 |
|
|
Subsidiary |
Warrendale, PA |
United States |
Public Sector and Government |
1,200.0 |
55 |
|
|
Branch |
Waukesha, WI |
United States |
Business Services |
32.5 |
250 |
|
|
Branch |
Thomasville, GA |
United States |
Business Services |
46.0 |
200 |
|
|
Branch |
Rothschild, WI |
United States |
Miscellaneous Capital Goods |
40.0 |
200 |
|
|
Branch |
Vineland, NJ |
United States |
Miscellaneous Fabricated Products |
53.1 |
160 |
|
|
Branch |
St Paul, MN |
United States |
Electronic Instruments and Controls |
114.5 |
150 |
|
|
Branch |
Naperville, IL |
United States |
Miscellaneous Fabricated Products |
41.5 |
125 |
|
|
Branch |
Colorado Springs, CO |
United States |
Business Services |
15.6 |
120 |
|
|
Branch |
Holland, MI |
United States |
Miscellaneous Capital Goods |
20.0 |
116 |
|
|
Branch |
Ames, IA |
United States |
Business Services |
16.4 |
110 |
|
|
Branch |
South Windsor, NSW |
Australia |
Waste Management Services |
250.0 |
100 |
|
|
Branch |
Union, NJ |
United States |
Miscellaneous Fabricated Products |
13.9 |
70 |
|
|
Branch |
Sarasota, FL |
United States |
Miscellaneous Fabricated Products |
20.6 |
62 |
|
|
Branch |
Plant City, FL |
United States |
Oil and Gas Operations |
188.2 |
60 |
|
|
Branch |
Roscoe, IL |
United States |
Miscellaneous Fabricated Products |
53.3 |
60 |
|
|
Branch |
Conroe, TX |
United States |
Miscellaneous Fabricated Products |
19.9 |
60 |
|
|
Branch |
Signal Hill, CA |
United States |
Business Services |
6.2 |
50 |
|
|
Branch |
Manchester, NH |
United States |
Miscellaneous Fabricated Products |
15.7 |
49 |
|
|
Branch |
Milpitas, CA |
United States |
Business Services |
5.9 |
45 |
|
|
Branch |
Broussard, LA |
United States |
Business Services |
5.2 |
40 |
|
|
Branch |
Los Angeles, CA |
United States |
Business Services |
4.7 |
36 |
|
|
Branch |
Levittown, PA |
United States |
Business Services |
4.6 |
35 |
|
|
Branch |
San Diego, CA |
United States |
Miscellaneous Fabricated Products |
10.0 |
30 |
|
|
Subsidiary |
Ancaster, ON |
Canada |
Healthcare Facilities |
5.7 |
30 |
|
|
Branch |
Vancouver, WA |
United States |
Business Services |
3.9 |
30 |
|
|
Branch |
East Rutherford, NJ |
United States |
Business Services |
3.9 |
30 |
|
|
Branch |
Chalfont, PA |
United States |
Business Services |
3.9 |
30 |
|
|
Branch |
Parker, AZ |
United States |
Chemical Manufacturing |
20.0 |
20 |
|
|
Branch |
Markham, ON |
Canada |
Public Sector and Government |
0.1 |
14 |
|
|
Subsidiary |
Iselin, NJ |
United States |
Investment Services |
|
50 |
|
|
Subsidiary |
Bothell, WA |
United States |
Software and Programming |
|
45 |
|
|
Subsidiary |
Palo Alto, CA |
United States |
Miscellaneous Financial Services |
|
13 |
|
|
Subsidiary |
Auckland |
New Zealand |
Engineering Consultants |
11.0 |
80 |
|
|
Division |
Warren, PA |
United States |
Scientific and Technical Instruments |
|
80 |
|
|
Subsidiary |
Taipei City, Taipei City |
Taiwan |
Miscellaneous Capital Goods |
|
80 |
|
|
Subsidiary |
Amadora |
Portugal |
Personal and Household Products |
49.6 |
77 |
|
|
Subsidiary |
Altenrhein, St. Gall |
Switzerland |
Electronic Instruments and Controls |
15.7 |
75 |
|
|
Subsidiary |
Albertslund |
Denmark |
Software and Programming |
11.9 |
75 |
|
|
Subsidiary |
Gummersbach, Nordrhein-Westfalen |
Germany |
Engineering Consultants |
11.8 |
75 |
|
|
Subsidiary |
Ciudad Apodaca, Nuevo Leon |
Mexico |
Communications Equipment |
0.1 |
75 |
|
|
Subsidiary |
Kowloon, Kowloon |
Hong Kong |
Audio and Video Equipment |
|
75 |
|
|
Subsidiary |
Schenectady, NY |
United States |
Scientific and Technical Instruments |
|
75 |
|
|
Subsidiary |
Düdingen, Fribourg |
Switzerland |
Medical Equipment and Supplies |
|
75 |
|
|
Subsidiary |
St Denis |
France |
Consumer Financial Services |
246.2 |
74 |
|
|
Subsidiary |
Breda, Noord-Brabant |
Netherlands |
Healthcare Facilities |
|
74 |
|
|
Subsidiary |
Hamburg |
Germany |
Electronic Instruments and Controls |
940.0 |
70 |
|
|
Subsidiary |
Grünwald, Bayern |
Germany |
Business Services |
|
70 |
|
|
Subsidiary |
Hong Kong, Hong Kong |
Hong Kong |
Retail (Technology) |
|
68 |
|
|
Subsidiary |
Renningen |
Germany |
Business Services |
13.5 |
67 |
|
|
Subsidiary |
Milano |
Italy |
Electronic Instruments and Controls |
53.3 |
60 |
|
|
Subsidiary |
Bruxelles |
Belgium |
Personal and Household Products |
0.0 |
60 |
|
|
Subsidiary |
Austin, TX |
United States |
Scientific and Technical Instruments |
|
60 |
|
|
Subsidiary |
Bangalore |
India |
Business Services |
|
59 |
|
|
Subsidiary |
Benton Harbor, MI |
United States |
Miscellaneous Capital Goods |
10.0 |
57 |
|
|
Subsidiary |
Berlin, Berlin |
Germany |
Electronic Instruments and Controls |
58.9 |
55 |
|
|
Subsidiary |
Tres Cantos, Madrid |
Spain |
Communications Equipment |
92.2 |
54 |
|
|
Subsidiary |
Tres Cantos, Madrid |
Spain |
Rental and Leasing |
14.2 |
46 |
|
|
Subsidiary |
Solna, Stockholm |
Sweden |
Business Services |
24.4 |
51 |
|
|
Subsidiary |
Stoney Creek, ON |
Canada |
Electronic Instruments and Controls |
49.6 |
50 |
|
|
Subsidiary |
Mt Laurel, NJ |
United States |
Electronic Instruments and Controls |
38.2 |
50 |
|
|
Subsidiary |
Dartmouth, NS |
Canada |
Electronic Instruments and Controls |
16.5 |
50 |
|
|
Subsidiary |
Minneapolis, MN |
United States |
Retail (Specialty) |
10.5 |
50 |
|
|
Division |
Edwardsville, KS |
United States |
Miscellaneous Fabricated Products |
|
50 |
|
|
Subsidiary |
Irxleben, Sachsen-Anhalt |
Germany |
Scientific and Technical Instruments |
|
50 |
|
|
Subsidiary |
Erlangen |
Germany |
Healthcare Facilities |
|
50 |
|
|
Subsidiary |
Dallas, TX |
United States |
Software and Programming |
|
48 |
|
|
Subsidiary |
Oslo, Oslo |
Norway |
Personal and Household Products |
20.2 |
46 |
|
|
Subsidiary |
Sydney, NSW |
Australia |
Scientific and Technical Instruments |
|
46 |
|
|
Division |
Roseville, MN |
United States |
Miscellaneous Fabricated Products |
14.9 |
45 |
|
|
Subsidiary |
Ballerup |
Denmark |
Healthcare Facilities |
17.2 |
42 |
|
|
Branch |
Ajax, ON |
Canada |
Miscellaneous Capital Goods |
|
40 |
|
|
Subsidiary |
Monterrey, Nuevo Leon |
Mexico |
Communications Equipment |
0.1 |
37 |
|
|
Subsidiary |
Bangalore |
India |
Medical Equipment and Supplies |
|
37 |
|
|
Subsidiary |
Zürich, Zurich |
Switzerland |
Software and Programming |
|
35 |
|
|
Subsidiary |
Sofia |
Bulgaria |
Electronic Instruments and Controls |
101.0 |
33 |
|
|
Subsidiary |
Kansas City, MO |
United States |
Electronic Instruments and Controls |
25.2 |
33 |
|
|
Subsidiary |
Paderborn, Nordrhein-Westfalen |
Germany |
Scientific and Technical Instruments |
|
33 |
|
|
Subsidiary |
Benton Harbor, MI |
United States |
Miscellaneous Capital Goods |
5.0 |
30 |
|
|
Subsidiary |
Camberley |
United Kingdom |
Real Estate Operations |
0.1 |
29 |
|
|
Subsidiary |
|
United Kingdom |
|
|
29 |
|
|
Subsidiary |
Valle del Cauca |
Colombia |
Miscellaneous Capital Goods |
5.0 |
25 |
|
|
Subsidiary |
Tashkent |
Uzbekistan |
Medical Equipment and Supplies |
1.8 |
25 |
|
|
Subsidiary |
Espoo |
Finland |
Miscellaneous Financial Services |
46.4 |
24 |
|
|
Joint Venture |
Princeton, NJ |
United States |
Medical Equipment and Supplies |
7.7 |
24 |
|
|
Subsidiary |
Houston, TX |
United States |
Appliance and Tool |
39.9 |
20 |
|
|
Subsidiary |
Mornago |
Italy |
Construction and Agriculture Machinery |
12.6 |
20 |
|
|
Subsidiary |
Wien |
Austria |
Investment Services |
|
20 |
|
|
Subsidiary |
Grünwald, Bayern |
Germany |
Consumer Financial Services |
|
20 |
|
|
Subsidiary |
Oslo, Oslo |
Norway |
|
15.5 |
19 |
|
|
Subsidiary |
Fridley, MN |
United States |
Miscellaneous Fabricated Products |
3.5 |
18 |
|
|
Subsidiary |
Barranquilla, Atlantico |
Colombia |
Miscellaneous Capital Goods |
3.0 |
15 |
|
|
Subsidiary |
Roscoe, IL |
United States |
Miscellaneous Fabricated Products |
|
15 |
|
|
Subsidiary |
Seoul, Seoul |
Korea, Republic of |
Communications Equipment |
|
14 |
|
|
WIVERTIS
Gesellschaft für Informations- und Kommunikationsdienstleistungen mbH |
Subsidiary |
Wiesbaden, Hessen |
Germany |
Business Services |
14.2 |
12 |
|
Subsidiary |
Freiberg, Sachsen |
Germany |
Miscellaneous Capital Goods |
|
12 |
|
|
Subsidiary |
Baku |
Azerbaijan |
Electronic Instruments and Controls |
|
11 |
|
|
Subsidiary |
Ballerup |
Denmark |
Consumer Financial Services |
|
11 |
|
|
Subsidiary |
Ashgabat |
Turkmenistan |
Electronic Instruments and Controls |
61.5 |
10 |
|
|
Subsidiary |
Hannover |
Germany |
Business Services |
10.2 |
10 |
|
|
Subsidiary |
Reading, PA |
United States |
Miscellaneous Capital Goods |
2.5 |
9 |
|
|
Subsidiary |
Nashua, NH |
United States |
Business Services |
1.2 |
9 |
|
|
Subsidiary |
St Denis |
France |
Consumer Financial Services |
36.1 |
7 |
|
|
Division |
Houston, TX |
United States |
Real Estate Operations |
1.1 |
5 |
|
|
Subsidiary |
Camberley |
United Kingdom |
Commercial Banks |
|
4 |
|
|
Subsidiary |
Poole |
United Kingdom |
Computer Hardware |
3,600.8 |
7,201 |
|
|
Subsidiary |
Cannock |
United Kingdom |
Electronic Instruments and Controls |
176.0 |
625 |
|
|
Subsidiary |
Bracknell |
United Kingdom |
Nonclassifiable Industries |
|
|
|
|
Subsidiary |
London |
United Kingdom |
Computer Services |
676.0 |
2,982 |
|
|
Subsidiary |
Manchester |
United Kingdom |
Electronic Instruments and Controls |
173.1 |
578 |
|
|
Subsidiary |
Hebburn |
United Kingdom |
Electronic Instruments and Controls |
31.4 |
92 |
|
|
Subsidiary |
Slough |
United Kingdom |
Miscellaneous Financial Services |
|
|
|
|
Subsidiary |
Grünwald, Bayern |
Germany |
Real Estate Operations |
|
3 |
|
|
Subsidiary |
München, Bayern |
Germany |
Commercial Banks |
168.4 |
2 |
|
|
Subsidiary |
Wien, Wien |
Austria |
|
87.8 |
2 |
|
|
Subsidiary |
Grünwald, Bayern |
Germany |
Business Services |
|
2 |
|
|
Subsidiary |
's-Gravenhage, Zuid-Holland |
Netherlands |
Commercial Banks |
|
1 |
|
|
Subsidiary |
Grünwald, Bayern |
Germany |
Real Estate Operations |
|
1 |
|
|
Subsidiary |
Duisburg |
Germany |
Miscellaneous Capital Goods |
114,270.0 |
|
|
|
Subsidiary |
Brasschaat |
Belgium |
Electric Utilities |
1.0 |
4 |
|
|
Subsidiary |
Erlangen |
Germany |
Auto and Truck Parts |
3,750.0 |
|
|
|
Subsidiary |
Chatillon Cedex |
France |
Railroads |
125.0 |
60 |
|
|
Subsidiary |
Prague |
Czech Republic |
Electronic Instruments and Controls |
1,750.0 |
|
|
|
Subsidiary |
Praha |
Czech Republic |
Construction Services |
92.3 |
407 |
|
|
Subsidiary |
Praha |
Czech Republic |
Medical Equipment and Supplies |
|
9 |
|
|
Subsidiary |
Drásov |
Czech Republic |
Electronic Instruments and Controls |
|
|
|
|
Subsidiary |
Brno |
Czech Republic |
Miscellaneous Capital Goods |
|
|
|
|
Subsidiary |
Prague |
Czech Republic |
Software and Programming |
|
|
|
|
Subsidiary |
Prague |
Czech Republic |
Software and Programming |
|
|
|
|
Subsidiary |
Co Dublin |
Ireland |
Medical Equipment and Supplies |
608.3 |
|
|
|
Subsidiary |
Caracas |
Venezuela |
Engineering Consultants |
125.0 |
|
|
|
Subsidiary |
Stavanger, Rogaland |
Norway |
|
32.8 |
|
|
|
Subsidiary |
Milano |
Italy |
Miscellaneous Financial Services |
7.2 |
|
|
|
Subsidiary |
Marnate |
Italy |
Miscellaneous Capital Goods |
105.1 |
203 |
|
|
Subsidiary |
Trento |
Italy |
Miscellaneous Capital Goods |
140.8 |
136 |
|
|
Subsidiary |
Bocholt |
Germany |
Electronic Instruments and Controls |
1.6 |
|
|
|
Subsidiary |
Penig |
Germany |
Miscellaneous Capital Goods |
1.0 |
700 |
|
|
Subsidiary |
Wittgensdorf b Chemnitz |
Germany |
Miscellaneous Fabricated Products |
|
630 |
|
|
Subsidiary |
Tubingen |
Germany |
Miscellaneous Capital Goods |
1.0 |
550 |
|
|
Branch |
Herne |
Germany |
Electronic Instruments and Controls |
|
286 |
|
|
Subsidiary |
Illkirch Graffenstaden |
France |
Miscellaneous Capital Goods |
86.6 |
280 |
|
|
Subsidiary |
Wien, Wien |
Austria |
Auto and Truck Parts |
4.5 |
120 |
|
|
Subsidiary |
Kolkata |
India |
Auto and Truck Parts |
1.0 |
30 |
|
|
Subsidiary |
Elancourt |
France |
Engineering Consultants |
|
30 |
|
|
Subsidiary |
München |
Germany |
Real Estate Operations |
1.0 |
|
|
|
Subsidiary |
Linz |
Austria |
Electronic Instruments and Controls |
|
|
|
|
Subsidiary |
Luanda |
Angola |
Engineering Consultants |
|
|
|
|
Subsidiary |
Ciudad de Guatemala |
Guatemala |
Electronic Instruments and Controls |
|
|
|
|
Subsidiary |
Maputo |
Mozambique |
Electronic Instruments and Controls |
|
|
|
|
Subsidiary |
Nairobi |
Kenya |
Computer Hardware |
|
|
|
|
Subsidiary |
Seoul |
Korea, Republic of |
Biotechnology and Drugs |
|
|
|
|
Subsidiary |
Bratislava |
Slovakia |
Miscellaneous Capital Goods |
|
|
|
|
Subsidiary |
San José |
Costa Rica |
Electronic Instruments and Controls |
|
|
|
|
Subsidiary |
Managua |
Nicaragua |
Electronic Instruments and Controls |
|
|
|
|
Subsidiary |
Kingston |
Jamaica |
Electronic Instruments and Controls |
|
|
|
|
Subsidiary |
Kathmandu |
Nepal |
Electronic Instruments and Controls |
|
|
|
|
Subsidiary |
Pu Dong, Shanghai |
China |
Miscellaneous Capital Goods |
|
|
|
|
Subsidiary |
Seoul, Seoul |
Korea, Republic of |
Medical Equipment and Supplies |
|
|
|
|
Subsidiary |
Buenos Aires, Buenos Aires |
Argentina |
Construction Services |
|
|
|
|
Branch |
Belo Horizonte , Minas Gerais |
Brazil |
Construction Services |
|
|
|
|
Division |
San Jose, CA |
United States |
Business Services |
|
|
|
|
Subsidiary |
Singapore |
Singapore |
Business Services |
|
|
|
|
Subsidiary |
Ho Chi Minh City |
Viet Nam |
Engineering Consultants |
|
|
|
|
Subsidiary |
Grünwald, Bayern |
Germany |
Insurance (Accident and Health) |
|
|
|
|
Subsidiary |
Slough |
United Kingdom |
Commercial Banks |
|
|
|
|
Subsidiary |
Slough |
United Kingdom |
Commercial Banks |
18.6 |
|
|
|
Subsidiary |
Banbury |
United Kingdom |
Construction Services |
|
|
|
|
Subsidiary |
Düsseldorf |
Germany |
Engineering Consultants |
|
|
|
|
Industrieschutz
Assekuranz-Vermittlung Gesellschaft mit beschränkter Haftung |
Subsidiary |
Mülheim An Der Ruhr, Nordrhein-Westfalen |
Germany |
Investment Services |
1.5 |
5 |
|
Subsidiary |
München, Bayern |
Germany |
Commercial Banks |
|
2 |
|
|
Subsidiary |
Zhuzhou, Hunan Province |
China |
Medical Equipment and Supplies |
|
|
|
|
Subsidiary |
Ciudad de Panamá |
Panama |
Electronic Instruments and Controls |
|
|
|
Subsidiary |
Dhaka |
Bangladesh |
Communications Equipment |
|
|
|
|
Subsidiary |
Mumbai |
India |
Computer Hardware |
|
|
|
|
Subsidiary |
Bursa |
Turkey |
Auto and Truck Parts |
|
|
|
|
Subsidiary |
Nicosia |
Cyprus |
Computer Hardware |
|
|
|
|
Subsidiary |
München |
Germany |
Appliance and Tool |
|
|
|
|
Subsidiary |
Chisinau |
Moldova, Republic of |
Medical Equipment and Supplies |
|
|
|
|
Subsidiary |
Minsk |
Belarus |
Electronic Instruments and Controls |
|
|
|
|
Subsidiary |
Moscow |
Russian Federation |
Miscellaneous Capital Goods |
|
|
|
|
Subsidiary |
Kiev |
Ukraine |
Communications Equipment |
|
|
|
|
Subsidiary |
Kiev |
Ukraine |
Electronic Instruments and Controls |
|
|
|
|
Subsidiary |
Hengelo |
Netherlands |
Miscellaneous Capital Goods |
|
|
|
|
Subsidiary |
's-Gravenhage, Zuid-Holland |
Netherlands |
Miscellaneous Capital Goods |
|
|
|
|
Subsidiary |
Eschborn, Hessen |
Germany |
Commercial Banks |
|
3 |
|
|
Subsidiary |
Beirut |
Lebanon |
Miscellaneous Capital Goods |
|
|
|
|
Subsidiary |
Banja Luka |
Bosnia and Herzegovina |
Medical Equipment and Supplies |
|
|
|
|
Subsidiary |
Tripoli |
Libyan Arab Jamahiriya |
Miscellaneous Capital Goods |
|
|
|
|
Subsidiary |
Karlsruhe |
Germany |
Real Estate Operations |
|
|
|
|
SVM Star
Ventures Managementgesellschaft mbH Nr. 3 & Co. Beteiligungs KG Nr. 4 |
Subsidiary |
München, Bayern |
Germany |
Business Services |
|
|
|
Subsidiary |
Al Athaiba |
Oman |
Electronic Instruments and Controls |
|
|
|
|
Subsidiary |
Capital Federal, Buenos Aires |
Argentina |
Metal Mining |
|
|
|
|
Subsidiary |
Quito, Pichincha |
Ecuador |
Scientific and Technical Instruments |
|
|
|
|
Subsidiary |
San Salvador |
El Salvador |
Electronic Instruments and Controls |
|
|
|
|
Subsidiary |
Tegucigalpa |
Honduras |
Electronic Instruments and Controls |
|
|
|
|
Subsidiary |
Champs Fleurs |
Trinidad and Tobago |
Electronic Instruments and Controls |
|
|
|
|
Subsidiary |
Istanbul |
Turkey |
Business Services |
|
|
|
|
Subsidiary |
Kiev |
Ukraine |
Appliance and Tool |
|
|
|
|
Subsidiary |
Port Louis |
Mauritius |
Electronic Instruments and Controls |
|
|
|
|
Subsidiary |
Camberley |
United Kingdom |
Nonclassifiable Industries |
|
|
|
|
Subsidiary |
Sunbury-On-Thames |
United Kingdom |
|
|
|
|
|
Subsidiary |
Jersey |
United Kingdom |
|
|
|
|
|
Subsidiary |
Manama |
Bahrain |
Miscellaneous Capital Goods |
|
|
|
|
Subsidiary |
Muscat |
Oman |
Biotechnology and Drugs |
|
|
|
|
Subsidiary |
St Petersburg |
Russian Federation |
Miscellaneous Capital Goods |
|
|
|
|
Subsidiary |
Wetter |
Germany |
Construction Services |
|
|
|
|
Subsidiary |
Kosice |
Slovakia |
Metal Mining |
|
|
|
|
Joint Venture |
Riyadh, Ar Riyad |
Saudi Arabia |
Construction Services |
|
|
|
|
Subsidiary |
Nuremberg |
Germany |
Business Services |
|
|
|
|
Subsidiary |
München, Bayern |
Germany |
Engineering Consultants |
|
|
|
|
Wesmag
Weseler Maschinenbaugesellschaft mit beschränkter Haftung |
Subsidiary |
München, Bayern |
Germany |
Miscellaneous Capital Goods |
|
|
|
Subsidiary |
Bochum-Wattenscheid |
Germany |
Electronic Instruments and Controls |
|
|
|
|
Subsidiary |
Beit Shemesh |
Israel |
Electric Utilities |
|
|
|
|
Subsidiary |
Sofia |
Bulgaria |
Software and Programming |
|
|
|
|
Subsidiary |
Santa Cruz de la Sierra |
Bolivia |
Engineering Consultants |
|
|
|
|
Subsidiary |
São Bernardo do Campo |
Brazil |
Miscellaneous Capital Goods |
|
|
|
|
Subsidiary |
Munich |
Germany |
Engineering Consultants |
|
|
|
|
Subsidiary |
Munich |
Germany |
Real Estate Operations |
|
|
|
|
Subsidiary |
Munich |
Germany |
Engineering Consultants |
|
|
|
|
Subsidiary |
Berlin |
Germany |
Real Estate Operations |
|
|
|
|
Subsidiary |
Mülheim |
Germany |
Real Estate Operations |
|
|
|
|
Subsidiary |
Nürnberg |
Germany |
Real Estate Operations |
|
|
|
|
Subsidiary |
Munich |
Germany |
Miscellaneous Financial Services |
|
|
|
|
Subsidiary |
Munich |
Germany |
Business Services |
|
|
|
|
Subsidiary |
Paderborn |
Germany |
Electronic Instruments and Controls |
|
|
|
|
Subsidiary |
München |
Germany |
Business Services |
|
|
|
|
Subsidiary |
Essen |
Germany |
Business Services |
|
|
|
|
Subsidiary |
Berlin |
Germany |
Miscellaneous Transportation |
|
|
|
|
Subsidiary |
Tres Cantos |
Spain |
Communications Services |
|
|
|
|
Subsidiary |
Zagreb |
Croatia |
Software and Programming |
|
|
|
|
Subsidiary |
Vilnius |
Lithuania |
Medical Equipment and Supplies |
|
|
|
|
Subsidiary |
Riga |
Latvia |
Medical Equipment and Supplies |
|
|
|
|
Subsidiary |
Hengelo |
Netherlands |
Miscellaneous Capital Goods |
|
|
|
|
Subsidiary |
Wroclaw |
Poland |
Miscellaneous Capital Goods |
|
|
|
|
Subsidiary |
Poznan |
Poland |
Medical Equipment and Supplies |
|
|
|
|
Subsidiary |
Doha |
Qatar |
Engineering Consultants |
|
|
|
|
Subsidiary |
Moscow |
Russian Federation |
Appliance and Tool |
|
|
|
|
Subsidiary |
Moscow |
Russian Federation |
Software and Programming |
|
|
|
|
Subsidiary |
Maracaibo |
Venezuela |
Miscellaneous Capital Goods |
|
|
|
|
Subsidiary |
Neubiberg |
Germany |
Miscellaneous Capital Goods |
|
|
|
|
Subsidiary |
Dar es Salaam |
Tanzania |
Engineering Consultants |
|
|
|
|
Subsidiary |
Ljubljana |
Germany |
Engineering Consultants |
|
|
|
|
Subsidiary |
Bochum, Nordrhein-Westfalen |
Germany |
Electronic Instruments and Controls |
|
|
|
|
Subsidiary |
Grünwald, Bayern |
Germany |
Commercial Banks |
|
|
|
|
Subsidiary |
Calgary, AB |
Canada |
Nonclassifiable Industries |
|
|
|
|
Subsidiary |
Cannock |
United Kingdom |
Nonclassifiable Industries |
|
|
|
|
Subsidiary |
Wanchai |
Hong Kong |
Electronic Instruments and Controls |
|
|
|
|
Subsidiary |
Gurgaon |
India |
Engineering Consultants |
|
|
|
|
Subsidiary |
Bangkok, Bangkok |
Thailand |
Communications Equipment |
|
|
|
|
Subsidiary |
Ho Chi Minh, Ho Chi Minh |
Viet Nam |
Medical Equipment and Supplies |
|
|
|
|
Subsidiary |
Eschborn, Hessen |
Germany |
Consumer Financial Services |
|
|
|
|
Subsidiary |
Marburg, Hessen |
Germany |
Biotechnology and Drugs |
676.2 |
1,300 |
|
|
Subsidiary |
Eschborn, Hessen |
Germany |
Biotechnology and Drugs |
294.2 |
506 |
|
|
Subsidiary |
Marburg, Hessen |
Germany |
Consumer Financial Services |
|
2 |
|
|
Bewator Holding Ab |
Subsidiary |
|
|
|
|
|
|
Cale Group Ab |
Subsidiary |
|
|
|
|
|
|
Subsidiary |
Tonbridge |
United Kingdom |
Retail (Catalog and Mail Order) |
|
|
|
|
Subsidiary |
Tonbridge |
United Kingdom |
Miscellaneous Capital Goods |
5.6 |
|
|
|
Bewator Group Ab |
Subsidiary |
|
|
|
|
|
|
Subsidiary |
Askim, Västra Götaland |
Sweden |
Auto and Truck Parts |
3.8 |
51 |
Executives Report
|
|
|||||||||||||||||||||||||||||||||||||||||||||||||||||||||||||||||||||||||||||||||||||||||||||||||||||||||||||||||||||||||||||||||||||||||||||||||||||||||||||||||||||||||||||||||||||||||||||||||||||||||||||||||||||||||||||||||||||||||||||||||||||||||||||||||||||||||||||||||||||||||||||||||||||||||||||||||||||||||||||||||||||||||||||||||||||||||||||||||||||||||||||||||||||||||||||||||||||||||||||||||||||||||||||||||||||||||||||||||||||||||||||||||||||||||||||||||||||||||||||||||||||||||||||||||||||||||||||||||||||||||||||||||||||||||||||||||||||||||||||||||||||||||||||||||||||||||||||||||||||||||||||||||||||||||||||||||||||||||||||||||||||||||||||||||||||||||||||||||||||||||||||||||||||||||||||||||||||||||||||||||||||||||||||||||||||||||||||||||||||||||||||||||||||||||||||||||||||||||||||||||||||||||||||||||||||||||||||||||||||||||||||||||||||||||||||||||||||||||||||||||||||||||||||||||||||||||||||||||||||||||||||||||||||||||||||||||||||||||||||||||||||||||||||||||||||||||||||||||||||||
Significant Developments
|
Annual Profit & Loss
|
|
30-Sep-2010 |
30-Sep-2009 |
30-Sep-2008 |
|
Period Length |
12 Months |
12 Months |
12 Months |
|
Filed Currency |
EUR |
EUR |
EUR |
|
Exchange Rate
(Period Average) |
0.740255 |
0.73971 |
0.666382 |
|
Consolidated |
Yes |
Yes |
Yes |
|
|
|
|
|
|
Total income |
102,637.7 |
103,623.0 |
116,040.1 |
|
Net sales |
102,637.7 |
103,623.0 |
116,040.1 |
|
Other operating income |
1,156.4 |
1,493.8 |
7,614.3 |
|
Cost of sales |
73,395.0 |
75,625.6 |
84,462.1 |
|
Gross profit |
29,242.6 |
27,997.5 |
31,578.0 |
|
General expenses |
15,035.4 |
14,730.1 |
20,387.7 |
|
Other operating costs |
7,431.2 |
6,126.7 |
9,021.9 |
|
Net operating
income |
7,932.4 |
8,634.5 |
9,782.7 |
|
Other income |
2,919.3 |
1,126.1 |
1,341.6 |
|
Interest payable on loans |
2,553.2 |
923.3 |
1,251.5 |
|
Other expenses |
54.0 |
2,222.5 |
- |
|
Total expenses |
141.8 |
3,320.2 |
-573.2 |
|
Profit before tax |
7,790.6 |
5,314.2 |
10,355.9 |
|
Provisions |
23,655.4 |
18,488.3 |
19,185.7 |
|
Total taxation |
2,295.2 |
1,938.6 |
1,523.2 |
|
Net profit |
5,495.4 |
3,375.6 |
8,832.8 |
Annual
Balance Sheet
Financials in: USD (mil)
|
|
30-Sep-2010 |
30-Sep-2009 |
30-Sep-2008 |
|
Filed Currency |
EUR |
EUR |
EUR |
|
Exchange Rate |
0.732493 |
0.684135 |
0.711921 |
|
Consolidated |
Yes |
Yes |
Yes |
|
|
|
|
|
|
Issued capital |
3,744.7 |
4,009.4 |
3,853.0 |
|
Capital reserves |
8,172.1 |
8,691.3 |
8,423.7 |
|
Total reserves |
31,396.9 |
33,101.7 |
32,291.5 |
|
Total
stockholders equity |
39,721.9 |
39,885.4 |
38,459.3 |
|
Minority interests |
1,023.9 |
936.9 |
851.2 |
|
Other provisions |
11,563.2 |
10,176.4 |
10,813.0 |
|
Provision for pensions |
11,555.1 |
8,679.6 |
6,125.7 |
|
Provisions and allowances |
23,906.0 |
19,990.2 |
17,958.5 |
|
Other debentures |
2,917.4 |
3,345.8 |
3,000.3 |
|
Mortgages and loans |
20,802.9 |
24,121.0 |
16,774.3 |
|
Taxes and social security |
4,256.7 |
3,163.1 |
3,836.1 |
|
Total long-term
liabilities |
27,977.0 |
30,629.9 |
23,610.8 |
|
Trade creditors |
10,757.8 |
11,098.7 |
12,445.2 |
|
Advances received |
16,628.1 |
16,124.0 |
15,999.0 |
|
Bank loans and overdrafts |
2,815.0 |
- |
1,438.4 |
|
Other loans |
416.4 |
954.5 |
1,045.1 |
|
Taxation and social security |
16,499.8 |
18,791.6 |
20,389.9 |
|
Due to group companies |
- |
127.2 |
141.9 |
|
Total current
liabilities |
47,117.1 |
47,096.0 |
51,459.4 |
|
Regularisation account |
1,657.4 |
1,151.8 |
1,199.6 |
|
Total
liabilities (including net worth) |
140,379.4 |
138,753.3 |
132,687.5 |
|
Patents |
6,783.7 |
7,346.5 |
7,603.4 |
|
Goodwill |
21,519.6 |
23,125.6 |
22,480.0 |
|
Intangibles |
28,303.3 |
30,472.1 |
30,083.4 |
|
Land and buildings |
6,168.0 |
6,652.2 |
6,111.6 |
|
Machinery and tools |
4,035.5 |
4,040.1 |
3,629.6 |
|
Fixtures and equipment |
6,168.0 |
6,652.2 |
6,111.6 |
|
Fixed assets under construction |
1,518.1 |
1,404.7 |
1,656.1 |
|
Total tangible
fixed assets |
13,773.5 |
14,323.2 |
13,601.2 |
|
Total financial
assets |
6,449.2 |
6,839.3 |
9,856.4 |
|
Other long-term assets |
2,264.9 |
2,227.6 |
2,212.3 |
|
Total
non-current assets |
50,790.9 |
53,862.2 |
55,753.4 |
|
Net stocks and work in progress |
19,512.8 |
19,826.5 |
19,264.8 |
|
Trade debtors |
18,726.4 |
19,142.4 |
20,413.8 |
|
Other receivables |
26,306.0 |
24,438.2 |
22,685.1 |
|
Total
receivables |
45,032.5 |
44,941.4 |
43,308.2 |
|
Owing from associated companies |
- |
1,360.8 |
209.3 |
|
Cash and liquid assets |
19,260.2 |
14,849.4 |
9,682.3 |
|
Shares in associated companies |
6,449.2 |
6,839.3 |
9,856.4 |
|
Recoverable taxation |
5,378.9 |
4,810.5 |
4,226.6 |
|
Total current
assets |
83,805.5 |
79,617.3 |
72,255.2 |
|
Prepaid expenses and deferred costs |
404.1 |
463.4 |
452.3 |
|
Total assets |
140,379.4 |
138,753.3 |
132,687.5 |
Annual
Ratios
Financials in: USD
(mil)
|
|
30-Sep-2010 |
30-Sep-2009 |
30-Sep-2008 |
|
Period Length |
12 Months |
12 Months |
12 Months |
|
Filed Currency |
EUR |
EUR |
EUR |
|
Exchange Rate |
0.732493 |
0.684135 |
0.711921 |
|
Consolidated |
Yes |
Yes |
Yes |
|
|
|
|
|
|
Current ratio |
17.79 |
16.91 |
14.04 |
|
Acid test ratio |
13.65 |
12.70 |
10.30 |
|
Total liabilities to net worth |
0.19% |
0.19% |
0.20% |
|
Net worth to total assets |
0.03% |
0.03% |
0.03% |
|
Current liabilities to net worth |
0.12% |
0.12% |
0.13% |
|
Current liabilities to stock |
0.24% |
0.24% |
0.27% |
|
Fixed assets to net worth |
0.13% |
0.14% |
0.15% |
|
Collection period |
661.00 |
624.00 |
686.00 |
|
Stock turnover rate |
1.88 |
1.77 |
1.77 |
|
Profit margin |
0.01% |
0.00% |
0.01% |
|
Return on assets |
0.01% |
0.00% |
0.01% |
|
Shareholders' return |
0.01% |
0.01% |
0.02% |
|
Sales per employee |
18.87 |
18.53 |
18.38 |
|
Profit per employee |
1.01 |
0.60 |
1.40 |
|
Net worth |
39,721.9 |
39,885.4 |
38,459.3 |
|
Number of employees |
402,700 |
413,650 |
420,800 |
Annual Income Statement
Financials in: USD (mil)
Except for share items (millions) and per share items (actual units)
|
|
30-Sep-2011 |
30-Sep-2010 |
30-Sep-2009 |
30-Sep-2008 |
30-Sep-2007 |
|
Period Length |
12 Months |
12 Months |
12 Months |
12 Months |
12 Months |
|
UpdateType/Date |
Updated Normal |
Restated Normal |
Reclassified
Normal |
Updated Normal |
Updated Normal |
|
Filed Currency |
EUR |
EUR |
EUR |
EUR |
EUR |
|
Exchange Rate
(Period Average) |
0.717768 |
0.740255 |
0.73971 |
0.666382 |
0.752073 |
|
Auditor |
Ernst &
Young LLP |
Ernst &
Young LLP |
Ernst &
Young LLP |
KPMG LLP |
KPMG LLP |
|
Auditor Opinion |
Unqualified |
Unqualified |
Unqualified |
Unqualified |
Unqualified |
|
|
|
|
|
|
|
|
Net Sales |
102,421.7 |
93,181.4 |
103,623.0 |
116,040.1 |
96,331.1 |
|
Revenue |
102,421.7 |
93,181.4 |
103,623.0 |
116,040.1 |
96,331.1 |
|
Total Revenue |
102,421.7 |
93,181.4 |
103,623.0 |
116,040.1 |
96,331.1 |
|
|
|
|
|
|
|
|
Cost of Revenue |
71,594.2 |
66,162.4 |
75,625.6 |
84,462.1 |
68,573.1 |
|
Cost of Revenue, Total |
71,594.2 |
66,162.4 |
75,625.6 |
84,462.1 |
68,573.1 |
|
Gross Profit |
30,827.5 |
27,019.1 |
27,997.5 |
31,578.0 |
27,757.9 |
|
|
|
|
|
|
|
|
Selling/General/Administrative Expense |
14,345.9 |
13,057.7 |
14,730.1 |
20,387.7 |
16,092.9 |
|
Total Selling/General/Administrative Expenses |
14,345.9 |
13,057.7 |
14,730.1 |
20,387.7 |
16,092.9 |
|
Research & Development |
5,468.3 |
4,806.5 |
5,272.3 |
5,678.4 |
4,519.5 |
|
Impairment-Assets Held for Use |
178.3 |
1,546.8 |
43.3 |
117.0 |
- |
|
Loss (Gain) on Sale of Assets - Operating |
-291.2 |
-352.6 |
-830.1 |
-900.4 |
-466.7 |
|
Unusual Expense (Income) |
-112.8 |
1,194.2 |
-786.8 |
-783.3 |
-466.7 |
|
Other Operating Expense |
426.3 |
339.1 |
607.0 |
2,984.8 |
1,222.0 |
|
Other, Net |
-387.3 |
-567.4 |
-405.6 |
-429.2 |
-259.3 |
|
Other Operating Expenses, Total |
39.0 |
-228.3 |
201.4 |
2,555.6 |
962.7 |
|
Total Operating Expense |
91,334.5 |
84,992.4 |
95,042.6 |
112,300.5 |
89,681.4 |
|
|
|
|
|
|
|
|
Operating Income |
11,087.1 |
8,189.1 |
8,580.4 |
3,739.6 |
6,649.6 |
|
|
|
|
|
|
|
|
Interest Expense -
Non-Operating |
-2,390.7 |
-2,376.2 |
-2,991.7 |
-1,251.5 |
-1,192.7 |
|
Interest Expense, Net Non-Operating |
-2,390.7 |
-2,376.2 |
-2,991.7 |
-1,251.5 |
-1,192.7 |
|
Interest Income -
Non-Operating |
3,074.8 |
2,762.6 |
2,887.6 |
1,341.6 |
1,007.9 |
|
Investment Income -
Non-Operating |
204.8 |
12.2 |
-2,630.8 |
390.2 |
143.6 |
|
Interest/Investment Income - Non-Operating |
3,279.6 |
2,774.7 |
256.9 |
1,731.7 |
1,151.5 |
|
Interest Income (Expense) - Net Non-Operating Total |
888.9 |
398.5 |
-2,734.9 |
480.2 |
-41.2 |
|
Other Non-Operating Income (Expense) |
900.0 |
-517.4 |
-585.4 |
93.0 |
174.2 |
|
Other, Net |
900.0 |
-517.4 |
-585.4 |
93.0 |
174.2 |
|
Income Before Tax |
12,876.0 |
8,070.2 |
5,260.2 |
4,312.8 |
6,782.6 |
|
|
|
|
|
|
|
|
Total Income Tax |
3,108.2 |
2,312.7 |
1,938.6 |
1,523.2 |
1,585.0 |
|
Income After Tax |
9,767.8 |
5,757.5 |
3,321.6 |
2,789.7 |
5,197.6 |
|
|
|
|
|
|
|
|
Minority Interest |
-245.2 |
-228.3 |
-277.1 |
-241.6 |
-308.5 |
|
Net Income Before Extraord Items |
9,522.6 |
5,529.2 |
3,044.4 |
2,548.1 |
4,889.2 |
|
Discontinued Operations |
-961.3 |
-262.1 |
54.1 |
6,043.1 |
171.5 |
|
Total Extraord Items |
-961.3 |
-262.1 |
54.1 |
6,043.1 |
171.5 |
|
Net Income |
8,561.3 |
5,267.1 |
3,098.5 |
8,591.2 |
5,060.7 |
|
|
|
|
|
|
|
|
Income Available to Common Excl Extraord Items |
9,522.6 |
5,529.2 |
3,044.4 |
2,548.1 |
4,889.2 |
|
|
|
|
|
|
|
|
Income Available to Common Incl Extraord Items |
8,561.3 |
5,267.1 |
3,098.5 |
8,591.2 |
5,060.7 |
|
|
|
|
|
|
|
|
Basic/Primary Weighted Average Shares |
873.1 |
868.2 |
864.8 |
893.2 |
898.1 |
|
Basic EPS Excl Extraord Items |
10.91 |
6.37 |
3.52 |
2.85 |
5.44 |
|
Basic/Primary EPS Incl Extraord Items |
9.81 |
6.07 |
3.58 |
9.62 |
5.63 |
|
Diluted Net Income |
8,561.3 |
5,267.1 |
3,098.5 |
8,591.2 |
5,060.7 |
|
Diluted Weighted Average Shares |
882.7 |
877.5 |
871.7 |
896.3 |
935.2 |
|
Diluted EPS Excl Extraord Items |
10.79 |
6.30 |
3.49 |
2.84 |
5.23 |
|
Diluted EPS Incl Extraord Items |
9.70 |
6.00 |
3.55 |
9.59 |
5.41 |
|
Dividends per Share - Common Stock Primary Issue |
4.18 |
3.65 |
2.16 |
2.40 |
2.13 |
|
Gross Dividends - Common Stock |
3,622.3 |
3,182.7 |
1,876.4 |
2,067.9 |
1,944.0 |
|
Interest Expense, Supplemental |
2,390.7 |
2,376.2 |
2,991.7 |
1,251.5 |
1,192.7 |
|
Depreciation, Supplemental |
2,367.1 |
2,437.0 |
2,714.6 |
3,179.9 |
2,832.2 |
|
Total Special Items |
54.3 |
1,444.1 |
-786.8 |
-783.3 |
-466.7 |
|
Normalized Income Before Tax |
12,930.4 |
9,514.3 |
4,473.4 |
3,529.5 |
6,315.9 |
|
|
|
|
|
|
|
|
Effect of Special Items on Income Taxes |
13.1 |
413.8 |
-290.0 |
-276.6 |
-109.1 |
|
Inc Tax Ex Impact of Sp Items |
3,121.4 |
2,726.6 |
1,648.6 |
1,246.5 |
1,475.9 |
|
Normalized Income After Tax |
9,809.0 |
6,787.7 |
2,824.7 |
2,283.0 |
4,840.0 |
|
|
|
|
|
|
|
|
Normalized Inc. Avail to Com. |
9,563.8 |
6,559.4 |
2,547.6 |
2,041.4 |
4,531.5 |
|
|
|
|
|
|
|
|
Basic Normalized EPS |
10.95 |
7.55 |
2.95 |
2.29 |
5.05 |
|
Diluted Normalized EPS |
10.84 |
7.48 |
2.92 |
2.28 |
4.85 |
|
Amort of Intangibles, Supplemental |
1,129.9 |
1,068.6 |
1,127.5 |
1,344.6 |
1,168.8 |
|
Rental Expenses |
1,469.8 |
1,454.9 |
1,619.6 |
1,431.6 |
1,163.5 |
|
Research & Development Exp, Supplemental |
5,468.3 |
4,806.5 |
5,272.3 |
5,678.4 |
4,519.5 |
|
Normalized EBIT |
11,141.5 |
9,633.2 |
7,793.6 |
2,956.3 |
6,182.9 |
|
Normalized EBITDA |
14,638.4 |
13,138.7 |
11,635.6 |
7,480.7 |
10,183.9 |
|
Current Tax - Domestic |
419.4 |
14.9 |
363.7 |
186.1 |
598.3 |
|
Current Tax - Foreign |
1,748.5 |
1,976.3 |
1,634.4 |
1,502.1 |
1,010.5 |
|
Current Tax - Total |
2,167.8 |
1,991.2 |
1,998.1 |
1,688.2 |
1,608.9 |
|
Deferred Tax - Domestic |
508.5 |
783.5 |
1.4 |
-318.1 |
-207.4 |
|
Deferred Tax - Foreign |
431.9 |
-462.0 |
-60.8 |
153.1 |
183.5 |
|
Deferred Tax - Total |
940.4 |
321.5 |
-59.5 |
-165.1 |
-23.9 |
|
Income Tax - Total |
3,108.2 |
2,312.7 |
1,938.6 |
1,523.2 |
1,585.0 |
|
Interest Cost - Domestic |
1,021.2 |
1,083.4 |
1,153.2 |
1,148.0 |
964.0 |
|
Service Cost - Domestic |
394.3 |
387.7 |
367.7 |
418.7 |
476.0 |
|
Prior Service Cost - Domestic |
27.9 |
0.0 |
23.0 |
0.0 |
- |
|
Expected Return on Assets - Domestic |
-1,180.0 |
-1,082.1 |
-1,046.4 |
-1,394.1 |
-1,259.2 |
|
Actuarial Gains and Losses - Domestic |
-353.9 |
2,620.7 |
1,209.9 |
1,416.6 |
-656.9 |
|
Curtailments & Settlements - Domestic |
0.0 |
0.0 |
-2.7 |
-39.0 |
0.0 |
|
Domestic Pension Plan Expense |
-90.6 |
3,009.8 |
1,704.7 |
1,550.2 |
-476.0 |
|
Interest Cost - Foreign |
635.3 |
663.3 |
701.6 |
721.8 |
675.5 |
|
Service Cost - Foreign |
206.2 |
262.1 |
242.0 |
348.1 |
433.5 |
|
Prior Service Cost - Foreign |
-11.1 |
27.0 |
-4.1 |
-1.5 |
- |
|
Expected Return on Assets - Foreign |
-720.3 |
-648.4 |
-643.5 |
-813.3 |
-752.6 |
|
Actuarial Gains and Losses - Foreign |
196.4 |
1,111.8 |
680.0 |
1,434.6 |
-1,260.5 |
|
Curtailments & Settlements - Foreign |
-11.1 |
-274.2 |
-48.7 |
-30.0 |
-5.3 |
|
Foreign Pension Plan Expense |
295.4 |
1,141.5 |
927.4 |
1,659.7 |
-909.5 |
|
Interest Cost - Post-Retirement |
50.2 |
55.4 |
55.4 |
57.0 |
55.8 |
|
Service Cost - Post-Retirement |
29.3 |
32.4 |
20.3 |
27.0 |
31.9 |
|
Prior Service Cost - Post-Retirement |
5.6 |
2.7 |
-40.6 |
12.0 |
13.3 |
|
Curtailments & Settlements - Post-Retir. |
-13.9 |
-6.8 |
-12.2 |
-4.5 |
0.0 |
|
Post-Retirement Plan Expense |
71.1 |
83.8 |
23.0 |
91.5 |
101.1 |
|
Defined Contribution Expense - Domestic |
608.8 |
451.2 |
516.4 |
471.2 |
357.7 |
|
Total Pension Expense |
884.7 |
4,686.2 |
3,171.5 |
3,772.6 |
-926.8 |
|
Discount Rate - Domestic |
4.70% |
4.00% |
5.30% |
6.40% |
5.10% |
|
Expected Rate of Return - Domestic |
6.50% |
6.50% |
6.50% |
6.50% |
- |
|
Compensation Rate - Domestic |
2.25% |
2.25% |
2.25% |
2.25% |
2.25% |
|
Total Plan Interest Cost |
1,706.7 |
1,802.1 |
1,910.2 |
1,926.8 |
1,695.3 |
|
Total Plan Service Cost |
629.7 |
682.2 |
630.0 |
793.8 |
941.4 |
|
Total Plan Expected Return |
-1,900.3 |
-1,730.5 |
-1,689.9 |
-2,207.4 |
-2,011.8 |
Annual
Balance Sheet
Financials in: USD (mil)
|
|
30-Sep-2011 |
30-Sep-2010 |
30-Sep-2009 |
30-Sep-2008 |
30-Sep-2007 |
|
UpdateType/Date |
Updated Normal |
Reclassified
Normal |
Reclassified
Normal |
Updated Normal |
Updated Normal |
|
Filed Currency |
EUR |
EUR |
EUR |
EUR |
EUR |
|
Exchange Rate |
0.745323 |
0.732493 |
0.684135 |
0.711921 |
0.703161 |
|
Auditor |
Ernst &
Young LLP |
Ernst &
Young LLP |
Ernst &
Young LLP |
KPMG LLP |
KPMG LLP |
|
Auditor Opinion |
Unqualified |
Unqualified |
Unqualified |
Unqualified |
Unqualified |
|
|
|
|
|
|
|
|
Cash & Equivalents |
16,728.3 |
19,260.2 |
14,849.4 |
9,682.3 |
5,695.7 |
|
Short Term Investments |
5,723.7 |
5,040.3 |
5,164.2 |
4,590.4 |
4,444.2 |
|
Cash and Short Term Investments |
22,452.0 |
24,300.6 |
20,013.6 |
14,272.6 |
10,139.9 |
|
Trade Accounts Receivable - Net |
17,560.2 |
18,726.4 |
18,579.7 |
22,172.4 |
20,791.8 |
|
Other Receivables |
2,052.8 |
2,015.0 |
1,797.9 |
856.8 |
566.0 |
|
Total Receivables, Net |
19,613.0 |
20,741.5 |
20,377.6 |
23,029.2 |
21,357.8 |
|
Inventories - Finished Goods |
3,108.7 |
3,912.7 |
4,304.7 |
3,982.2 |
3,637.9 |
|
Inventories - Work In Progress |
4,979.0 |
5,084.0 |
5,289.9 |
5,039.9 |
4,545.2 |
|
Inventories - Raw Materials |
3,555.5 |
3,303.8 |
3,331.2 |
3,642.3 |
3,130.2 |
|
Inventories - Other |
8,674.1 |
8,109.3 |
7,726.5 |
7,715.7 |
7,075.2 |
|
Total Inventory |
20,317.4 |
20,409.7 |
20,652.4 |
20,380.1 |
18,388.4 |
|
Prepaid Expenses |
335.4 |
404.1 |
463.4 |
452.3 |
490.6 |
|
Other Current Assets |
8,141.4 |
2,648.5 |
2,272.9 |
2,605.6 |
17,789.7 |
|
Other Current Assets, Total |
8,141.4 |
2,648.5 |
2,272.9 |
2,605.6 |
17,789.7 |
|
Total Current Assets |
70,859.2 |
68,504.4 |
63,779.8 |
60,739.9 |
68,166.5 |
|
|
|
|
|
|
|
|
Land/Improvements |
10,881.2 |
11,735.3 |
12,662.7 |
11,557.5 |
12,286.0 |
|
Machinery/Equipment |
20,255.6 |
26,248.7 |
26,030.0 |
24,631.9 |
23,670.3 |
|
Construction in
Progress |
1,257.2 |
1,520.8 |
1,407.6 |
1,657.5 |
1,271.4 |
|
Property/Plant/Equipment - Gross |
32,394.0 |
39,504.8 |
40,100.3 |
37,846.9 |
37,227.6 |
|
Accumulated Depreciation |
-18,337.0 |
-23,466.4 |
-23,549.4 |
-22,033.3 |
-22,216.8 |
|
Property/Plant/Equipment - Net |
14,057.0 |
16,038.4 |
16,550.8 |
15,813.5 |
15,010.8 |
|
Goodwill, Net |
21,072.7 |
21,519.6 |
23,125.6 |
22,480.0 |
17,778.3 |
|
Intangibles - Gross |
12,907.2 |
13,755.8 |
13,422.8 |
- |
- |
|
Accumulated Intangible Amortization |
-6,944.6 |
-6,972.1 |
-6,076.3 |
- |
- |
|
Intangibles, Net |
5,962.5 |
6,783.7 |
7,346.5 |
7,603.4 |
6,568.9 |
|
LT Investment - Affiliate Companies |
6,662.9 |
6,449.2 |
6,839.3 |
9,856.4 |
9,977.8 |
|
LT Investments - Other |
9,014.9 |
6,796.0 |
11,668.8 |
10,935.2 |
7,908.6 |
|
Long Term Investments |
15,677.8 |
13,245.2 |
18,508.0 |
20,791.6 |
17,886.4 |
|
Note Receivable - Long Term |
4,002.3 |
4,223.9 |
662.2 |
- |
- |
|
Deferred Income Tax - Long Term Asset |
4,301.5 |
5,378.9 |
4,810.5 |
4,226.6 |
3,689.1 |
|
Other Long Term Assets |
3,929.8 |
4,685.4 |
3,970.0 |
1,032.4 |
1,105.0 |
|
Other Long Term Assets, Total |
8,231.3 |
10,064.3 |
8,780.4 |
5,259.0 |
4,794.1 |
|
Total Assets |
139,862.8 |
140,379.4 |
138,753.3 |
132,687.5 |
130,204.9 |
|
|
|
|
|
|
|
|
Accounts Payable |
10,300.2 |
10,783.7 |
11,098.7 |
12,445.2 |
11,920.5 |
|
Accrued Expenses |
16,348.6 |
17,852.7 |
16,831.5 |
7,255.0 |
5,092.7 |
|
Notes Payable/Short Term Debt |
3,347.5 |
2,815.0 |
0.0 |
1,438.4 |
985.5 |
|
Current Portion - Long Term Debt/Capital Leases |
3,017.5 |
1,346.1 |
2,220.3 |
4,525.8 |
10,661.9 |
|
Customer Advances |
18,178.7 |
18,016.5 |
17,775.7 |
- |
- |
|
Income Taxes Payable |
2,726.3 |
2,479.2 |
2,829.9 |
2,767.2 |
3,044.8 |
|
Other Current Liabilities |
4,525.6 |
2,147.5 |
2,575.5 |
31,197.3 |
30,718.4 |
|
Other Current liabilities, Total |
25,430.6 |
22,643.2 |
23,181.1 |
33,964.4 |
33,763.3 |
|
Total Current Liabilities |
58,444.5 |
55,440.8 |
53,331.6 |
59,628.8 |
62,423.9 |
|
|
|
|
|
|
|
|
Long Term Debt |
20,092.0 |
25,046.0 |
28,498.8 |
20,302.8 |
14,268.4 |
|
Capital Lease Obligations |
173.1 |
166.6 |
217.8 |
255.6 |
338.5 |
|
Total Long Term Debt |
20,265.0 |
25,212.5 |
28,716.6 |
20,558.5 |
14,606.9 |
|
Total Debt |
26,630.1 |
29,373.6 |
30,936.9 |
26,522.6 |
26,254.3 |
|
|
|
|
|
|
|
|
Deferred Income Tax - LT Liability |
798.3 |
787.7 |
1,134.3 |
1,019.8 |
824.8 |
|
Deferred Income Tax |
798.3 |
787.7 |
1,134.3 |
1,019.8 |
824.8 |
|
Minority Interest |
839.9 |
1,023.9 |
936.9 |
851.2 |
897.4 |
|
Pension Benefits - Underfunded |
9,803.8 |
11,555.1 |
8,679.6 |
6,125.7 |
3,953.6 |
|
Other Long Term Liabilities |
7,407.5 |
7,661.5 |
7,005.9 |
6,895.4 |
6,261.7 |
|
Other Liabilities, Total |
17,211.3 |
19,216.6 |
15,685.5 |
13,021.1 |
10,215.3 |
|
Total Liabilities |
97,559.0 |
101,681.5 |
99,804.9 |
95,079.4 |
88,968.3 |
|
|
|
|
|
|
|
|
Common Stock |
3,680.3 |
3,744.7 |
4,009.4 |
3,853.0 |
3,901.0 |
|
Common Stock |
3,680.3 |
3,744.7 |
4,009.4 |
3,853.0 |
3,901.0 |
|
Additional Paid-In Capital |
8,065.0 |
8,172.1 |
8,691.3 |
8,423.7 |
8,646.7 |
|
Retained Earnings (Accumulated Deficit) |
34,724.5 |
31,396.9 |
33,101.7 |
32,291.5 |
29,087.2 |
|
Treasury Stock - Common |
-4,074.7 |
-4,604.8 |
-5,308.9 |
-5,621.4 |
0.0 |
|
Other Comprehensive Income |
-91.2 |
-10.9 |
-1,545.0 |
-1,338.6 |
-398.2 |
|
Other Equity, Total |
-91.2 |
-10.9 |
-1,545.0 |
-1,338.6 |
-398.2 |
|
Total Equity |
42,303.8 |
38,698.0 |
38,948.5 |
37,608.1 |
41,236.7 |
|
|
|
|
|
|
|
|
Total Liabilities & Shareholders’ Equity |
139,862.8 |
140,379.4 |
138,753.3 |
132,687.5 |
130,204.9 |
|
|
|
|
|
|
|
|
Shares Outstanding - Common Stock Primary
Issue |
874.3 |
869.8 |
866.4 |
861.6 |
914.2 |
|
Total Common Shares Outstanding |
874.3 |
869.8 |
866.4 |
861.6 |
914.2 |
|
Treasury Shares - Common Stock Primary Issue |
40.0 |
44.4 |
47.8 |
52.6 |
0.0 |
|
Employees |
360,000 |
336,000 |
405,000 |
427,000 |
398,000 |
|
Accumulated Intangible Amort, Suppl. |
6,944.6 |
6,972.1 |
6,076.3 |
5,061.0 |
4,478.4 |
|
Deferred Revenue - Current |
18,178.7 |
18,016.5 |
17,775.7 |
15,999.0 |
797.8 |
|
Deferred Revenue - Long Term |
318.0 |
374.1 |
283.6 |
- |
- |
|
Total Long Term Debt, Supplemental |
23,875.6 |
26,951.8 |
28,421.3 |
21,930.8 |
- |
|
Long Term Debt Maturing within 1 Year |
4,889.2 |
3,232.8 |
954.5 |
2,411.8 |
- |
|
Long Term Debt Maturing in Year 2 |
2,313.1 |
2,635.9 |
3,278.6 |
209.3 |
- |
|
Long Term Debt Maturing in Year 3 |
2,313.1 |
2,635.9 |
3,793.1 |
2,868.3 |
- |
|
Long Term Debt Maturing in Year 4 |
2,313.1 |
2,635.9 |
4,677.4 |
3,475.1 |
- |
|
Long Term Debt Maturing in Year 5 |
2,313.1 |
2,635.9 |
1,625.4 |
1,647.7 |
- |
|
Long Term Debt Maturing in 2-3 Years |
4,626.2 |
5,271.7 |
7,071.7 |
3,077.6 |
- |
|
Long Term Debt Maturing in 4-5 Years |
4,626.2 |
5,271.7 |
6,302.9 |
5,122.8 |
- |
|
Long Term Debt Matur. in Year 6 & Beyond |
9,734.0 |
13,175.5 |
14,092.2 |
11,318.7 |
- |
|
Total Capital Leases, Supplemental |
194.5 |
233.4 |
283.6 |
327.3 |
406.7 |
|
Capital Lease Payments Due in Year 1 |
21.5 |
66.9 |
65.8 |
71.6 |
68.3 |
|
Capital Lease Payments Due in Year 2 |
21.1 |
17.7 |
61.4 |
28.1 |
72.5 |
|
Capital Lease Payments Due in Year 3 |
21.1 |
17.7 |
19.0 |
37.9 |
28.4 |
|
Capital Lease Payments Due in Year 4 |
21.1 |
17.7 |
24.8 |
56.2 |
83.9 |
|
Capital Lease Payments Due in Year 5 |
21.1 |
17.7 |
7.3 |
23.9 |
11.4 |
|
Capital Lease Payments Due in 2-3 Years |
42.3 |
35.5 |
80.4 |
66.0 |
101.0 |
|
Capital Lease Payments Due in 4-5 Years |
42.3 |
35.5 |
32.2 |
80.1 |
95.3 |
|
Cap. Lease Pymts. Due in Year 6 & Beyond |
88.6 |
95.6 |
105.2 |
109.6 |
142.2 |
|
Total Operating Leases, Supplemental |
4,116.3 |
4,267.6 |
4,089.8 |
3,813.6 |
3,484.3 |
|
Operating Lease Payments Due in Year 1 |
960.7 |
984.3 |
1,011.5 |
886.3 |
826.3 |
|
Operating Lease Payments Due in Year 2 |
511.9 |
539.6 |
754.2 |
679.9 |
675.5 |
|
Operating Lease Payments Due in Year 3 |
511.9 |
539.6 |
552.5 |
507.1 |
514.8 |
|
Operating Lease Payments Due in Year 4 |
511.9 |
539.6 |
423.9 |
401.7 |
371.2 |
|
Operating Lease Payments Due in Year 5 |
511.9 |
539.6 |
350.8 |
368.0 |
312.9 |
|
Operating Lease Pymts. Due in 2-3 Years |
1,023.7 |
1,079.2 |
1,306.8 |
1,186.9 |
1,190.3 |
|
Operating Lease Pymts. Due in 4-5 Years |
1,023.7 |
1,079.2 |
774.7 |
769.7 |
684.1 |
|
Oper. Lse. Pymts. Due in Year 6 & Beyond |
1,108.2 |
1,124.9 |
996.9 |
970.6 |
783.6 |
|
Pension Obligation - Domestic |
36,388.2 |
42,969.7 |
36,774.9 |
31,820.9 |
35,627.7 |
|
Plan Assets - Domestic |
28,128.7 |
32,910.9 |
30,906.2 |
28,365.5 |
34,150.1 |
|
Funded Status - Domestic |
-8,259.5 |
-10,058.8 |
-5,868.7 |
-3,455.4 |
-1,477.6 |
|
Total Funded Status |
-8,259.5 |
-10,058.8 |
-5,868.7 |
-3,455.4 |
-1,477.6 |
|
Discount Rate - Domestic |
4.70% |
4.00% |
5.30% |
6.40% |
6.90% |
|
Expected Rate of Return - Domestic |
6.50% |
6.50% |
6.50% |
6.50% |
- |
|
Compensation Rate - Domestic |
2.25% |
2.25% |
2.25% |
2.25% |
2.25% |
|
Equity % - Domestic |
29.00% |
27.00% |
27.00% |
29.00% |
33.00% |
|
Equity % - Foreign |
27.00% |
28.00% |
29.00% |
29.00% |
- |
|
Real Estate % - Domestic |
6.00% |
6.00% |
8.00% |
8.00% |
8.00% |
|
Real Estate % - Foreign |
8.00% |
9.00% |
9.00% |
10.00% |
- |
|
Total Plan Obligations |
36,388.2 |
42,969.7 |
36,774.9 |
31,820.9 |
35,627.7 |
|
Total Plan Assets |
28,128.7 |
32,910.9 |
30,906.2 |
28,365.5 |
34,150.1 |
Annual Cash
Flows
Financials in: USD (mil)
|
|
30-Sep-2011 |
30-Sep-2010 |
30-Sep-2009 |
30-Sep-2008 |
30-Sep-2007 |
|
Period Length |
12 Months |
12 Months |
12 Months |
12 Months |
12 Months |
|
UpdateType/Date |
Updated Normal |
Reclassified
Normal |
Reclassified
Normal |
Updated Normal |
Updated Normal |
|
Filed Currency |
EUR |
EUR |
EUR |
EUR |
EUR |
|
Exchange Rate
(Period Average) |
0.717768 |
0.740255 |
0.73971 |
0.666382 |
0.752073 |
|
Auditor |
Ernst &
Young LLP |
Ernst &
Young LLP |
Ernst &
Young LLP |
KPMG LLP |
KPMG LLP |
|
Auditor Opinion |
Unqualified |
Unqualified |
Unqualified |
Unqualified |
Unqualified |
|
|
|
|
|
|
|
|
Net Income/Starting Line |
9,767.8 |
5,757.5 |
3,375.6 |
8,832.8 |
5,369.2 |
|
Depreciation |
3,675.3 |
5,056.4 |
3,881.2 |
4,821.6 |
4,987.5 |
|
Depreciation/Depletion |
3,675.3 |
5,056.4 |
3,881.2 |
4,821.6 |
4,987.5 |
|
Discontinued Operations |
-402.6 |
475.5 |
- |
- |
- |
|
Unusual Items |
-291.2 |
-352.6 |
-586.7 |
-7,641.3 |
-2,727.1 |
|
Other Non-Cash Items |
-1,978.4 |
-470.1 |
2,780.8 |
-90.0 |
17.3 |
|
Non-Cash Items |
-2,672.2 |
-347.2 |
2,194.1 |
-7,731.3 |
-2,709.8 |
|
Accounts Receivable |
-848.5 |
-71.6 |
1,492.5 |
-1,632.7 |
-1,573.0 |
|
Inventories |
-1,581.3 |
72.9 |
-83.8 |
-2,447.5 |
-1,311.0 |
|
Other Assets |
-1,407.1 |
-1,049.6 |
-486.7 |
250.6 |
-646.2 |
|
Accounts Payable |
930.7 |
-20.3 |
-1,446.5 |
1,079.0 |
1,539.7 |
|
Accrued Expenses |
78.0 |
744.3 |
-742.2 |
2,121.9 |
-343.1 |
|
Taxes Payable |
3,108.2 |
2,312.7 |
2,017.0 |
1,247.0 |
2,915.9 |
|
Other Liabilities |
1,042.1 |
1,346.8 |
-1,030.1 |
6,628.3 |
3,800.2 |
|
Other Assets & Liabilities, Net |
-487.6 |
-278.3 |
-482.6 |
300.1 |
-1,174.1 |
|
Other Operating Cash Flow |
-784.4 |
-894.3 |
-440.7 |
-528.2 |
-1,111.6 |
|
Changes in Working Capital |
50.2 |
2,162.8 |
-1,203.2 |
7,018.5 |
2,096.9 |
|
Cash from Operating Activities |
10,821.0 |
12,629.4 |
8,247.8 |
12,941.5 |
9,743.7 |
|
|
|
|
|
|
|
|
Purchase of Fixed Assets |
-3,024.7 |
-2,639.6 |
-3,325.6 |
-5,583.9 |
-4,987.5 |
|
Capital Expenditures |
-3,024.7 |
-2,639.6 |
-3,325.6 |
-5,583.9 |
-4,987.5 |
|
Acquisition of Business |
-418.0 |
-586.3 |
-281.2 |
-8,114.0 |
-9,799.6 |
|
Sale of Business |
246.6 |
232.4 |
-316.3 |
15,728.2 |
-505.3 |
|
Sale of Fixed Assets |
2,936.9 |
790.3 |
1,654.7 |
1,205.0 |
1,384.2 |
|
Sale/Maturity of Investment |
52.9 |
59.4 |
47.3 |
73.5 |
557.1 |
|
Purchase of Investments |
-1,380.7 |
-724.1 |
-1,384.3 |
-250.6 |
-543.8 |
|
Other Investing Cash Flow |
-4,047.3 |
-978.0 |
-669.2 |
-3,669.1 |
-1,206.0 |
|
Other Investing Cash Flow Items, Total |
-2,609.5 |
-1,206.3 |
-949.0 |
4,973.1 |
-10,113.4 |
|
Cash from Investing Activities |
-5,634.1 |
-3,846.0 |
-4,274.6 |
-610.8 |
-15,100.9 |
|
|
|
|
|
|
|
|
Other Financing Cash Flow |
-859.6 |
-857.8 |
-1,243.7 |
-1,451.1 |
-1,755.1 |
|
Financing Cash Flow Items |
-859.6 |
-857.8 |
-1,243.7 |
-1,451.1 |
-1,755.1 |
|
Cash Dividends Paid - Common |
-3,282.4 |
-1,875.0 |
-1,865.6 |
-2,193.9 |
-1,717.9 |
|
Total Cash Dividends Paid |
-3,282.4 |
-1,875.0 |
-1,865.6 |
-2,193.9 |
-1,717.9 |
|
Sale/Issuance of
Common |
-1,064.4 |
198.6 |
181.2 |
372.2 |
1,288.4 |
|
Repurchase/Retirement
of Common |
- |
- |
- |
-6,527.8 |
-134.3 |
|
Common Stock, Net |
-1,064.4 |
198.6 |
181.2 |
-6,155.6 |
1,154.1 |
|
Issuance (Retirement) of Stock, Net |
-1,064.4 |
198.6 |
181.2 |
-6,155.6 |
1,154.1 |
|
Short Term Debt, Net |
316.3 |
-979.4 |
-481.3 |
-6,955.5 |
5,831.9 |
|
Long Term Debt Issued |
157.4 |
0.0 |
5,371.0 |
8,595.7 |
1,018.5 |
|
Long Term Debt
Reduction |
-2,850.5 |
-60.8 |
-1,454.6 |
-1,036.9 |
-6,109.8 |
|
Long Term Debt, Net |
-2,693.1 |
-60.8 |
3,916.4 |
7,558.7 |
-5,091.3 |
|
Issuance (Retirement) of Debt, Net |
-2,376.8 |
-1,040.2 |
3,435.1 |
603.3 |
740.6 |
|
Cash from Financing Activities |
-7,583.2 |
-3,574.4 |
507.0 |
-9,197.4 |
-1,578.3 |
|
|
|
|
|
|
|
|
Foreign Exchange Effects |
7.0 |
225.6 |
-52.7 |
-148.6 |
-77.1 |
|
Net Change in Cash |
-2,389.4 |
5,434.6 |
4,427.4 |
2,984.8 |
-7,012.6 |
|
|
|
|
|
|
|
|
Net Cash - Beginning Balance |
19,821.2 |
13,784.4 |
9,367.2 |
7,413.2 |
13,581.1 |
|
Net Cash - Ending Balance |
17,431.8 |
19,219.1 |
13,794.6 |
10,397.9 |
6,568.5 |
|
Cash Interest Paid |
661.8 |
590.3 |
1,026.1 |
1,244.0 |
1,554.4 |
|
Cash Taxes Paid |
2,252.8 |
2,535.6 |
2,076.5 |
2,347.0 |
2,566.2 |
Annual Income
Statement
Financials in: USD (mil)
Except for share items (millions) and per share items (actual units)
|
|
30-Sep-2010 |
30-Sep-2009 |
30-Sep-2008 |
30-Sep-2007 |
30-Sep-2006 |
|
Period Length |
12 Months |
12 Months |
12 Months |
12 Months |
12 Months |
|
UpdateType/Date |
Updated Normal |
Reclassified
Normal |
Updated Normal |
Updated Normal |
Restated Normal |
|
Filed Currency |
EUR |
EUR |
EUR |
EUR |
EUR |
|
Exchange Rate
(Period Average) |
0.740255 |
0.73971 |
0.666382 |
0.752073 |
0.813439 |
|
Auditor |
Ernst &
Young LLP |
Ernst &
Young LLP |
KPMG LLP |
KPMG LLP |
KPMG LLP |
|
Auditor Opinion |
Unqualified |
Unqualified |
Unqualified |
Unqualified |
Unqualified |
|
|
|
|
|
|
|
|
Net Sales |
102,637.7 |
103,623.0 |
116,040.1 |
96,331.1 |
81,735.6 |
|
Total Revenue |
102,637.7 |
103,623.0 |
116,040.1 |
96,331.1 |
81,735.6 |
|
|
|
|
|
|
|
|
Cost of Sales |
73,395.0 |
75,625.6 |
84,462.1 |
68,573.1 |
60,370.8 |
|
Research/Development |
5,195.5 |
5,272.3 |
5,678.4 |
4,519.5 |
3,799.9 |
|
Distribution/Gen.
Admin. Expenses |
15,035.4 |
14,730.1 |
20,387.7 |
16,092.9 |
14,625.6 |
|
Other Operating
Income |
-587.6 |
-405.6 |
-429.2 |
-259.3 |
-773.3 |
|
Income from Sale
of Fixed Assets |
-387.7 |
-481.3 |
-471.2 |
-384.3 |
- |
|
Income From Sale
of Business Units |
-181.0 |
-552.9 |
-670.8 |
-260.6 |
- |
|
Other Operating
Expense |
406.6 |
607.0 |
2,984.8 |
1,222.0 |
319.6 |
|
Expense On Sale of
Business Units |
158.1 |
91.9 |
168.1 |
63.8 |
- |
|
Expense on Sale of
Fixed Assets |
64.8 |
112.2 |
73.5 |
114.4 |
- |
|
Goodwill
Impairment |
1,546.8 |
43.3 |
117.0 |
- |
- |
|
Total Operating Expense |
94,645.8 |
95,042.6 |
112,300.5 |
89,681.4 |
78,342.6 |
|
|
|
|
|
|
|
|
Income from
Investments |
-54.0 |
-2,630.8 |
390.2 |
143.6 |
496.7 |
|
Interest Income |
2,919.3 |
2,887.6 |
1,341.6 |
1,007.9 |
842.1 |
|
Interest Expense |
-2,553.2 |
-2,991.7 |
-1,251.5 |
-1,192.7 |
-645.4 |
|
Income from
Pensions |
- |
- |
204.1 |
260.6 |
276.6 |
|
Income from AFS
Financial Assets |
- |
- |
133.6 |
77.1 |
186.9 |
|
Other, Net |
-453.9 |
-585.4 |
-244.6 |
-163.5 |
-347.9 |
|
Net Income
Before Taxes |
7,850.0 |
5,260.2 |
4,312.8 |
6,782.6 |
4,201.9 |
|
|
|
|
|
|
|
|
Provision for Income Taxes |
2,295.2 |
1,938.6 |
1,523.2 |
1,585.0 |
954.0 |
|
Net Income After
Taxes |
5,554.8 |
3,321.6 |
2,789.7 |
5,197.6 |
3,247.9 |
|
|
|
|
|
|
|
|
Minority Interest |
-228.3 |
-277.1 |
-241.6 |
-308.5 |
-258.2 |
|
Net Income
Before Extra. Items |
5,326.5 |
3,044.4 |
2,548.1 |
4,889.2 |
2,989.8 |
|
Discontinued
Operations |
-59.4 |
54.1 |
6,043.1 |
171.5 |
864.2 |
|
Net Income |
5,267.1 |
3,098.5 |
8,591.2 |
5,060.7 |
3,854.0 |
|
|
|
|
|
|
|
|
Income Available
to Com Excl ExtraOrd |
5,326.5 |
3,044.4 |
2,548.1 |
4,889.2 |
2,989.8 |
|
|
|
|
|
|
|
|
Income Available
to Com Incl ExtraOrd |
5,267.1 |
3,098.5 |
8,591.2 |
5,060.7 |
3,854.0 |
|
|
|
|
|
|
|
|
Basic Weighted Average Shares |
868.2 |
864.8 |
893.2 |
898.1 |
874.8 |
|
Basic EPS Excluding ExtraOrdinary Items |
6.13 |
3.52 |
2.85 |
5.44 |
3.42 |
|
Basic EPS Including ExtraOrdinary Item |
6.07 |
3.58 |
9.62 |
5.63 |
4.41 |
|
Diluted Net Income |
5,267.1 |
3,098.5 |
8,591.2 |
5,060.7 |
3,854.0 |
|
Diluted Weighted Average Shares |
877.5 |
871.7 |
896.3 |
935.2 |
878.0 |
|
Diluted EPS Excluding ExtraOrd Items |
6.07 |
3.49 |
2.84 |
5.23 |
3.41 |
|
Diluted EPS Including ExtraOrd Items |
6.00 |
3.55 |
9.59 |
5.41 |
4.39 |
|
DPS-Common Stock |
3.65 |
2.16 |
2.40 |
2.13 |
1.78 |
|
Gross Dividends - Common Stock |
3,181.3 |
1,876.4 |
2,067.9 |
1,944.0 |
1,588.3 |
|
Normalized
Income Before Taxes |
9,050.9 |
4,473.4 |
3,529.5 |
6,315.9 |
4,201.9 |
|
|
|
|
|
|
|
|
Inc Tax Ex Impact of Sp Items |
2,646.3 |
1,648.6 |
1,246.5 |
1,475.9 |
954.0 |
|
Normalized
Income After Taxes |
6,404.7 |
2,824.7 |
2,283.0 |
4,840.0 |
3,247.9 |
|
|
|
|
|
|
|
|
Normalized Inc.
Avail to Com. |
6,176.4 |
2,547.6 |
2,041.4 |
4,531.5 |
2,989.8 |
|
|
|
|
|
|
|
|
Basic Normalized EPS |
7.11 |
2.95 |
2.29 |
5.05 |
3.42 |
|
Diluted Normalized EPS |
7.04 |
2.92 |
2.28 |
4.85 |
3.41 |
|
Research & Development Expenses |
5,195.5 |
5,272.3 |
5,678.4 |
4,519.5 |
3,799.9 |
|
Interest Expenses |
2,553.2 |
2,991.7 |
1,251.5 |
1,192.7 |
645.4 |
|
Amortisation of Intangibles |
1,159.1 |
1,127.5 |
1,344.6 |
1,168.8 |
972.4 |
|
Rental Expenses |
1,569.7 |
1,619.6 |
1,431.6 |
1,163.5 |
1,003.1 |
|
Depreciation |
2,858.5 |
2,714.6 |
3,179.9 |
2,832.2 |
2,756.2 |
|
Current - Domestic
Tax |
41.9 |
363.7 |
186.1 |
598.3 |
376.2 |
|
Current - Foreign
Tax |
2,112.8 |
1,634.4 |
1,502.1 |
1,010.5 |
736.4 |
|
Current Tax - Total |
2,154.7 |
1,998.1 |
1,688.2 |
1,608.9 |
1,112.6 |
|
Deferred -
Domestic Tax |
601.1 |
1.4 |
-318.1 |
-207.4 |
-163.5 |
|
Deferred - Foreign
Tax |
-460.7 |
-60.8 |
153.1 |
183.5 |
4.9 |
|
Deferred Tax - Total |
140.5 |
-59.5 |
-165.1 |
-23.9 |
-158.6 |
|
Income Tax - Total |
2,295.2 |
1,938.6 |
1,523.2 |
1,585.0 |
954.0 |
|
Service Cost |
409.3 |
367.7 |
418.7 |
476.0 |
- |
|
Interest Cost |
1,114.5 |
1,153.2 |
1,148.0 |
964.0 |
- |
|
Expected Return on Plan Assets |
-1,134.7 |
-1,046.4 |
-1,394.1 |
-1,259.2 |
- |
|
Past Service Cost |
0.0 |
23.0 |
0.0 |
- |
- |
|
Settlements and Curtailments |
-1.4 |
-2.7 |
-39.0 |
0.0 |
- |
|
Actuarial Gains and Losses |
2,578.8 |
1,209.9 |
1,416.6 |
-656.9 |
- |
|
Domestic Pension Plan Expense |
2,966.5 |
1,704.7 |
1,550.2 |
-476.0 |
- |
|
Service Cost |
251.3 |
242.0 |
348.1 |
433.5 |
- |
|
Interest Cost |
678.1 |
701.6 |
721.8 |
675.5 |
- |
|
Expected Return on Plan Assets |
-686.3 |
-643.5 |
-813.3 |
-752.6 |
- |
|
Settlements and Curtailments |
-245.9 |
-48.7 |
-30.0 |
-5.3 |
- |
|
Actuarial Gains and Losses |
921.3 |
680.0 |
1,434.6 |
-1,260.5 |
- |
|
Past Service Costs |
23.0 |
-4.1 |
-1.5 |
- |
- |
|
Foreign Pension Plan Expense |
941.6 |
927.4 |
1,659.7 |
-909.5 |
- |
|
Service Cost |
21.6 |
20.3 |
27.0 |
31.9 |
- |
|
Interest Cost |
50.0 |
55.4 |
57.0 |
55.8 |
- |
|
Settlements and Curtailments |
-9.5 |
-12.2 |
-4.5 |
0.0 |
- |
|
Past Service Costs |
1.4 |
-40.6 |
12.0 |
13.3 |
- |
|
Post-Retirement Plan Expense |
63.5 |
23.0 |
91.5 |
101.1 |
- |
|
Defined Contribution Plan |
475.5 |
516.4 |
471.2 |
357.7 |
- |
|
Total Pension Expense |
4,447.1 |
3,171.5 |
3,772.6 |
-926.8 |
- |
|
Discount Rate - Germany |
4.00% |
5.30% |
6.40% |
5.10% |
- |
|
Discount Rate - USA |
4.80% |
5.69% |
6.79% |
- |
- |
|
Discount Rate - Great Britain |
5.30% |
5.70% |
6.50% |
- |
- |
|
Expected Return on Plan Assets - Germany |
6.50% |
6.50% |
6.50% |
- |
- |
|
Expected Return on Plan Assets - USA |
6.95% |
6.97% |
6.97% |
- |
- |
|
Expected Return on Plan Assets - GB |
6.00% |
6.50% |
6.70% |
- |
- |
|
Compensation Rate - Germany |
2.25% |
2.25% |
2.25% |
2.25% |
- |
|
Compensation Rate - USA |
3.52% |
3.76% |
4.05% |
- |
- |
|
Compensation Rate - GB |
5.00% |
4.90% |
4.50% |
- |
- |
|
Compensation Rate - Switzerland |
1.50% |
1.50% |
2.50% |
- |
- |
|
Compensation Rate - Netherlands |
2.95% |
2.95% |
2.95% |
- |
- |
Annual Balance Sheet
Financials in: USD (mil)
|
|
30-Sep-2010 |
30-Sep-2009 |
30-Sep-2008 |
30-Sep-2007 |
30-Sep-2006 |
|
UpdateType/Date |
Updated Normal |
Reclassified
Normal |
Updated Normal |
Updated Normal |
Restated Normal |
|
Filed Currency |
EUR |
EUR |
EUR |
EUR |
EUR |
|
Exchange Rate |
0.732493 |
0.684135 |
0.711921 |
0.703161 |
0.789422 |
|
Auditor |
Ernst &
Young LLP |
Ernst &
Young LLP |
KPMG LLP |
KPMG LLP |
KPMG LLP |
|
Auditor Opinion |
Unqualified |
Unqualified |
Unqualified |
Unqualified |
Unqualified |
|
|
|
|
|
|
|
|
Cash/Equivalents |
19,260.2 |
14,849.4 |
9,682.3 |
5,695.7 |
12,938.6 |
|
ST Investments |
335.8 |
248.5 |
213.5 |
274.5 |
755.0 |
|
Trade Receivables |
18,001.5 |
18,579.7 |
22,172.4 |
20,791.8 |
19,188.7 |
|
Finance Lease |
2,436.9 |
2,540.4 |
- |
- |
- |
|
Derivatives |
1,295.6 |
1,143.0 |
- |
- |
- |
|
Other Financial
Assets |
2,267.6 |
2,375.3 |
4,376.9 |
4,169.7 |
3,002.2 |
|
Raw Materials |
3,303.8 |
3,331.2 |
3,642.3 |
3,130.2 |
3,305.0 |
|
Work in Progress |
5,084.0 |
5,289.9 |
5,039.9 |
4,545.2 |
3,768.6 |
|
Excess Earnings |
10,290.9 |
10,432.2 |
10,586.8 |
10,095.8 |
8,974.9 |
|
Finished Goods |
3,912.7 |
4,304.7 |
3,982.2 |
3,637.9 |
3,222.6 |
|
Advance-Supplier |
896.9 |
825.9 |
1,115.3 |
1,068.0 |
844.9 |
|
Adv. - Rcvd. |
-3,078.5 |
-3,531.5 |
-3,986.4 |
-4,088.7 |
-3,914.3 |
|
Income Tax
Receivables |
1,078.5 |
894.6 |
856.8 |
566.0 |
580.2 |
|
Other Receivables |
936.5 |
903.3 |
- |
- |
- |
|
Prepaid Expeneses |
404.1 |
463.4 |
- |
- |
- |
|
Other Current
Assets |
376.8 |
374.2 |
1,469.3 |
1,389.4 |
1,273.1 |
|
Prepaid Expenses |
- |
- |
452.3 |
490.6 |
340.8 |
|
Assets for Sale |
976.1 |
755.7 |
1,136.4 |
16,400.2 |
9,075.0 |
|
Total Current
Assets |
67,779.4 |
63,779.8 |
60,739.9 |
68,166.5 |
63,355.2 |
|
|
|
|
|
|
|
|
Investments Using
Equity Method |
6,449.2 |
6,839.3 |
9,856.4 |
9,977.8 |
3,744.5 |
|
Goodwill,
Net |
21,519.6 |
23,125.6 |
22,480.0 |
17,778.3 |
12,273.5 |
|
Derivatives |
3,676.5 |
3,053.5 |
- |
- |
- |
|
Receivables |
724.9 |
662.2 |
- |
- |
- |
|
Other Financial
Assets |
11,019.9 |
11,668.8 |
10,935.2 |
7,908.6 |
6,387.0 |
|
Amortization |
-6,972.1 |
-6,076.3 |
- |
- |
- |
|
Intangible
Assets, Net |
13,755.8 |
13,422.8 |
7,603.4 |
6,568.9 |
4,287.9 |
|
Land/Buildings |
11,735.3 |
12,662.7 |
11,557.5 |
12,286.0 |
12,414.2 |
|
Equip./Mach. |
12,634.9 |
12,627.6 |
11,591.2 |
11,213.7 |
12,388.8 |
|
Office Equipment |
9,279.3 |
9,489.4 |
9,346.5 |
9,585.3 |
10,648.3 |
|
Leased Equipment |
4,334.5 |
3,913.0 |
3,694.2 |
2,871.3 |
2,044.5 |
|
Constr. in Prog. |
1,520.8 |
1,407.6 |
1,657.5 |
1,271.4 |
1,393.4 |
|
Depreciation |
-23,466.4 |
-23,549.4 |
-22,033.3 |
-22,216.8 |
-23,597.0 |
|
Deferred Taxes |
5,378.9 |
4,810.5 |
4,226.6 |
3,689.1 |
4,632.5 |
|
Other Assets |
1,008.9 |
916.5 |
1,032.4 |
1,105.0 |
903.2 |
|
Total Assets |
140,379.4 |
138,753.3 |
132,687.5 |
130,204.9 |
110,876.1 |
|
|
|
|
|
|
|
|
Notes/Bonds |
2,815.0 |
0.0 |
1,438.4 |
985.5 |
1,455.5 |
|
Bank Loans |
386.4 |
381.5 |
672.8 |
679.8 |
834.8 |
|
Other Loans |
30.0 |
573.0 |
372.2 |
6,283.1 |
397.8 |
|
Lease Oblig. |
66.9 |
65.8 |
71.6 |
68.3 |
67.1 |
|
Accounts Payable |
10,757.8 |
11,098.7 |
12,445.2 |
11,920.5 |
10,695.2 |
|
Derivatives |
603.4 |
663.6 |
- |
- |
- |
|
Accrued Expenses |
446.4 |
475.1 |
- |
- |
- |
|
Other Current
Financial Liabilities |
862.8 |
1,200.1 |
3,409.1 |
3,630.7 |
2,443.6 |
|
Accrued Liabs. |
7,014.4 |
6,126.0 |
7,255.0 |
5,092.7 |
4,888.4 |
|
Income Tax
Payables |
2,479.2 |
2,829.9 |
2,767.2 |
3,044.8 |
2,004.0 |
|
Deferred Income |
- |
- |
- |
- |
499.1 |
|
Acc. Expenses |
10,391.9 |
10,230.4 |
- |
- |
- |
|
Customer Advances |
18,016.5 |
17,775.7 |
- |
- |
- |
|
Other Liabilities |
1,344.7 |
1,682.4 |
30,402.2 |
24,259.0 |
19,250.8 |
|
Assets Held for
Disposal |
199.3 |
229.5 |
795.0 |
6,459.4 |
6,821.4 |
|
Total Current
Liabilities |
55,414.8 |
53,331.6 |
59,628.8 |
62,423.9 |
49,357.6 |
|
|
|
|
|
|
|
|
Bonds/Notes |
20,802.9 |
24,121.0 |
16,774.3 |
11,655.9 |
15,211.1 |
|
Bank Loans |
2,704.5 |
2,791.8 |
2,607.0 |
1,238.7 |
433.2 |
|
Other Loans |
213.0 |
554.0 |
393.3 |
789.3 |
643.5 |
|
Lease Oblig. |
166.6 |
217.8 |
255.6 |
338.5 |
334.4 |
|
Other Financial
Liabilities |
1,351.5 |
1,032.0 |
528.1 |
584.5 |
314.2 |
|
Total Long Term
Debt |
25,238.5 |
28,716.6 |
20,558.5 |
14,606.9 |
16,936.4 |
|
|
|
|
|
|
|
|
Pensions/Similar |
11,555.1 |
8,679.6 |
6,125.7 |
3,953.6 |
6,438.9 |
|
Deferred Taxes |
787.7 |
1,134.3 |
1,019.8 |
824.8 |
233.1 |
|
Other Accrued |
4,548.8 |
4,050.4 |
3,558.0 |
2,990.8 |
2,353.6 |
|
Minority Int. |
1,023.9 |
936.9 |
851.2 |
897.4 |
889.3 |
|
Other Liabilities |
3,112.7 |
2,955.6 |
3,337.4 |
3,270.9 |
2,753.9 |
|
Total
Liabilities |
101,681.5 |
99,804.9 |
95,079.4 |
88,968.3 |
78,962.9 |
|
|
|
|
|
|
|
|
Common Stock |
3,744.7 |
4,009.4 |
3,853.0 |
3,901.0 |
3,386.0 |
|
Paid in Capital |
8,172.1 |
8,691.3 |
8,423.7 |
8,646.7 |
7,172.3 |
|
Retained Earnings |
31,396.9 |
33,101.7 |
32,291.5 |
29,087.2 |
21,157.3 |
|
Other Income |
-10.9 |
-1,545.0 |
-1,338.6 |
-398.2 |
197.6 |
|
Treasury Stock |
-4,604.8 |
-5,308.9 |
-5,621.4 |
0.0 |
- |
|
Total Equity |
38,698.0 |
38,948.5 |
37,608.1 |
41,236.7 |
31,913.2 |
|
|
|
|
|
|
|
|
Total
Liabilities & Shareholders' Equity |
140,379.4 |
138,753.3 |
132,687.5 |
130,204.9 |
110,876.1 |
|
|
|
|
|
|
|
|
S/O-Common Stock |
869.8 |
866.4 |
861.6 |
914.2 |
891.1 |
|
Total Common
Shares Outstanding |
869.8 |
866.4 |
861.6 |
914.2 |
891.1 |
|
T/S-Common Stock |
44.4 |
47.8 |
52.6 |
0.0 |
0.0 |
|
Deferred Revenue - Current |
18,016.5 |
17,775.7 |
15,999.0 |
797.8 |
499.1 |
|
Deferred Revenue - Long Term |
374.1 |
283.6 |
- |
- |
- |
|
Accu. Amortisation of Intangibles |
6,972.1 |
6,076.3 |
5,061.0 |
4,478.4 |
3,810.4 |
|
Full-Time Employees |
405,000 |
405,000 |
427,000 |
398,000 |
371,000 |
|
Long Term Debt Maturing Within 1 Year |
3,232.8 |
954.5 |
2,411.8 |
- |
- |
|
Long Term Debt Maturing Within 2 Years |
3,631.4 |
3,278.6 |
209.3 |
- |
- |
|
Long Term Debt Maturing Within 3 Years |
4,458.7 |
3,793.1 |
2,868.3 |
- |
- |
|
Long Term Debt Maturing Within 4 Years |
1,512.6 |
4,677.4 |
3,475.1 |
- |
- |
|
Long Term Debt Maturing Within 5 Years |
940.6 |
1,625.4 |
1,647.7 |
- |
- |
|
Long Term Debt Maturing Thereafter |
13,175.5 |
14,092.2 |
11,318.7 |
- |
- |
|
Total Long Term Debt, Supplemental |
26,951.8 |
28,421.3 |
21,930.8 |
- |
- |
|
Capital Lease Maturing Within 1 Year |
66.9 |
65.8 |
71.6 |
68.3 |
- |
|
Capital Lease Maturing Within 2 Years |
24.6 |
61.4 |
28.1 |
72.5 |
- |
|
Capital Lease Maturing Within 3 Years |
32.8 |
19.0 |
37.9 |
28.4 |
- |
|
Capital Lease Maturing Within 4 Years |
6.8 |
24.8 |
56.2 |
83.9 |
- |
|
Capital Lease Maturing Within 5 Years |
6.8 |
7.3 |
23.9 |
11.4 |
- |
|
Capital Lease Maturing Thereafter |
95.6 |
105.2 |
109.6 |
142.2 |
- |
|
Total Capital Leases |
233.4 |
283.6 |
327.3 |
406.7 |
- |
|
Operating Lease Maturing Within 1 Year |
984.3 |
1,011.5 |
886.3 |
826.3 |
- |
|
Operating Lease Maturing Within 2 Years |
753.6 |
754.2 |
679.9 |
675.5 |
- |
|
Operating Lease Maturing Within 3 Years |
569.3 |
552.5 |
507.1 |
514.8 |
- |
|
Operating Lease Maturing Within 4 Years |
451.9 |
423.9 |
401.7 |
371.2 |
- |
|
Operating Lease Maturing Within 5 Years |
383.6 |
350.8 |
368.0 |
312.9 |
- |
|
Operating Lease Maturing Thereafter |
1,124.9 |
996.9 |
970.6 |
783.6 |
- |
|
Total Operating Leases |
4,267.6 |
4,089.8 |
3,813.6 |
3,484.3 |
- |
|
Pension Obligation |
40,490.5 |
36,774.9 |
31,820.9 |
35,627.7 |
- |
|
Fair Value of Plan Assets |
31,811.9 |
30,906.2 |
28,365.5 |
34,150.1 |
- |
|
Funded Status |
-8,678.6 |
-5,868.7 |
-3,455.4 |
-1,477.6 |
- |
|
Total Funded Status |
-8,678.6 |
-5,868.7 |
-3,455.4 |
-1,477.6 |
- |
|
Discount Rate - Germany |
4.00% |
5.30% |
6.40% |
6.90% |
- |
|
Discount Rate - USA |
4.80% |
5.69% |
6.79% |
- |
- |
|
Discount Rate - Great Britain |
5.30% |
5.70% |
6.50% |
- |
- |
|
Compensation Rate - Germany |
2.25% |
2.25% |
2.25% |
2.25% |
- |
|
Compensation Rate - USA |
3.52% |
3.76% |
4.05% |
- |
- |
|
Compensation Rate - GB |
5.00% |
4.90% |
4.50% |
- |
- |
|
Compensation Rate - Switzerland |
1.50% |
1.50% |
2.50% |
- |
- |
|
Compensation Rate - Netherlands |
2.95% |
2.95% |
2.95% |
- |
- |
|
Expected Rate of Return - Germany |
6.50% |
6.50% |
6.50% |
- |
- |
|
Expected Rate of Return - USA |
6.95% |
6.97% |
6.97% |
- |
- |
|
Expected Rate of Return - Great Britain |
6.00% |
6.50% |
6.70% |
- |
- |
|
Equity Securities - Domestic |
27.00% |
27.00% |
29.00% |
33.00% |
- |
|
Equity Securities - Foreign |
28.00% |
29.00% |
29.00% |
- |
- |
|
Fixed Income - Domestic |
62.00% |
62.00% |
62.00% |
54.00% |
- |
|
Fixed Income - Foreign |
61.00% |
59.00% |
61.00% |
- |
- |
|
Real Estate - Domestic |
6.00% |
8.00% |
8.00% |
8.00% |
- |
|
Real Estate - Foreign |
9.00% |
9.00% |
10.00% |
- |
- |
|
Cash & Other - Domestic |
5.00% |
3.00% |
1.00% |
5.00% |
- |
|
Cash & Other - Foreign |
2.00% |
3.00% |
0.00% |
- |
- |
Annual
Cash Flows
Financials in: USD (mil)
|
|
30-Sep-2010 |
30-Sep-2009 |
30-Sep-2008 |
30-Sep-2007 |
30-Sep-2006 |
|
Period Length |
12 Months |
12 Months |
12 Months |
12 Months |
12 Months |
|
UpdateType/Date |
Updated Normal |
Reclassified
Normal |
Updated Normal |
Updated Normal |
Reclassified
Normal |
|
Filed Currency |
EUR |
EUR |
EUR |
EUR |
EUR |
|
Exchange Rate
(Period Average) |
0.740255 |
0.73971 |
0.666382 |
0.752073 |
0.813439 |
|
Auditor |
Ernst &
Young LLP |
Ernst &
Young LLP |
KPMG LLP |
KPMG LLP |
KPMG LLP |
|
Auditor Opinion |
Unqualified |
Unqualified |
Unqualified |
Unqualified |
Unqualified |
|
|
|
|
|
|
|
|
Net Income |
5,495.4 |
3,375.6 |
8,832.8 |
5,369.2 |
4,112.2 |
|
Depreciation |
5,563.0 |
3,881.2 |
4,821.6 |
4,987.5 |
3,833.1 |
|
Income Taxes |
2,280.3 |
2,017.0 |
1,247.0 |
2,915.9 |
952.7 |
|
Net Interest |
-366.1 |
93.3 |
-112.5 |
256.6 |
-174.6 |
|
Gain on Asset Sale |
-413.4 |
-586.7 |
-7,641.3 |
-2,727.1 |
-138.9 |
|
Gain on
Investments |
-97.3 |
-474.5 |
-52.5 |
-126.3 |
-127.9 |
|
Gain on Securities |
17.6 |
14.9 |
-7.5 |
42.5 |
-572.9 |
|
Investment Income |
79.7 |
2,668.6 |
-492.2 |
-296.5 |
-699.5 |
|
Other Non-Cash
Items |
-79.7 |
478.6 |
574.7 |
140.9 |
457.3 |
|
Inventories |
-101.3 |
-83.8 |
-2,447.5 |
-1,311.0 |
-2,843.5 |
|
Accounts
Receivable |
-68.9 |
1,492.5 |
-1,632.7 |
-1,573.0 |
-1,262.5 |
|
Other Current
Assets |
-278.3 |
139.2 |
250.6 |
-646.2 |
703.2 |
|
Accounts Payable |
151.3 |
-1,446.5 |
1,079.0 |
1,539.7 |
343.0 |
|
Accrued
Liabilities |
849.7 |
-742.2 |
2,121.9 |
-343.1 |
-41.8 |
|
Other Current
Liabs. |
1,765.6 |
-1,030.1 |
6,628.3 |
3,800.2 |
2,523.9 |
|
Other
Assets/Liabs. |
-347.2 |
-482.6 |
300.1 |
-1,174.1 |
50.4 |
|
Income Taxes Paid |
-2,635.6 |
-2,076.5 |
-2,347.0 |
-2,566.2 |
-1,464.2 |
|
Dividends Received |
726.8 |
596.2 |
505.7 |
448.1 |
464.7 |
|
Interest Received |
929.4 |
1,039.6 |
1,313.1 |
1,006.6 |
842.1 |
|
Assets |
-841.6 |
-625.9 |
- |
- |
- |
|
Cash from
Operating Activities |
12,629.4 |
8,247.8 |
12,941.5 |
9,743.7 |
6,956.9 |
|
|
|
|
|
|
|
|
Capital
Expenditures |
-3,155.7 |
-3,325.6 |
-5,583.9 |
-4,987.5 |
-4,981.3 |
|
Acquisitions |
-655.2 |
-281.2 |
-8,114.0 |
-9,799.6 |
-2,526.3 |
|
Purch. Investments |
-570.1 |
-1,314.0 |
-226.6 |
-347.0 |
-478.2 |
|
Purchase Secs. |
-186.4 |
-70.3 |
-24.0 |
-196.8 |
-1,830.5 |
|
Receivables from
Financing |
-259.4 |
-669.2 |
-3,669.1 |
-1,206.0 |
-576.6 |
|
Sale of Assets |
795.7 |
1,654.7 |
1,205.0 |
1,384.2 |
1,123.6 |
|
Sale of Businesses |
125.6 |
-316.3 |
15,728.2 |
-505.3 |
-319.6 |
|
Sale of Securities |
59.4 |
47.3 |
73.5 |
557.1 |
3,815.9 |
|
Cash from
Investing Activities |
-3,846.0 |
-4,274.6 |
-610.8 |
-15,100.9 |
-5,773.0 |
|
|
|
|
|
|
|
|
Issuance of Common |
- |
- |
0.0 |
1,200.7 |
0.0 |
|
Repurchase of
Stock |
- |
- |
-6,527.8 |
-134.3 |
-517.6 |
|
Issue of Treasury |
198.6 |
181.2 |
372.2 |
87.8 |
384.8 |
|
Issuance of Debt |
0.0 |
5,371.0 |
8,595.7 |
1,018.5 |
8,237.9 |
|
Repayment of Debt |
-60.8 |
-1,454.6 |
-1,036.9 |
-6,109.8 |
-2,102.2 |
|
S/T Debt Changes |
-974.0 |
-481.3 |
-6,955.5 |
5,831.9 |
-2,166.1 |
|
Interest Paid |
-594.4 |
-1,026.1 |
-1,244.0 |
-1,554.4 |
-732.7 |
|
Dividends Paid |
-1,875.0 |
-1,865.6 |
-2,193.9 |
-1,717.9 |
-1,476.4 |
|
Minority Dividends |
-268.8 |
-217.7 |
-207.1 |
-200.8 |
-145.1 |
|
Cash from
Financing Activities |
-3,574.4 |
507.0 |
-9,197.4 |
-1,578.3 |
1,482.6 |
|
Foreign Exchange Effects |
225.6 |
-52.7 |
-148.6 |
-77.1 |
-93.4 |
|
Net Change in
Cash |
5,434.6 |
4,427.4 |
2,984.8 |
-7,012.6 |
2,573.0 |
|
|
|
|
|
|
|
|
Net Cash - Beginning Balance |
13,784.4 |
9,367.2 |
7,413.2 |
13,581.1 |
9,983.5 |
|
Net Cash - Ending Balance |
19,219.1 |
13,794.6 |
10,397.9 |
6,568.5 |
12,556.6 |
|
Cash Interest Paid |
594.4 |
1,026.1 |
1,244.0 |
1,554.4 |
732.7 |
|
Cash Taxes Paid |
2,635.6 |
2,076.5 |
2,347.0 |
2,566.2 |
1,464.2 |
Financial
Health
Financials in: USD (mil)
Except for share items (millions) and per share items (actual units)
|
|||||||||||||||||||||||||||||||||||||||||||||||||||||||||||||||||||||||||||||||||||||||||||||||||||||||||||||||||||||||||||||||
|
|||||||||||||||||||||||||||||||||||||||||||||||||||||||||||||||||||||||||||||||||||||||||||||||||||||||||||||||||||||||||||||||
|
|||||||||||||||||||||||||||||||||||||||||||||||||||||||||||||||||||||||||||||||||||||||||||||||||||||||||||||||||||||||||||||||
Ratio
Comparisons
|
|
|
|||||||||||||||||||||||||||||||||||||||||||||||||||||||||||||||||||||||||||||||||||||||||||||||||||||||||||||||||||||||||||||||||||||||||||||||||||||||||||||||||||||||||||||||||||||||||||||||||||||||||||||||||||||||||||||||||||||||||||||||||||||||||||||||||||||||||||||||||||||||||||||||||||||||||||||||||||||||
|
||||||||||||||||||||||||||||||||||||||||||||||||||||||||||||||||||||||||||||||||||||||||||||||||||||||||||||||||||||||||||||||||||||||||||||||||||||||||||||||||||||||||||||||||||||||||||||||||||||||||||||||||||||||||||||||||||||||||||||||||||||||||||||||||||||||||||||||||||||||||||||||||||||||||||||||||||||||||
Annual
Ratios
Financials in: USD (mil)
Except for share items (millions) and per share items (actual units)
|
|
|||||||||||||||||||||||||||||||||||||||||||||||||||||||||||||||||||||||||||||||||||||||||||||||||||||||||||||||||||||||||||||||||||||||||||||||||||||||||||||||||||||||||||||||||||||||||||||||||||||||||||||||||||||||||||||||||||||||||||||||||||||||||||||||||||
|
|||||||||||||||||||||||||||||||||||||||||||||||||||||||||||||||||||||||||||||||||||||||||||||||||||||||||||||||||||||||||||||||||||||||||||||||||||||||||||||||||||||||||||||||||||||||||||||||||||||||||||||||||||||||||||||||||||||||||||||||||||||||||||||||||||
|
|||||||||||||||||||||||||||||||||||||||||||||||||||||||||||||||||||||||||||||||||||||||||||||||||||||||||||||||||||||||||||||||||||||||||||||||||||||||||||||||||||||||||||||||||||||||||||||||||||||||||||||||||||||||||||||||||||||||||||||||||||||||||||||||||||
Stock Snapshot
|
|||||||||||||||||||||||||||||||||||||||||||||||||||||||||||||||
|
|
|||||||||||||||||||||||||||||||||||||||||||||||||||||||||||||||
|
|||||||||||||||||||||||||||||||||||||||||||||||||||||||||||||||
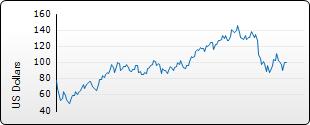
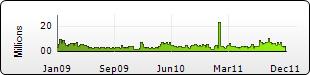
|
|
||||||||||||||||||||||||||||||||||||||||||||||||||||||||||||||||||||||||||||||||||||||||||||||||||||||||||
|
||||||||||||||||||||||||||||||||||||||||||||||||||||||||||||||||||||||||||||||||||||||||||||||||||||||||||
|
||||||||||||||||||||||||||||||||||||||||||||||||||||||||||||||||||||||||||||||||||||||||||||||||||||||||||
Annual Income
Statement
Standardized
Financials in: USD (mil)
Except for share items (millions) and per share items (actual units)
|
|
|
|
30-Sep-2011 |
30-Sep-2010 |
30-Sep-2009 |
30-Sep-2008 |
30-Sep-2007 |
|
Period Length |
12 Months |
12 Months |
12 Months |
12 Months |
12 Months |
|
UpdateType/Date |
Updated Normal |
Restated Normal |
Reclassified
Normal |
Updated Normal |
Updated Normal |
|
Filed Currency |
EUR |
EUR |
EUR |
EUR |
EUR |
|
Exchange Rate
(Period Average) |
0.717768 |
0.740255 |
0.73971 |
0.666382 |
0.752073 |
|
Auditor |
Ernst &
Young LLP |
Ernst &
Young LLP |
Ernst &
Young LLP |
KPMG LLP |
KPMG LLP |
|
Auditor Opinion |
Unqualified |
Unqualified |
Unqualified |
Unqualified |
Unqualified |
|
|
|
|
|
|
|
|
Net Sales |
102,421.7 |
93,181.4 |
103,623.0 |
116,040.1 |
96,331.1 |
|
Revenue |
102,421.7 |
93,181.4 |
103,623.0 |
116,040.1 |
96,331.1 |
|
Total Revenue |
102,421.7 |
93,181.4 |
103,623.0 |
116,040.1 |
96,331.1 |
|
|
|
|
|
|
|
|
Cost of Revenue |
71,594.2 |
66,162.4 |
75,625.6 |
84,462.1 |
68,573.1 |
|
Cost of Revenue, Total |
71,594.2 |
66,162.4 |
75,625.6 |
84,462.1 |
68,573.1 |
|
Gross Profit |
30,827.5 |
27,019.1 |
27,997.5 |
31,578.0 |
27,757.9 |
|
|
|
|
|
|
|
|
Selling/General/Administrative Expense |
14,345.9 |
13,057.7 |
14,730.1 |
20,387.7 |
16,092.9 |
|
Total Selling/General/Administrative Expenses |
14,345.9 |
13,057.7 |
14,730.1 |
20,387.7 |
16,092.9 |
|
Research & Development |
5,468.3 |
4,806.5 |
5,272.3 |
5,678.4 |
4,519.5 |
|
Impairment-Assets Held for Use |
178.3 |
1,546.8 |
43.3 |
117.0 |
- |
|
Loss (Gain) on Sale of Assets - Operating |
-291.2 |
-352.6 |
-830.1 |
-900.4 |
-466.7 |
|
Unusual Expense (Income) |
-112.8 |
1,194.2 |
-786.8 |
-783.3 |
-466.7 |
|
Other Operating Expense |
426.3 |
339.1 |
607.0 |
2,984.8 |
1,222.0 |
|
Other, Net |
-387.3 |
-567.4 |
-405.6 |
-429.2 |
-259.3 |
|
Other Operating Expenses, Total |
39.0 |
-228.3 |
201.4 |
2,555.6 |
962.7 |
|
Total Operating Expense |
91,334.5 |
84,992.4 |
95,042.6 |
112,300.5 |
89,681.4 |
|
|
|
|
|
|
|
|
Operating Income |
11,087.1 |
8,189.1 |
8,580.4 |
3,739.6 |
6,649.6 |
|
|
|
|
|
|
|
|
Interest Expense -
Non-Operating |
-2,390.7 |
-2,376.2 |
-2,991.7 |
-1,251.5 |
-1,192.7 |
|
Interest Expense, Net Non-Operating |
-2,390.7 |
-2,376.2 |
-2,991.7 |
-1,251.5 |
-1,192.7 |
|
Interest Income -
Non-Operating |
3,074.8 |
2,762.6 |
2,887.6 |
1,341.6 |
1,007.9 |
|
Investment Income -
Non-Operating |
204.8 |
12.2 |
-2,630.8 |
390.2 |
143.6 |
|
Interest/Investment Income - Non-Operating |
3,279.6 |
2,774.7 |
256.9 |
1,731.7 |
1,151.5 |
|
Interest Income (Expense) - Net Non-Operating Total |
888.9 |
398.5 |
-2,734.9 |
480.2 |
-41.2 |
|
Other Non-Operating Income (Expense) |
900.0 |
-517.4 |
-585.4 |
93.0 |
174.2 |
|
Other, Net |
900.0 |
-517.4 |
-585.4 |
93.0 |
174.2 |
|
Income Before Tax |
12,876.0 |
8,070.2 |
5,260.2 |
4,312.8 |
6,782.6 |
|
|
|
|
|
|
|
|
Total Income Tax |
3,108.2 |
2,312.7 |
1,938.6 |
1,523.2 |
1,585.0 |
|
Income After Tax |
9,767.8 |
5,757.5 |
3,321.6 |
2,789.7 |
5,197.6 |
|
|
|
|
|
|
|
|
Minority Interest |
-245.2 |
-228.3 |
-277.1 |
-241.6 |
-308.5 |
|
Net Income Before Extraord Items |
9,522.6 |
5,529.2 |
3,044.4 |
2,548.1 |
4,889.2 |
|
Discontinued Operations |
-961.3 |
-262.1 |
54.1 |
6,043.1 |
171.5 |
|
Total Extraord Items |
-961.3 |
-262.1 |
54.1 |
6,043.1 |
171.5 |
|
Net Income |
8,561.3 |
5,267.1 |
3,098.5 |
8,591.2 |
5,060.7 |
|
|
|
|
|
|
|
|
Income Available to Common Excl Extraord Items |
9,522.6 |
5,529.2 |
3,044.4 |
2,548.1 |
4,889.2 |
|
|
|
|
|
|
|
|
Income Available to Common Incl Extraord Items |
8,561.3 |
5,267.1 |
3,098.5 |
8,591.2 |
5,060.7 |
|
|
|
|
|
|
|
|
Basic/Primary Weighted Average Shares |
873.1 |
868.2 |
864.8 |
893.2 |
898.1 |
|
Basic EPS Excl Extraord Items |
10.91 |
6.37 |
3.52 |
2.85 |
5.44 |
|
Basic/Primary EPS Incl Extraord Items |
9.81 |
6.07 |
3.58 |
9.62 |
5.63 |
|
Diluted Net Income |
8,561.3 |
5,267.1 |
3,098.5 |
8,591.2 |
5,060.7 |
|
Diluted Weighted Average Shares |
882.7 |
877.5 |
871.7 |
896.3 |
935.2 |
|
Diluted EPS Excl Extraord Items |
10.79 |
6.30 |
3.49 |
2.84 |
5.23 |
|
Diluted EPS Incl Extraord Items |
9.70 |
6.00 |
3.55 |
9.59 |
5.41 |
|
Dividends per Share - Common Stock Primary Issue |
4.18 |
3.65 |
2.16 |
2.40 |
2.13 |
|
Gross Dividends - Common Stock |
3,622.3 |
3,182.7 |
1,876.4 |
2,067.9 |
1,944.0 |
|
Interest Expense, Supplemental |
2,390.7 |
2,376.2 |
2,991.7 |
1,251.5 |
1,192.7 |
|
Depreciation, Supplemental |
2,367.1 |
2,437.0 |
2,714.6 |
3,179.9 |
2,832.2 |
|
Total Special Items |
54.3 |
1,444.1 |
-786.8 |
-783.3 |
-466.7 |
|
Normalized Income Before Tax |
12,930.4 |
9,514.3 |
4,473.4 |
3,529.5 |
6,315.9 |
|
|
|
|
|
|
|
|
Effect of Special Items on Income Taxes |
13.1 |
413.8 |
-290.0 |
-276.6 |
-109.1 |
|
Inc Tax Ex Impact of Sp Items |
3,121.4 |
2,726.6 |
1,648.6 |
1,246.5 |
1,475.9 |
|
Normalized Income After Tax |
9,809.0 |
6,787.7 |
2,824.7 |
2,283.0 |
4,840.0 |
|
|
|
|
|
|
|
|
Normalized Inc. Avail to Com. |
9,563.8 |
6,559.4 |
2,547.6 |
2,041.4 |
4,531.5 |
|
|
|
|
|
|
|
|
Basic Normalized EPS |
10.95 |
7.55 |
2.95 |
2.29 |
5.05 |
|
Diluted Normalized EPS |
10.84 |
7.48 |
2.92 |
2.28 |
4.85 |
|
Amort of Intangibles, Supplemental |
1,129.9 |
1,068.6 |
1,127.5 |
1,344.6 |
1,168.8 |
|
Rental Expenses |
1,469.8 |
1,454.9 |
1,619.6 |
1,431.6 |
1,163.5 |
|
Research & Development Exp, Supplemental |
5,468.3 |
4,806.5 |
5,272.3 |
5,678.4 |
4,519.5 |
|
Normalized EBIT |
11,141.5 |
9,633.2 |
7,793.6 |
2,956.3 |
6,182.9 |
|
Normalized EBITDA |
14,638.4 |
13,138.7 |
11,635.6 |
7,480.7 |
10,183.9 |
|
Current Tax - Domestic |
419.4 |
14.9 |
363.7 |
186.1 |
598.3 |
|
Current Tax - Foreign |
1,748.5 |
1,976.3 |
1,634.4 |
1,502.1 |
1,010.5 |
|
Current Tax - Total |
2,167.8 |
1,991.2 |
1,998.1 |
1,688.2 |
1,608.9 |
|
Deferred Tax - Domestic |
508.5 |
783.5 |
1.4 |
-318.1 |
-207.4 |
|
Deferred Tax - Foreign |
431.9 |
-462.0 |
-60.8 |
153.1 |
183.5 |
|
Deferred Tax - Total |
940.4 |
321.5 |
-59.5 |
-165.1 |
-23.9 |
|
Income Tax - Total |
3,108.2 |
2,312.7 |
1,938.6 |
1,523.2 |
1,585.0 |
|
Interest Cost - Domestic |
1,021.2 |
1,083.4 |
1,153.2 |
1,148.0 |
964.0 |
|
Service Cost - Domestic |
394.3 |
387.7 |
367.7 |
418.7 |
476.0 |
|
Prior Service Cost - Domestic |
27.9 |
0.0 |
23.0 |
0.0 |
- |
|
Expected Return on Assets - Domestic |
-1,180.0 |
-1,082.1 |
-1,046.4 |
-1,394.1 |
-1,259.2 |
|
Actuarial Gains and Losses - Domestic |
-353.9 |
2,620.7 |
1,209.9 |
1,416.6 |
-656.9 |
|
Curtailments & Settlements - Domestic |
0.0 |
0.0 |
-2.7 |
-39.0 |
0.0 |
|
Domestic Pension Plan Expense |
-90.6 |
3,009.8 |
1,704.7 |
1,550.2 |
-476.0 |
|
Interest Cost - Foreign |
635.3 |
663.3 |
701.6 |
721.8 |
675.5 |
|
Service Cost - Foreign |
206.2 |
262.1 |
242.0 |
348.1 |
433.5 |
|
Prior Service Cost - Foreign |
-11.1 |
27.0 |
-4.1 |
-1.5 |
- |
|
Expected Return on Assets - Foreign |
-720.3 |
-648.4 |
-643.5 |
-813.3 |
-752.6 |
|
Actuarial Gains and Losses - Foreign |
196.4 |
1,111.8 |
680.0 |
1,434.6 |
-1,260.5 |
|
Curtailments & Settlements - Foreign |
-11.1 |
-274.2 |
-48.7 |
-30.0 |
-5.3 |
|
Foreign Pension Plan Expense |
295.4 |
1,141.5 |
927.4 |
1,659.7 |
-909.5 |
|
Interest Cost - Post-Retirement |
50.2 |
55.4 |
55.4 |
57.0 |
55.8 |
|
Service Cost - Post-Retirement |
29.3 |
32.4 |
20.3 |
27.0 |
31.9 |
|
Prior Service Cost - Post-Retirement |
5.6 |
2.7 |
-40.6 |
12.0 |
13.3 |
|
Curtailments & Settlements - Post-Retir. |
-13.9 |
-6.8 |
-12.2 |
-4.5 |
0.0 |
|
Post-Retirement Plan Expense |
71.1 |
83.8 |
23.0 |
91.5 |
101.1 |
|
Defined Contribution Expense - Domestic |
608.8 |
451.2 |
516.4 |
471.2 |
357.7 |
|
Total Pension Expense |
884.7 |
4,686.2 |
3,171.5 |
3,772.6 |
-926.8 |
|
Discount Rate - Domestic |
4.70% |
4.00% |
5.30% |
6.40% |
5.10% |
|
Expected Rate of Return - Domestic |
6.50% |
6.50% |
6.50% |
6.50% |
- |
|
Compensation Rate - Domestic |
2.25% |
2.25% |
2.25% |
2.25% |
2.25% |
|
Total Plan Interest Cost |
1,706.7 |
1,802.1 |
1,910.2 |
1,926.8 |
1,695.3 |
|
Total Plan Service Cost |
629.7 |
682.2 |
630.0 |
793.8 |
941.4 |
|
Total Plan Expected Return |
-1,900.3 |
-1,730.5 |
-1,689.9 |
-2,207.4 |
-2,011.8 |
Interim Income
Statement
Standardized
Financials in: USD (mil)
Except for share items (millions) and per share items (actual units)
|
|
30-Sep-2011 |
30-Jun-2011 |
31-Mar-2011 |
31-Dec-2010 |
30-Sep-2010 |
|
Period Length |
3 Months |
9 Months |
3 Months |
3 Months |
3 Months |
|
UpdateType/Date |
Updated Normal |
Restated Special
|
Updated Normal |
Restated
Calculated |
Restated Normal |
|
Filed Currency |
EUR |
EUR |
EUR |
EUR |
EUR |
|
Exchange Rate
(Period Average) |
0.707825 |
0.72104 |
0.731463 |
0.736368 |
0.774922 |
|
|
|
|
|
|
|
|
Net Sales |
28,751.4 |
73,732.4 |
24,221.3 |
23,905.2 |
25,038.6 |
|
Revenue |
28,751.4 |
73,732.4 |
24,221.3 |
23,905.2 |
25,038.6 |
|
Total Revenue |
28,751.4 |
73,732.4 |
24,221.3 |
23,905.2 |
25,038.6 |
|
|
|
|
|
|
|
|
Cost of Revenue |
20,588.4 |
51,058.2 |
16,672.1 |
16,235.1 |
18,383.8 |
|
Cost of Revenue, Total |
20,588.4 |
51,058.2 |
16,672.1 |
16,235.1 |
18,383.8 |
|
Gross Profit |
8,163.0 |
22,674.2 |
7,549.3 |
7,670.1 |
6,654.9 |
|
|
|
|
|
|
|
|
Selling/General/Administrative Expense |
3,954.4 |
10,398.9 |
3,426.0 |
3,274.2 |
3,541.0 |
|
Total Selling/General/Administrative Expenses |
3,954.4 |
10,398.9 |
3,426.0 |
3,274.2 |
3,541.0 |
|
Research & Development |
1,630.3 |
3,843.1 |
1,322.0 |
1,173.3 |
1,400.1 |
|
Loss (Gain) on Sale of Assets - Operating |
- |
- |
-42.4 |
-104.6 |
- |
|
Unusual Expense (Income) |
- |
- |
-42.4 |
-104.6 |
- |
|
Other Operating Expense |
257.1 |
443.8 |
83.4 |
253.9 |
1,791.1 |
|
Other, Net |
-156.8 |
-615.8 |
-49.2 |
-211.9 |
-246.5 |
|
Other Operating Expenses, Total |
100.3 |
-172.0 |
34.2 |
42.1 |
1,544.7 |
|
Total Operating Expense |
26,273.4 |
65,128.1 |
21,411.9 |
20,620.1 |
24,869.6 |
|
|
|
|
|
|
|
|
Operating Income |
2,478.0 |
8,604.2 |
2,809.4 |
3,285.0 |
169.0 |
|
|
|
|
|
|
|
|
Interest Expense -
Non-Operating |
-618.8 |
-1,772.4 |
-594.7 |
-569.0 |
-580.7 |
|
Interest Expense, Net Non-Operating |
-618.8 |
-1,772.4 |
-594.7 |
-569.0 |
-580.7 |
|
Interest Income -
Non-Operating |
799.6 |
2,275.9 |
742.3 |
744.2 |
698.1 |
|
Investment Income -
Non-Operating |
-35.3 |
238.5 |
125.8 |
167.0 |
-105.8 |
|
Interest/Investment Income - Non-Operating |
764.3 |
2,514.4 |
868.1 |
911.2 |
592.3 |
|
Interest Income (Expense) - Net Non-Operating Total |
145.5 |
742.0 |
273.4 |
342.2 |
11.6 |
|
Other Non-Operating Income (Expense) |
-39.6 |
934.8 |
2,026.1 |
-97.8 |
-271.0 |
|
Other, Net |
-39.6 |
934.8 |
2,026.1 |
-97.8 |
-271.0 |
|
Income Before Tax |
2,584.0 |
10,281.0 |
5,108.9 |
3,529.5 |
-90.3 |
|
|
|
|
|
|
|
|
Total Income Tax |
849.1 |
2,260.6 |
769.7 |
1,022.6 |
-36.1 |
|
Income After Tax |
1,734.9 |
8,020.4 |
4,339.2 |
2,506.9 |
-54.2 |
|
|
|
|
|
|
|
|
Minority Interest |
-83.4 |
-162.3 |
-58.8 |
-47.5 |
-91.6 |
|
Net Income Before Extraord Items |
1,651.5 |
7,858.1 |
4,280.5 |
2,459.4 |
-145.8 |
|
Discontinued Operations |
4.2 |
-961.1 |
-462.1 |
-126.3 |
-456.8 |
|
Total Extraord Items |
4.2 |
-961.1 |
-462.1 |
-126.3 |
-456.8 |
|
Net Income |
1,655.8 |
6,897.0 |
3,818.4 |
2,333.1 |
-602.6 |
|
|
|
|
|
|
|
|
Income Available to Common Excl Extraord Items |
1,651.5 |
7,858.1 |
4,280.5 |
2,459.4 |
-145.8 |
|
|
|
|
|
|
|
|
Income Available to Common Incl Extraord Items |
1,655.8 |
6,897.0 |
3,818.4 |
2,333.1 |
-602.6 |
|
|
|
|
|
|
|
|
Basic/Primary Weighted Average Shares |
874.1 |
872.8 |
873.2 |
871.2 |
869.3 |
|
Basic EPS Excl Extraord Items |
1.89 |
9.00 |
4.90 |
2.82 |
-0.17 |
|
Basic/Primary EPS Incl Extraord Items |
1.89 |
7.90 |
4.37 |
2.68 |
-0.69 |
|
Dilution Adjustment |
- |
- |
- |
- |
0.0 |
|
Diluted Net Income |
1,655.8 |
6,897.0 |
3,818.4 |
2,333.1 |
-602.6 |
|
Diluted Weighted Average Shares |
881.2 |
883.3 |
882.4 |
880.8 |
869.3 |
|
Diluted EPS Excl Extraord Items |
1.87 |
8.90 |
4.85 |
2.79 |
-0.17 |
|
Diluted EPS Incl Extraord Items |
1.88 |
7.81 |
4.33 |
2.65 |
-0.69 |
|
Dividends per Share - Common Stock Primary Issue |
4.24 |
0.00 |
0.00 |
0.00 |
3.48 |
|
Gross Dividends - Common Stock |
3,673.2 |
0.0 |
0.0 |
0.0 |
3,039.0 |
|
Interest Expense, Supplemental |
618.8 |
1,772.4 |
594.7 |
569.0 |
580.7 |
|
Depreciation, Supplemental |
- |
- |
564.6 |
569.0 |
- |
|
Total Special Items |
- |
- |
-42.4 |
-104.6 |
- |
|
Normalized Income Before Tax |
2,584.0 |
10,281.0 |
5,066.6 |
3,424.9 |
-90.3 |
|
|
|
|
|
|
|
|
Effect of Special Items on Income Taxes |
- |
- |
-6.4 |
-30.3 |
- |
|
Inc Tax Ex Impact of Sp Items |
849.1 |
2,260.6 |
763.3 |
992.3 |
-36.1 |
|
Normalized Income After Tax |
1,734.9 |
8,020.4 |
4,303.3 |
2,432.6 |
-54.2 |
|
|
|
|
|
|
|
|
Normalized Inc. Avail to Com. |
1,651.5 |
7,858.1 |
4,244.5 |
2,385.1 |
-145.8 |
|
|
|
|
|
|
|
|
Basic Normalized EPS |
1.89 |
9.00 |
4.86 |
2.74 |
-0.17 |
|
Diluted Normalized EPS |
1.87 |
8.90 |
4.81 |
2.71 |
-0.17 |
|
Amort of Intangibles, Supplemental |
- |
- |
268.0 |
266.2 |
- |
|
Research & Development Exp, Supplemental |
1,630.3 |
3,843.1 |
1,322.0 |
1,173.3 |
1,400.1 |
|
Normalized EBIT |
2,478.0 |
8,604.2 |
2,767.1 |
3,180.5 |
169.0 |
|
Normalized EBITDA |
2,478.0 |
8,604.2 |
3,599.6 |
4,015.7 |
169.0 |
|
Interest Cost - Domestic |
- |
- |
263.9 |
262.1 |
- |
|
Service Cost - Domestic |
- |
- |
109.4 |
108.6 |
- |
|
Prior Service Cost - Domestic |
- |
- |
0.0 |
0.0 |
- |
|
Expected Return on Assets - Domestic |
- |
- |
-303.5 |
-301.5 |
- |
|
Curtailments & Settlements - Domestic |
- |
- |
0.0 |
0.0 |
- |
|
Domestic Pension Plan Expense |
- |
- |
69.7 |
69.3 |
- |
|
Interest Cost - Foreign |
- |
- |
187.3 |
188.8 |
- |
|
Service Cost - Foreign |
- |
- |
49.2 |
91.0 |
- |
|
Prior Service Cost - Foreign |
- |
- |
-4.1 |
-2.7 |
- |
|
Expected Return on Assets - Foreign |
- |
- |
-211.9 |
-213.2 |
- |
|
Curtailments & Settlements - Foreign |
- |
- |
0.0 |
-8.1 |
- |
|
Foreign Pension Plan Expense |
- |
- |
20.5 |
55.7 |
- |
|
Defined Contribution Expense - Domestic |
- |
- |
20.5 |
21.7 |
- |
|
Total Pension Expense |
- |
- |
110.7 |
146.7 |
- |
|
Discount Rate - Domestic |
- |
- |
5.00% |
- |
- |
|
Total Plan Interest Cost |
- |
- |
451.2 |
450.9 |
- |
|
Total Plan Service Cost |
- |
- |
158.6 |
199.6 |
- |
|
Total Plan Expected Return |
- |
- |
-515.4 |
-514.7 |
- |
Annual Balance
Sheet
Standardized
Financials in: USD (mil)
Except for share items (millions) and per share items (actual units)
|
|
30-Sep-2011 |
30-Sep-2010 |
30-Sep-2009 |
30-Sep-2008 |
30-Sep-2007 |
|
UpdateType/Date |
Updated Normal |
Reclassified
Normal |
Reclassified
Normal |
Updated Normal |
Updated Normal |
|
Filed Currency |
EUR |
EUR |
EUR |
EUR |
EUR |
|
Exchange Rate |
0.745323 |
0.732493 |
0.684135 |
0.711921 |
0.703161 |
|
Auditor |
Ernst &
Young LLP |
Ernst &
Young LLP |
Ernst &
Young LLP |
KPMG LLP |
KPMG LLP |
|
Auditor Opinion |
Unqualified |
Unqualified |
Unqualified |
Unqualified |
Unqualified |
|
|
|
|
|
|
|
|
Cash & Equivalents |
16,728.3 |
19,260.2 |
14,849.4 |
9,682.3 |
5,695.7 |
|
Short Term Investments |
5,723.7 |
5,040.3 |
5,164.2 |
4,590.4 |
4,444.2 |
|
Cash and Short Term Investments |
22,452.0 |
24,300.6 |
20,013.6 |
14,272.6 |
10,139.9 |
|
Trade Accounts Receivable - Net |
17,560.2 |
18,726.4 |
18,579.7 |
22,172.4 |
20,791.8 |
|
Other Receivables |
2,052.8 |
2,015.0 |
1,797.9 |
856.8 |
566.0 |
|
Total Receivables, Net |
19,613.0 |
20,741.5 |
20,377.6 |
23,029.2 |
21,357.8 |
|
Inventories - Finished Goods |
3,108.7 |
3,912.7 |
4,304.7 |
3,982.2 |
3,637.9 |
|
Inventories - Work In Progress |
4,979.0 |
5,084.0 |
5,289.9 |
5,039.9 |
4,545.2 |
|
Inventories - Raw Materials |
3,555.5 |
3,303.8 |
3,331.2 |
3,642.3 |
3,130.2 |
|
Inventories - Other |
8,674.1 |
8,109.3 |
7,726.5 |
7,715.7 |
7,075.2 |
|
Total Inventory |
20,317.4 |
20,409.7 |
20,652.4 |
20,380.1 |
18,388.4 |
|
Prepaid Expenses |
335.4 |
404.1 |
463.4 |
452.3 |
490.6 |
|
Other Current Assets |
8,141.4 |
2,648.5 |
2,272.9 |
2,605.6 |
17,789.7 |
|
Other Current Assets, Total |
8,141.4 |
2,648.5 |
2,272.9 |
2,605.6 |
17,789.7 |
|
Total Current Assets |
70,859.2 |
68,504.4 |
63,779.8 |
60,739.9 |
68,166.5 |
|
|
|
|
|
|
|
|
Land/Improvements |
10,881.2 |
11,735.3 |
12,662.7 |
11,557.5 |
12,286.0 |
|
Machinery/Equipment |
20,255.6 |
26,248.7 |
26,030.0 |
24,631.9 |
23,670.3 |
|
Construction in
Progress |
1,257.2 |
1,520.8 |
1,407.6 |
1,657.5 |
1,271.4 |
|
Property/Plant/Equipment - Gross |
32,394.0 |
39,504.8 |
40,100.3 |
37,846.9 |
37,227.6 |
|
Accumulated Depreciation |
-18,337.0 |
-23,466.4 |
-23,549.4 |
-22,033.3 |
-22,216.8 |
|
Property/Plant/Equipment - Net |
14,057.0 |
16,038.4 |
16,550.8 |
15,813.5 |
15,010.8 |
|
Goodwill, Net |
21,072.7 |
21,519.6 |
23,125.6 |
22,480.0 |
17,778.3 |
|
Intangibles - Gross |
12,907.2 |
13,755.8 |
13,422.8 |
- |
- |
|
Accumulated Intangible Amortization |
-6,944.6 |
-6,972.1 |
-6,076.3 |
- |
- |
|
Intangibles, Net |
5,962.5 |
6,783.7 |
7,346.5 |
7,603.4 |
6,568.9 |
|
LT Investment - Affiliate Companies |
6,662.9 |
6,449.2 |
6,839.3 |
9,856.4 |
9,977.8 |
|
LT Investments - Other |
9,014.9 |
6,796.0 |
11,668.8 |
10,935.2 |
7,908.6 |
|
Long Term Investments |
15,677.8 |
13,245.2 |
18,508.0 |
20,791.6 |
17,886.4 |
|
Note Receivable - Long Term |
4,002.3 |
4,223.9 |
662.2 |
- |
- |
|
Deferred Income Tax - Long Term Asset |
4,301.5 |
5,378.9 |
4,810.5 |
4,226.6 |
3,689.1 |
|
Other Long Term Assets |
3,929.8 |
4,685.4 |
3,970.0 |
1,032.4 |
1,105.0 |
|
Other Long Term Assets, Total |
8,231.3 |
10,064.3 |
8,780.4 |
5,259.0 |
4,794.1 |
|
Total Assets |
139,862.8 |
140,379.4 |
138,753.3 |
132,687.5 |
130,204.9 |
|
|
|
|
|
|
|
|
Accounts Payable |
10,300.2 |
10,783.7 |
11,098.7 |
12,445.2 |
11,920.5 |
|
Accrued Expenses |
16,348.6 |
17,852.7 |
16,831.5 |
7,255.0 |
5,092.7 |
|
Notes Payable/Short Term Debt |
3,347.5 |
2,815.0 |
0.0 |
1,438.4 |
985.5 |
|
Current Portion - Long Term Debt/Capital Leases |
3,017.5 |
1,346.1 |
2,220.3 |
4,525.8 |
10,661.9 |
|
Customer Advances |
18,178.7 |
18,016.5 |
17,775.7 |
- |
- |
|
Income Taxes Payable |
2,726.3 |
2,479.2 |
2,829.9 |
2,767.2 |
3,044.8 |
|
Other Current Liabilities |
4,525.6 |
2,147.5 |
2,575.5 |
31,197.3 |
30,718.4 |
|
Other Current liabilities, Total |
25,430.6 |
22,643.2 |
23,181.1 |
33,964.4 |
33,763.3 |
|
Total Current Liabilities |
58,444.5 |
55,440.8 |
53,331.6 |
59,628.8 |
62,423.9 |
|
|
|
|
|
|
|
|
Long Term Debt |
20,092.0 |
25,046.0 |
28,498.8 |
20,302.8 |
14,268.4 |
|
Capital Lease Obligations |
173.1 |
166.6 |
217.8 |
255.6 |
338.5 |
|
Total Long Term Debt |
20,265.0 |
25,212.5 |
28,716.6 |
20,558.5 |
14,606.9 |
|
Total Debt |
26,630.1 |
29,373.6 |
30,936.9 |
26,522.6 |
26,254.3 |
|
|
|
|
|
|
|
|
Deferred Income Tax - LT Liability |
798.3 |
787.7 |
1,134.3 |
1,019.8 |
824.8 |
|
Deferred Income Tax |
798.3 |
787.7 |
1,134.3 |
1,019.8 |
824.8 |
|
Minority Interest |
839.9 |
1,023.9 |
936.9 |
851.2 |
897.4 |
|
Pension Benefits - Underfunded |
9,803.8 |
11,555.1 |
8,679.6 |
6,125.7 |
3,953.6 |
|
Other Long Term Liabilities |
7,407.5 |
7,661.5 |
7,005.9 |
6,895.4 |
6,261.7 |
|
Other Liabilities, Total |
17,211.3 |
19,216.6 |
15,685.5 |
13,021.1 |
10,215.3 |
|
Total Liabilities |
97,559.0 |
101,681.5 |
99,804.9 |
95,079.4 |
88,968.3 |
|
|
|
|
|
|
|
|
Common Stock |
3,680.3 |
3,744.7 |
4,009.4 |
3,853.0 |
3,901.0 |
|
Common Stock |
3,680.3 |
3,744.7 |
4,009.4 |
3,853.0 |
3,901.0 |
|
Additional Paid-In Capital |
8,065.0 |
8,172.1 |
8,691.3 |
8,423.7 |
8,646.7 |
|
Retained Earnings (Accumulated Deficit) |
34,724.5 |
31,396.9 |
33,101.7 |
32,291.5 |
29,087.2 |
|
Treasury Stock - Common |
-4,074.7 |
-4,604.8 |
-5,308.9 |
-5,621.4 |
0.0 |
|
Other Comprehensive Income |
-91.2 |
-10.9 |
-1,545.0 |
-1,338.6 |
-398.2 |
|
Other Equity, Total |
-91.2 |
-10.9 |
-1,545.0 |
-1,338.6 |
-398.2 |
|
Total Equity |
42,303.8 |
38,698.0 |
38,948.5 |
37,608.1 |
41,236.7 |
|
|
|
|
|
|
|
|
Total Liabilities & Shareholders’ Equity |
139,862.8 |
140,379.4 |
138,753.3 |
132,687.5 |
130,204.9 |
|
|
|
|
|
|
|
|
Shares Outstanding - Common Stock Primary
Issue |
874.3 |
869.8 |
866.4 |
861.6 |
914.2 |
|
Total Common Shares Outstanding |
874.3 |
869.8 |
866.4 |
861.6 |
914.2 |
|
Treasury Shares - Common Stock Primary Issue |
40.0 |
44.4 |
47.8 |
52.6 |
0.0 |
|
Employees |
360,000 |
336,000 |
405,000 |
427,000 |
398,000 |
|
Accumulated Intangible Amort, Suppl. |
6,944.6 |
6,972.1 |
6,076.3 |
5,061.0 |
4,478.4 |
|
Deferred Revenue - Current |
18,178.7 |
18,016.5 |
17,775.7 |
15,999.0 |
797.8 |
|
Deferred Revenue - Long Term |
318.0 |
374.1 |
283.6 |
- |
- |
|
Total Long Term Debt, Supplemental |
23,875.6 |
26,951.8 |
28,421.3 |
21,930.8 |
- |
|
Long Term Debt Maturing within 1 Year |
4,889.2 |
3,232.8 |
954.5 |
2,411.8 |
- |
|
Long Term Debt Maturing in Year 2 |
2,313.1 |
2,635.9 |
3,278.6 |
209.3 |
- |
|
Long Term Debt Maturing in Year 3 |
2,313.1 |
2,635.9 |
3,793.1 |
2,868.3 |
- |
|
Long Term Debt Maturing in Year 4 |
2,313.1 |
2,635.9 |
4,677.4 |
3,475.1 |
- |
|
Long Term Debt Maturing in Year 5 |
2,313.1 |
2,635.9 |
1,625.4 |
1,647.7 |
- |
|
Long Term Debt Maturing in 2-3 Years |
4,626.2 |
5,271.7 |
7,071.7 |
3,077.6 |
- |
|
Long Term Debt Maturing in 4-5 Years |
4,626.2 |
5,271.7 |
6,302.9 |
5,122.8 |
- |
|
Long Term Debt Matur. in Year 6 & Beyond |
9,734.0 |
13,175.5 |
14,092.2 |
11,318.7 |
- |
|
Total Capital Leases, Supplemental |
194.5 |
233.4 |
283.6 |
327.3 |
406.7 |
|
Capital Lease Payments Due in Year 1 |
21.5 |
66.9 |
65.8 |
71.6 |
68.3 |
|
Capital Lease Payments Due in Year 2 |
21.1 |
17.7 |
61.4 |
28.1 |
72.5 |
|
Capital Lease Payments Due in Year 3 |
21.1 |
17.7 |
19.0 |
37.9 |
28.4 |
|
Capital Lease Payments Due in Year 4 |
21.1 |
17.7 |
24.8 |
56.2 |
83.9 |
|
Capital Lease Payments Due in Year 5 |
21.1 |
17.7 |
7.3 |
23.9 |
11.4 |
|
Capital Lease Payments Due in 2-3 Years |
42.3 |
35.5 |
80.4 |
66.0 |
101.0 |
|
Capital Lease Payments Due in 4-5 Years |
42.3 |
35.5 |
32.2 |
80.1 |
95.3 |
|
Cap. Lease Pymts. Due in Year 6 & Beyond |
88.6 |
95.6 |
105.2 |
109.6 |
142.2 |
|
Total Operating Leases, Supplemental |
4,116.3 |
4,267.6 |
4,089.8 |
3,813.6 |
3,484.3 |
|
Operating Lease Payments Due in Year 1 |
960.7 |
984.3 |
1,011.5 |
886.3 |
826.3 |
|
Operating Lease Payments Due in Year 2 |
511.9 |
539.6 |
754.2 |
679.9 |
675.5 |
|
Operating Lease Payments Due in Year 3 |
511.9 |
539.6 |
552.5 |
507.1 |
514.8 |
|
Operating Lease Payments Due in Year 4 |
511.9 |
539.6 |
423.9 |
401.7 |
371.2 |
|
Operating Lease Payments Due in Year 5 |
511.9 |
539.6 |
350.8 |
368.0 |
312.9 |
|
Operating Lease Pymts. Due in 2-3 Years |
1,023.7 |
1,079.2 |
1,306.8 |
1,186.9 |
1,190.3 |
|
Operating Lease Pymts. Due in 4-5 Years |
1,023.7 |
1,079.2 |
774.7 |
769.7 |
684.1 |
|
Oper. Lse. Pymts. Due in Year 6 & Beyond |
1,108.2 |
1,124.9 |
996.9 |
970.6 |
783.6 |
|
Pension Obligation - Domestic |
36,388.2 |
42,969.7 |
36,774.9 |
31,820.9 |
35,627.7 |
|
Plan Assets - Domestic |
28,128.7 |
32,910.9 |
30,906.2 |
28,365.5 |
34,150.1 |
|
Funded Status - Domestic |
-8,259.5 |
-10,058.8 |
-5,868.7 |
-3,455.4 |
-1,477.6 |
|
Total Funded Status |
-8,259.5 |
-10,058.8 |
-5,868.7 |
-3,455.4 |
-1,477.6 |
|
Discount Rate - Domestic |
4.70% |
4.00% |
5.30% |
6.40% |
6.90% |
|
Expected Rate of Return - Domestic |
6.50% |
6.50% |
6.50% |
6.50% |
- |
|
Compensation Rate - Domestic |
2.25% |
2.25% |
2.25% |
2.25% |
2.25% |
|
Equity % - Domestic |
29.00% |
27.00% |
27.00% |
29.00% |
33.00% |
|
Equity % - Foreign |
27.00% |
28.00% |
29.00% |
29.00% |
- |
|
Real Estate % - Domestic |
6.00% |
6.00% |
8.00% |
8.00% |
8.00% |
|
Real Estate % - Foreign |
8.00% |
9.00% |
9.00% |
10.00% |
- |
|
Total Plan Obligations |
36,388.2 |
42,969.7 |
36,774.9 |
31,820.9 |
35,627.7 |
|
Total Plan Assets |
28,128.7 |
32,910.9 |
30,906.2 |
28,365.5 |
34,150.1 |
Interim Balance Sheet
Standardized
Financials in: USD (mil)
Except for share items (millions) and per share items (actual units)
|
|
30-Sep-2011 |
30-Jun-2011 |
31-Mar-2011 |
31-Dec-2010 |
30-Sep-2010 |
|
UpdateType/Date |
Updated Normal |
Updated Normal |
Updated Normal |
Updated Normal |
Reclassified
Normal |
|
Filed Currency |
EUR |
EUR |
EUR |
EUR |
EUR |
|
Exchange Rate |
0.745323 |
0.689727 |
0.704672 |
0.745406 |
0.732493 |
|
|
|
|
|
|
|
|
Cash & Equivalents |
16,728.3 |
18,856.7 |
21,248.2 |
21,011.4 |
19,260.2 |
|
Short Term Investments |
4,529.6 |
4,975.9 |
4,937.0 |
4,136.0 |
3,899.0 |
|
Cash and Short Term Investments |
21,257.9 |
23,832.6 |
26,185.2 |
25,147.4 |
23,159.3 |
|
Trade Accounts Receivable - Net |
19,920.2 |
19,931.1 |
19,475.7 |
20,398.3 |
21,163.3 |
|
Other Receivables |
1,070.7 |
1,171.5 |
1,047.3 |
1,065.2 |
1,078.5 |
|
Total Receivables, Net |
20,990.9 |
21,102.6 |
20,523.0 |
21,463.5 |
22,241.8 |
|
Total Inventory |
20,317.4 |
23,014.9 |
21,744.9 |
21,255.5 |
20,409.7 |
|
Discontinued Operations - Current Asset |
6,597.1 |
8,275.7 |
7,372.2 |
1,224.8 |
976.1 |
|
Other Current Assets |
1,695.9 |
1,851.5 |
1,840.6 |
1,858.0 |
1,717.4 |
|
Other Current Assets, Total |
8,293.0 |
10,127.2 |
9,212.8 |
3,082.9 |
2,693.5 |
|
Total Current Assets |
70,859.2 |
78,077.3 |
77,665.9 |
70,949.2 |
68,504.4 |
|
|
|
|
|
|
|
|
Property/Plant/Equipment - Net |
14,057.0 |
14,447.8 |
14,039.2 |
15,850.4 |
16,038.4 |
|
Goodwill, Net |
21,072.7 |
22,097.2 |
21,742.0 |
21,490.3 |
21,519.6 |
|
Intangibles - Gross |
12,907.2 |
13,395.2 |
13,067.1 |
13,779.1 |
- |
|
Accumulated Intangible Amortization |
-6,944.6 |
-7,043.4 |
-6,733.6 |
-7,188.0 |
- |
|
Intangibles, Net |
5,962.5 |
6,351.8 |
6,333.4 |
6,591.0 |
6,783.7 |
|
LT Investment - Affiliate Companies |
6,662.9 |
6,451.8 |
6,674.0 |
6,809.7 |
6,449.2 |
|
LT Investments - Other |
15,905.9 |
14,250.6 |
13,237.4 |
13,502.7 |
14,696.4 |
|
Long Term Investments |
22,568.7 |
20,702.4 |
19,911.4 |
20,312.4 |
21,145.6 |
|
Deferred Income Tax - Long Term Asset |
4,301.5 |
4,243.7 |
3,983.4 |
4,541.1 |
5,378.9 |
|
Other Long Term Assets |
1,041.2 |
980.1 |
962.1 |
1,046.4 |
1,008.9 |
|
Other Long Term Assets, Total |
5,342.6 |
5,223.8 |
4,945.6 |
5,587.6 |
6,387.8 |
|
Total Assets |
139,862.8 |
146,900.3 |
144,637.5 |
140,780.9 |
140,379.4 |
|
|
|
|
|
|
|
|
Accounts Payable |
10,300.2 |
9,618.3 |
10,023.1 |
10,158.2 |
10,783.7 |
|
Notes Payable/Short Term Debt |
3,014.8 |
2,431.4 |
3,519.4 |
2,463.1 |
1,912.6 |
|
Current Portion - Long Term Debt/Capital Leases |
4,910.6 |
7,207.2 |
7,118.2 |
5,434.6 |
3,298.3 |
|
Income Taxes Payable |
2,726.3 |
2,467.6 |
2,545.9 |
2,373.2 |
2,479.2 |
|
Discontinued Operations - Current Liability |
2,356.0 |
4,532.2 |
4,216.1 |
199.9 |
199.3 |
|
Other Current Liabilities |
35,136.4 |
36,530.4 |
35,098.6 |
36,845.7 |
36,767.6 |
|
Other Current liabilities, Total |
40,218.8 |
43,530.3 |
41,860.6 |
39,418.8 |
39,446.1 |
|
Total Current Liabilities |
58,444.5 |
62,787.2 |
62,521.3 |
57,474.7 |
55,440.8 |
|
|
|
|
|
|
|
|
Long Term Debt |
20,092.0 |
21,456.3 |
20,981.4 |
22,303.3 |
25,046.0 |
|
Capital Lease Obligations |
173.1 |
189.9 |
187.3 |
- |
166.6 |
|
Total Long Term Debt |
20,265.0 |
21,646.3 |
21,168.7 |
22,303.3 |
25,212.5 |
|
Total Debt |
28,190.5 |
31,284.9 |
31,806.3 |
30,201.0 |
30,423.5 |
|
|
|
|
|
|
|
|
Deferred Income Tax - LT Liability |
798.3 |
996.0 |
1,009.0 |
886.8 |
787.7 |
|
Deferred Income Tax |
798.3 |
996.0 |
1,009.0 |
886.8 |
787.7 |
|
Minority Interest |
839.9 |
797.4 |
806.0 |
1,026.3 |
1,023.9 |
|
Reserves |
4,902.6 |
4,333.6 |
4,224.7 |
4,232.6 |
4,548.8 |
|
Pension Benefits - Underfunded |
9,803.8 |
8,694.8 |
8,294.6 |
9,704.8 |
11,555.1 |
|
Other Long Term Liabilities |
2,505.0 |
2,711.2 |
2,741.7 |
3,172.8 |
3,112.7 |
|
Other Liabilities, Total |
17,211.3 |
15,739.6 |
15,261.0 |
17,110.1 |
19,216.6 |
|
Total Liabilities |
97,559.0 |
101,966.5 |
100,766.0 |
98,801.1 |
101,681.5 |
|
|
|
|
|
|
|
|
Common Stock |
3,680.3 |
3,976.9 |
3,892.6 |
3,679.9 |
3,744.7 |
|
Common Stock |
3,680.3 |
3,976.9 |
3,892.6 |
3,679.9 |
3,744.7 |
|
Additional Paid-In Capital |
8,065.0 |
8,677.4 |
8,446.5 |
7,913.8 |
8,172.1 |
|
Retained Earnings (Accumulated Deficit) |
34,724.5 |
37,082.8 |
36,090.6 |
34,216.2 |
31,396.9 |
|
Treasury Stock - Common |
-4,074.7 |
-4,429.3 |
-4,358.1 |
-4,250.0 |
-4,604.8 |
|
Other Equity |
-91.2 |
-374.1 |
-200.1 |
419.9 |
-10.9 |
|
Other Equity, Total |
-91.2 |
-374.1 |
-200.1 |
419.9 |
-10.9 |
|
Total Equity |
42,303.8 |
44,933.8 |
43,871.5 |
41,979.8 |
38,698.0 |
|
Total Liabilities & Shareholders’ Equity |
139,862.8 |
146,900.3 |
144,637.5 |
140,780.9 |
140,379.4 |
|
Shares Outstanding - Common Stock Primary
Issue |
874.3 |
874.0 |
873.8 |
872.5 |
869.8 |
|
Total Common Shares Outstanding |
874.3 |
874.0 |
873.8 |
872.5 |
869.8 |
|
Treasury Shares - Common Stock Primary Issue |
40.0 |
40.2 |
40.4 |
41.7 |
44.4 |
|
Employees |
360,000 |
353,000 |
347,000 |
410,000 |
336,000 |
|
Accumulated Intangible Amort, Suppl. |
6,944.6 |
7,043.4 |
6,733.6 |
7,188.0 |
6,972.1 |
|
Discount Rate - Domestic |
4.50% |
4.90% |
5.00% |
4.20% |
4.20% |
Annual Cash Flows
Standardized
Financials in: USD (mil)
Except for share items (millions) and per share items (actual units)
|
|
30-Sep-2011 |
30-Sep-2010 |
30-Sep-2009 |
30-Sep-2008 |
30-Sep-2007 |
|
Period Length |
12 Months |
12 Months |
12 Months |
12 Months |
12 Months |
|
UpdateType/Date |
Updated Normal |
Reclassified
Normal |
Reclassified
Normal |
Updated Normal |
Updated Normal |
|
Filed Currency |
EUR |
EUR |
EUR |
EUR |
EUR |
|
Exchange Rate
(Period Average) |
0.717768 |
0.740255 |
0.73971 |
0.666382 |
0.752073 |
|
Auditor |
Ernst &
Young LLP |
Ernst &
Young LLP |
Ernst &
Young LLP |
KPMG LLP |
KPMG LLP |
|
Auditor Opinion |
Unqualified |
Unqualified |
Unqualified |
Unqualified |
Unqualified |
|
|
|
|
|
|
|
|
Net Income/Starting Line |
9,767.8 |
5,757.5 |
3,375.6 |
8,832.8 |
5,369.2 |
|
Depreciation |
3,675.3 |
5,056.4 |
3,881.2 |
4,821.6 |
4,987.5 |
|
Depreciation/Depletion |
3,675.3 |
5,056.4 |
3,881.2 |
4,821.6 |
4,987.5 |
|
Discontinued Operations |
-402.6 |
475.5 |
- |
- |
- |
|
Unusual Items |
-291.2 |
-352.6 |
-586.7 |
-7,641.3 |
-2,727.1 |
|
Other Non-Cash Items |
-1,978.4 |
-470.1 |
2,780.8 |
-90.0 |
17.3 |
|
Non-Cash Items |
-2,672.2 |
-347.2 |
2,194.1 |
-7,731.3 |
-2,709.8 |
|
Accounts Receivable |
-848.5 |
-71.6 |
1,492.5 |
-1,632.7 |
-1,573.0 |
|
Inventories |
-1,581.3 |
72.9 |
-83.8 |
-2,447.5 |
-1,311.0 |
|
Other Assets |
-1,407.1 |
-1,049.6 |
-486.7 |
250.6 |
-646.2 |
|
Accounts Payable |
930.7 |
-20.3 |
-1,446.5 |
1,079.0 |
1,539.7 |
|
Accrued Expenses |
78.0 |
744.3 |
-742.2 |
2,121.9 |
-343.1 |
|
Taxes Payable |
3,108.2 |
2,312.7 |
2,017.0 |
1,247.0 |
2,915.9 |
|
Other Liabilities |
1,042.1 |
1,346.8 |
-1,030.1 |
6,628.3 |
3,800.2 |
|
Other Assets & Liabilities, Net |
-487.6 |
-278.3 |
-482.6 |
300.1 |
-1,174.1 |
|
Other Operating Cash Flow |
-784.4 |
-894.3 |
-440.7 |
-528.2 |
-1,111.6 |
|
Changes in Working Capital |
50.2 |
2,162.8 |
-1,203.2 |
7,018.5 |
2,096.9 |
|
Cash from Operating Activities |
10,821.0 |
12,629.4 |
8,247.8 |
12,941.5 |
9,743.7 |
|
|
|
|
|
|
|
|
Purchase of Fixed Assets |
-3,024.7 |
-2,639.6 |
-3,325.6 |
-5,583.9 |
-4,987.5 |
|
Capital Expenditures |
-3,024.7 |
-2,639.6 |
-3,325.6 |
-5,583.9 |
-4,987.5 |
|
Acquisition of Business |
-418.0 |
-586.3 |
-281.2 |
-8,114.0 |
-9,799.6 |
|
Sale of Business |
246.6 |
232.4 |
-316.3 |
15,728.2 |
-505.3 |
|
Sale of Fixed Assets |
2,936.9 |
790.3 |
1,654.7 |
1,205.0 |
1,384.2 |
|
Sale/Maturity of Investment |
52.9 |
59.4 |
47.3 |
73.5 |
557.1 |
|
Purchase of Investments |
-1,380.7 |
-724.1 |
-1,384.3 |
-250.6 |
-543.8 |
|
Other Investing Cash Flow |
-4,047.3 |
-978.0 |
-669.2 |
-3,669.1 |
-1,206.0 |
|
Other Investing Cash Flow Items, Total |
-2,609.5 |
-1,206.3 |
-949.0 |
4,973.1 |
-10,113.4 |
|
Cash from Investing Activities |
-5,634.1 |
-3,846.0 |
-4,274.6 |
-610.8 |
-15,100.9 |
|
|
|
|
|
|
|
|
Other Financing Cash Flow |
-859.6 |
-857.8 |
-1,243.7 |
-1,451.1 |
-1,755.1 |
|
Financing Cash Flow Items |
-859.6 |
-857.8 |
-1,243.7 |
-1,451.1 |
-1,755.1 |
|
Cash Dividends Paid - Common |
-3,282.4 |
-1,875.0 |
-1,865.6 |
-2,193.9 |
-1,717.9 |
|
Total Cash Dividends Paid |
-3,282.4 |
-1,875.0 |
-1,865.6 |
-2,193.9 |
-1,717.9 |
|
Sale/Issuance of
Common |
-1,064.4 |
198.6 |
181.2 |
372.2 |
1,288.4 |
|
Repurchase/Retirement
of Common |
- |
- |
- |
-6,527.8 |
-134.3 |
|
Common Stock, Net |
-1,064.4 |
198.6 |
181.2 |
-6,155.6 |
1,154.1 |
|
Issuance (Retirement) of Stock, Net |
-1,064.4 |
198.6 |
181.2 |
-6,155.6 |
1,154.1 |
|
Short Term Debt, Net |
316.3 |
-979.4 |
-481.3 |
-6,955.5 |
5,831.9 |
|
Long Term Debt Issued |
157.4 |
0.0 |
5,371.0 |
8,595.7 |
1,018.5 |
|
Long Term Debt
Reduction |
-2,850.5 |
-60.8 |
-1,454.6 |
-1,036.9 |
-6,109.8 |
|
Long Term Debt, Net |
-2,693.1 |
-60.8 |
3,916.4 |
7,558.7 |
-5,091.3 |
|
Issuance (Retirement) of Debt, Net |
-2,376.8 |
-1,040.2 |
3,435.1 |
603.3 |
740.6 |
|
Cash from Financing Activities |
-7,583.2 |
-3,574.4 |
507.0 |
-9,197.4 |
-1,578.3 |
|
|
|
|
|
|
|
|
Foreign Exchange Effects |
7.0 |
225.6 |
-52.7 |
-148.6 |
-77.1 |
|
Net Change in Cash |
-2,389.4 |
5,434.6 |
4,427.4 |
2,984.8 |
-7,012.6 |
|
|
|
|
|
|
|
|
Net Cash - Beginning Balance |
19,821.2 |
13,784.4 |
9,367.2 |
7,413.2 |
13,581.1 |
|
Net Cash - Ending Balance |
17,431.8 |
19,219.1 |
13,794.6 |
10,397.9 |
6,568.5 |
|
Cash Interest Paid |
661.8 |
590.3 |
1,026.1 |
1,244.0 |
1,554.4 |
|
Cash Taxes Paid |
2,252.8 |
2,535.6 |
2,076.5 |
2,347.0 |
2,566.2 |
Interim Cash Flows
Standardized
Financials in: USD (mil)
Except for share items (millions) and per share items (actual units)
|
|
30-Sep-2011 |
30-Jun-2011 |
31-Mar-2011 |
31-Dec-2010 |
30-Sep-2010 |
|
Period Length |
12 Months |
9 Months |
6 Months |
3 Months |
12 Months |
|
UpdateType/Date |
Updated Normal |
Updated Normal |
Updated Normal |
Updated Normal |
Reclassified
Normal |
|
Filed Currency |
EUR |
EUR |
EUR |
EUR |
EUR |
|
Exchange Rate
(Period Average) |
0.717768 |
0.72104 |
0.733879 |
0.736368 |
0.740255 |
|
|
|
|
|
|
|
|
Net Income/Starting Line |
9,767.8 |
8,020.4 |
6,840.4 |
2,380.6 |
5,757.5 |
|
Depreciation |
3,675.3 |
2,515.8 |
1,667.8 |
1,148.9 |
5,056.4 |
|
Depreciation/Depletion |
3,675.3 |
2,515.8 |
1,667.8 |
1,148.9 |
5,056.4 |
|
Discontinued Operations |
-402.6 |
-428.5 |
-404.7 |
- |
475.5 |
|
Unusual Items |
-291.2 |
-244.1 |
-147.2 |
-104.6 |
-352.6 |
|
Other Non-Cash Items |
1,207.9 |
552.0 |
-660.9 |
514.7 |
2,586.9 |
|
Non-Cash Items |
514.1 |
-120.7 |
-1,212.7 |
410.1 |
2,709.9 |
|
Accounts Receivable |
-848.5 |
-395.3 |
-265.7 |
-266.2 |
-71.6 |
|
Inventories |
-1,581.3 |
-2,962.4 |
-2,158.4 |
-886.8 |
72.9 |
|
Other Assets |
-1,407.1 |
-1,264.8 |
-1,007.0 |
-518.8 |
-1,049.6 |
|
Accounts Payable |
930.7 |
-380.0 |
222.1 |
-541.8 |
-20.3 |
|
Other Liabilities |
1,042.1 |
380.0 |
-802.6 |
445.4 |
1,346.8 |
|
Other Assets & Liabilities, Net |
-487.6 |
-334.2 |
-223.5 |
32.6 |
-278.3 |
|
Other Operating Cash Flow |
-784.4 |
-746.1 |
-501.4 |
-292.0 |
-894.3 |
|
Changes in Working Capital |
-3,136.1 |
-5,702.9 |
-4,736.5 |
-2,027.5 |
-894.3 |
|
Cash from Operating Activities |
10,821.0 |
4,712.6 |
2,559.0 |
1,912.1 |
12,629.4 |
|
|
|
|
|
|
|
|
Purchase of Fixed Assets |
-3,024.7 |
-1,805.7 |
-1,038.3 |
-651.8 |
-2,639.6 |
|
Capital Expenditures |
-3,024.7 |
-1,805.7 |
-1,038.3 |
-651.8 |
-2,639.6 |
|
Acquisition of Business |
-418.0 |
-337.0 |
-226.2 |
-173.8 |
-586.3 |
|
Sale of Business |
246.6 |
231.6 |
184.0 |
51.6 |
232.4 |
|
Sale/Maturity of Investment |
2,989.8 |
2,744.6 |
3,472.0 |
779.5 |
849.7 |
|
Purchase of Investments |
-1,380.7 |
-499.3 |
-407.4 |
-362.6 |
-724.1 |
|
Other Investing Cash Flow |
-4,047.3 |
-2,024.9 |
-575.0 |
124.9 |
-978.0 |
|
Other Investing Cash Flow Items, Total |
-2,609.5 |
115.1 |
2,447.3 |
419.6 |
-1,206.3 |
|
Cash from Investing Activities |
-5,634.1 |
-1,690.6 |
1,409.0 |
-232.2 |
-3,846.0 |
|
|
|
|
|
|
|
|
Other Financing Cash Flow |
-859.6 |
-674.0 |
-397.9 |
-213.2 |
-857.8 |
|
Financing Cash Flow Items |
-859.6 |
-674.0 |
-397.9 |
-213.2 |
-857.8 |
|
Cash Dividends Paid - Common |
-3,282.4 |
-3,267.5 |
-3,210.3 |
- |
-1,875.0 |
|
Total Cash Dividends Paid |
-3,282.4 |
-3,267.5 |
-3,210.3 |
- |
-1,875.0 |
|
Sale/Issuance of
Common |
-1,064.4 |
-1,067.9 |
258.9 |
110.0 |
198.6 |
|
Common Stock, Net |
-1,064.4 |
-1,067.9 |
258.9 |
110.0 |
198.6 |
|
Issuance (Retirement) of Stock, Net |
-1,064.4 |
-1,067.9 |
258.9 |
110.0 |
198.6 |
|
Short Term Debt, Net |
316.3 |
491.0 |
396.5 |
279.8 |
-979.4 |
|
Long Term Debt Issued |
157.4 |
156.7 |
154.0 |
153.5 |
0.0 |
|
Long Term Debt
Reduction |
-2,850.5 |
-51.3 |
-34.1 |
-16.3 |
-60.8 |
|
Long Term Debt, Net |
-2,693.1 |
105.4 |
119.9 |
137.2 |
-60.8 |
|
Issuance (Retirement) of Debt, Net |
-2,376.8 |
596.4 |
516.4 |
416.9 |
-1,040.2 |
|
Cash from Financing Activities |
-7,583.2 |
-4,413.1 |
-2,832.9 |
313.7 |
-3,574.4 |
|
|
|
|
|
|
|
|
Foreign Exchange Effects |
7.0 |
-31.9 |
-34.1 |
69.3 |
225.6 |
|
Net Change in Cash |
-2,389.4 |
-1,422.9 |
1,101.0 |
2,062.8 |
5,434.6 |
|
|
|
|
|
|
|
|
Net Cash - Beginning Balance |
19,821.2 |
19,731.2 |
19,386.0 |
19,320.5 |
13,784.4 |
|
Net Cash - Ending Balance |
17,431.8 |
18,308.3 |
20,487.0 |
21,383.3 |
19,219.1 |
|
Cash Interest Paid |
661.8 |
504.8 |
287.5 |
188.8 |
590.3 |
|
Cash Taxes Paid |
2,252.8 |
1,816.8 |
1,047.9 |
554.1 |
2,535.6 |
Annual
Income Statement
As Reported
Financials in: USD (mil)
Except for share items (millions) and per share items (actual units)
|
|
30-Sep-2010 |
30-Sep-2009 |
30-Sep-2008 |
30-Sep-2007 |
30-Sep-2006 |
|
Period Length |
12 Months |
12 Months |
12 Months |
12 Months |
12 Months |
|
UpdateType/Date |
Updated Normal |
Reclassified
Normal |
Updated Normal |
Updated Normal |
Restated Normal |
|
Filed Currency |
EUR |
EUR |
EUR |
EUR |
EUR |
|
Exchange Rate
(Period Average) |
0.740255 |
0.73971 |
0.666382 |
0.752073 |
0.813439 |
|
Auditor |
Ernst &
Young LLP |
Ernst &
Young LLP |
KPMG LLP |
KPMG LLP |
KPMG LLP |
|
Auditor Opinion |
Unqualified |
Unqualified |
Unqualified |
Unqualified |
Unqualified |
|
|
|
|
|
|
|
|
Net Sales |
102,637.7 |
103,623.0 |
116,040.1 |
96,331.1 |
81,735.6 |
|
Total Revenue |
102,637.7 |
103,623.0 |
116,040.1 |
96,331.1 |
81,735.6 |
|
|
|
|
|
|
|
|
Cost of Sales |
73,395.0 |
75,625.6 |
84,462.1 |
68,573.1 |
60,370.8 |
|
Research/Development |
5,195.5 |
5,272.3 |
5,678.4 |
4,519.5 |
3,799.9 |
|
Distribution/Gen. Admin. Expenses |
15,035.4 |
14,730.1 |
20,387.7 |
16,092.9 |
14,625.6 |
|
Other Operating Income |
-587.6 |
-405.6 |
-429.2 |
-259.3 |
-773.3 |
|
Income from Sale of Fixed Assets |
-387.7 |
-481.3 |
-471.2 |
-384.3 |
- |
|
Income From Sale of Business Units |
-181.0 |
-552.9 |
-670.8 |
-260.6 |
- |
|
Other Operating Expense |
406.6 |
607.0 |
2,984.8 |
1,222.0 |
319.6 |
|
Expense On Sale of Business Units |
158.1 |
91.9 |
168.1 |
63.8 |
- |
|
Expense on Sale of Fixed Assets |
64.8 |
112.2 |
73.5 |
114.4 |
- |
|
Goodwill Impairment |
1,546.8 |
43.3 |
117.0 |
- |
- |
|
Total Operating Expense |
94,645.8 |
95,042.6 |
112,300.5 |
89,681.4 |
78,342.6 |
|
|
|
|
|
|
|
|
Income from Investments |
-54.0 |
-2,630.8 |
390.2 |
143.6 |
496.7 |
|
Interest Income |
2,919.3 |
2,887.6 |
1,341.6 |
1,007.9 |
842.1 |
|
Interest Expense |
-2,553.2 |
-2,991.7 |
-1,251.5 |
-1,192.7 |
-645.4 |
|
Income from Pensions |
- |
- |
204.1 |
260.6 |
276.6 |
|
Income from AFS Financial Assets |
- |
- |
133.6 |
77.1 |
186.9 |
|
Other, Net |
-453.9 |
-585.4 |
-244.6 |
-163.5 |
-347.9 |
|
Net Income Before Taxes |
7,850.0 |
5,260.2 |
4,312.8 |
6,782.6 |
4,201.9 |
|
|
|
|
|
|
|
|
Provision for Income Taxes |
2,295.2 |
1,938.6 |
1,523.2 |
1,585.0 |
954.0 |
|
Net Income After Taxes |
5,554.8 |
3,321.6 |
2,789.7 |
5,197.6 |
3,247.9 |
|
|
|
|
|
|
|
|
Minority Interest |
-228.3 |
-277.1 |
-241.6 |
-308.5 |
-258.2 |
|
Net Income Before Extra. Items |
5,326.5 |
3,044.4 |
2,548.1 |
4,889.2 |
2,989.8 |
|
Discontinued Operations |
-59.4 |
54.1 |
6,043.1 |
171.5 |
864.2 |
|
Net Income |
5,267.1 |
3,098.5 |
8,591.2 |
5,060.7 |
3,854.0 |
|
|
|
|
|
|
|
|
Income Available to Com Excl ExtraOrd |
5,326.5 |
3,044.4 |
2,548.1 |
4,889.2 |
2,989.8 |
|
|
|
|
|
|
|
|
Income Available to Com Incl ExtraOrd |
5,267.1 |
3,098.5 |
8,591.2 |
5,060.7 |
3,854.0 |
|
|
|
|
|
|
|
|
Basic Weighted Average Shares |
868.2 |
864.8 |
893.2 |
898.1 |
874.8 |
|
Basic EPS Excluding ExtraOrdinary Items |
6.13 |
3.52 |
2.85 |
5.44 |
3.42 |
|
Basic EPS Including ExtraOrdinary Item |
6.07 |
3.58 |
9.62 |
5.63 |
4.41 |
|
Diluted Net Income |
5,267.1 |
3,098.5 |
8,591.2 |
5,060.7 |
3,854.0 |
|
Diluted Weighted Average Shares |
877.5 |
871.7 |
896.3 |
935.2 |
878.0 |
|
Diluted EPS Excluding ExtraOrd Items |
6.07 |
3.49 |
2.84 |
5.23 |
3.41 |
|
Diluted EPS Including ExtraOrd Items |
6.00 |
3.55 |
9.59 |
5.41 |
4.39 |
|
DPS-Common Stock |
3.65 |
2.16 |
2.40 |
2.13 |
1.78 |
|
Gross Dividends - Common Stock |
3,181.3 |
1,876.4 |
2,067.9 |
1,944.0 |
1,588.3 |
|
Normalized Income Before Taxes |
9,050.9 |
4,473.4 |
3,529.5 |
6,315.9 |
4,201.9 |
|
|
|
|
|
|
|
|
Inc Tax Ex Impact of Sp Items |
2,646.3 |
1,648.6 |
1,246.5 |
1,475.9 |
954.0 |
|
Normalized Income After Taxes |
6,404.7 |
2,824.7 |
2,283.0 |
4,840.0 |
3,247.9 |
|
|
|
|
|
|
|
|
Normalized Inc. Avail to Com. |
6,176.4 |
2,547.6 |
2,041.4 |
4,531.5 |
2,989.8 |
|
|
|
|
|
|
|
|
Basic Normalized EPS |
7.11 |
2.95 |
2.29 |
5.05 |
3.42 |
|
Diluted Normalized EPS |
7.04 |
2.92 |
2.28 |
4.85 |
3.41 |
|
Research & Development Expenses |
5,195.5 |
5,272.3 |
5,678.4 |
4,519.5 |
3,799.9 |
|
Interest Expenses |
2,553.2 |
2,991.7 |
1,251.5 |
1,192.7 |
645.4 |
|
Amortisation of Intangibles |
1,159.1 |
1,127.5 |
1,344.6 |
1,168.8 |
972.4 |
|
Rental Expenses |
1,569.7 |
1,619.6 |
1,431.6 |
1,163.5 |
1,003.1 |
|
Depreciation |
2,858.5 |
2,714.6 |
3,179.9 |
2,832.2 |
2,756.2 |
|
Current - Domestic Tax |
41.9 |
363.7 |
186.1 |
598.3 |
376.2 |
|
Current - Foreign Tax |
2,112.8 |
1,634.4 |
1,502.1 |
1,010.5 |
736.4 |
|
Current Tax - Total |
2,154.7 |
1,998.1 |
1,688.2 |
1,608.9 |
1,112.6 |
|
Deferred - Domestic Tax |
601.1 |
1.4 |
-318.1 |
-207.4 |
-163.5 |
|
Deferred - Foreign Tax |
-460.7 |
-60.8 |
153.1 |
183.5 |
4.9 |
|
Deferred Tax - Total |
140.5 |
-59.5 |
-165.1 |
-23.9 |
-158.6 |
|
Income Tax - Total |
2,295.2 |
1,938.6 |
1,523.2 |
1,585.0 |
954.0 |
|
Service Cost |
409.3 |
367.7 |
418.7 |
476.0 |
- |
|
Interest Cost |
1,114.5 |
1,153.2 |
1,148.0 |
964.0 |
- |
|
Expected Return on Plan Assets |
-1,134.7 |
-1,046.4 |
-1,394.1 |
-1,259.2 |
- |
|
Past Service Cost |
0.0 |
23.0 |
0.0 |
- |
- |
|
Settlements and Curtailments |
-1.4 |
-2.7 |
-39.0 |
0.0 |
- |
|
Actuarial Gains and Losses |
2,578.8 |
1,209.9 |
1,416.6 |
-656.9 |
- |
|
Domestic Pension Plan Expense |
2,966.5 |
1,704.7 |
1,550.2 |
-476.0 |
- |
|
Service Cost |
251.3 |
242.0 |
348.1 |
433.5 |
- |
|
Interest Cost |
678.1 |
701.6 |
721.8 |
675.5 |
- |
|
Expected Return on Plan Assets |
-686.3 |
-643.5 |
-813.3 |
-752.6 |
- |
|
Settlements and Curtailments |
-245.9 |
-48.7 |
-30.0 |
-5.3 |
- |
|
Actuarial Gains and Losses |
921.3 |
680.0 |
1,434.6 |
-1,260.5 |
- |
|
Past Service Costs |
23.0 |
-4.1 |
-1.5 |
- |
- |
|
Foreign Pension Plan Expense |
941.6 |
927.4 |
1,659.7 |
-909.5 |
- |
|
Service Cost |
21.6 |
20.3 |
27.0 |
31.9 |
- |
|
Interest Cost |
50.0 |
55.4 |
57.0 |
55.8 |
- |
|
Settlements and Curtailments |
-9.5 |
-12.2 |
-4.5 |
0.0 |
- |
|
Past Service Costs |
1.4 |
-40.6 |
12.0 |
13.3 |
- |
|
Post-Retirement Plan Expense |
63.5 |
23.0 |
91.5 |
101.1 |
- |
|
Defined Contribution Plan |
475.5 |
516.4 |
471.2 |
357.7 |
- |
|
Total Pension Expense |
4,447.1 |
3,171.5 |
3,772.6 |
-926.8 |
- |
|
Discount Rate - Germany |
4.00% |
5.30% |
6.40% |
5.10% |
- |
|
Discount Rate - USA |
4.80% |
5.69% |
6.79% |
- |
- |
|
Discount Rate - Great Britain |
5.30% |
5.70% |
6.50% |
- |
- |
|
Expected Return on Plan Assets - Germany |
6.50% |
6.50% |
6.50% |
- |
- |
|
Expected Return on Plan Assets - USA |
6.95% |
6.97% |
6.97% |
- |
- |
|
Expected Return on Plan Assets - GB |
6.00% |
6.50% |
6.70% |
- |
- |
|
Compensation Rate - Germany |
2.25% |
2.25% |
2.25% |
2.25% |
- |
|
Compensation Rate - USA |
3.52% |
3.76% |
4.05% |
- |
- |
|
Compensation Rate - GB |
5.00% |
4.90% |
4.50% |
- |
- |
|
Compensation Rate - Switzerland |
1.50% |
1.50% |
2.50% |
- |
- |
|
Compensation Rate - Netherlands |
2.95% |
2.95% |
2.95% |
- |
- |
Interim Income
Statement
As Reported
Financials in: USD (mil)
Except for share items (millions) and per share items (actual units)
|
|
30-Jun-2011 |
31-Mar-2011 |
31-Dec-2010 |
30-Sep-2010 |
30-Jun-2010 |
|
Period Length |
3 Months |
3 Months |
3 Months |
3 Months |
3 Months |
|
UpdateType/Date |
Updated Normal |
Updated Normal |
Restated
Calculated |
Updated Normal |
Restated Normal |
|
Filed Currency |
EUR |
EUR |
EUR |
EUR |
EUR |
|
Exchange Rate
(Period Average) |
0.695476 |
0.731463 |
0.736368 |
0.774922 |
0.785482 |
|
|
|
|
|
|
|
|
Revenue |
25,657.2 |
24,221.3 |
23,905.2 |
27,395.0 |
22,183.8 |
|
Total Revenue |
25,657.2 |
24,221.3 |
23,905.2 |
27,395.0 |
22,183.8 |
|
|
|
|
|
|
|
|
Costs of Sales |
18,210.5 |
16,672.1 |
16,235.1 |
20,556.9 |
15,436.4 |
|
Research/Development |
1,351.6 |
1,322.0 |
1,173.3 |
1,507.2 |
1,105.1 |
|
Selling/Gen. Admin. Expenses |
3,711.1 |
3,426.0 |
3,274.2 |
4,115.3 |
3,195.5 |
|
Other Operating Income |
-57.5 |
-49.2 |
-211.9 |
-143.2 |
-76.4 |
|
Gain on Busin. Sale |
0.0 |
-26.0 |
-5.4 |
-59.4 |
-42.0 |
|
Gain on Asset Sale |
-94.9 |
-31.4 |
-135.8 |
-55.5 |
-120.9 |
|
Other Operating Expenses |
51.8 |
83.4 |
253.9 |
329.1 |
77.7 |
|
Loss on Sale of Assets |
-2.9 |
15.0 |
36.7 |
27.1 |
28.0 |
|
Impairment of Goodwill |
- |
- |
- |
1,477.6 |
- |
|
Total Operating Expense |
23,169.7 |
21,411.9 |
20,620.1 |
27,755.1 |
19,603.2 |
|
|
|
|
|
|
|
|
Income from Equity Investments |
-61.8 |
125.8 |
167.0 |
-161.3 |
52.2 |
|
Financial Income, Net |
-1,058.3 |
2,026.1 |
-97.8 |
-209.1 |
-140.0 |
|
Interest Income |
790.8 |
742.3 |
744.2 |
736.8 |
653.1 |
|
Interest Expense |
-609.7 |
-594.7 |
-569.0 |
-624.6 |
-555.1 |
|
Net Income Before Taxes |
1,548.6 |
5,108.9 |
3,529.5 |
-618.1 |
2,590.8 |
|
|
|
|
|
|
|
|
Provision for Income Taxes |
451.5 |
769.7 |
1,022.6 |
-180.7 |
772.8 |
|
Net Income After Taxes |
1,097.1 |
4,339.2 |
2,506.9 |
-437.5 |
1,818.0 |
|
|
|
|
|
|
|
|
Minority Interests |
-56.1 |
-58.8 |
-47.5 |
-91.6 |
-30.6 |
|
Net Income Before Extra. Items |
1,041.0 |
4,280.5 |
2,459.4 |
-529.1 |
1,787.4 |
|
Discontinued Operations |
-376.7 |
-462.1 |
-126.3 |
-73.6 |
8.9 |
|
Net Income |
664.3 |
3,818.4 |
2,333.1 |
-602.6 |
1,796.3 |
|
|
|
|
|
|
|
|
Income Available to Com Excl ExtraOrd |
1,041.0 |
4,280.5 |
2,459.4 |
-529.1 |
1,787.4 |
|
|
|
|
|
|
|
|
Income Available to Com Incl ExtraOrd |
664.3 |
3,818.4 |
2,333.1 |
-602.6 |
1,796.3 |
|
|
|
|
|
|
|
|
Basic Weighted Average Shares |
873.9 |
873.2 |
871.2 |
873.6 |
868.9 |
|
Basic EPS Excluding ExtraOrdinary Items |
1.19 |
4.90 |
2.82 |
-0.61 |
2.06 |
|
Basic EPS Including ExtraOrdinary Item |
0.76 |
4.37 |
2.68 |
-0.69 |
2.07 |
|
Dilution Adjustment |
- |
- |
- |
0.0 |
- |
|
Diluted Net Income |
664.3 |
3,818.4 |
2,333.1 |
-602.6 |
1,796.3 |
|
Diluted Weighted Average Shares |
883.4 |
882.4 |
880.8 |
873.6 |
877.8 |
|
Diluted EPS Excluding ExtraOrd Items |
1.18 |
4.85 |
2.79 |
-0.61 |
2.04 |
|
Diluted EPS Including ExtraOrd Items |
0.75 |
4.33 |
2.65 |
-0.69 |
2.05 |
|
DPS-Common Stock |
0.00 |
0.00 |
0.00 |
3.48 |
0.00 |
|
Gross Dividends - Common Stock |
0.0 |
0.0 |
0.0 |
3,039.0 |
0.0 |
|
Normalized Income Before Taxes |
1,450.8 |
5,066.6 |
3,424.9 |
771.7 |
2,455.8 |
|
|
|
|
|
|
|
|
Inc Tax Ex Impact of Sp Items |
423.0 |
763.3 |
992.3 |
305.8 |
732.5 |
|
Normalized Income After Taxes |
1,027.8 |
4,303.3 |
2,432.6 |
465.9 |
1,723.3 |
|
|
|
|
|
|
|
|
Normalized Inc. Avail to Com. |
971.7 |
4,244.5 |
2,385.1 |
374.3 |
1,692.7 |
|
|
|
|
|
|
|
|
Basic Normalized EPS |
1.11 |
4.86 |
2.74 |
0.43 |
1.95 |
|
Diluted Normalized EPS |
1.10 |
4.81 |
2.71 |
0.43 |
1.93 |
|
Research & Development Expenses |
1,351.6 |
1,322.0 |
1,173.3 |
1,507.2 |
1,105.1 |
|
Amortization of Intangibles |
284.7 |
268.0 |
266.2 |
326.5 |
250.8 |
|
Depreciation |
563.6 |
564.6 |
569.0 |
804.0 |
564.0 |
|
Interest Expenses |
609.7 |
594.7 |
569.0 |
624.6 |
555.1 |
|
Service Cost |
115.0 |
109.4 |
108.6 |
101.9 |
95.5 |
|
Interest Cost |
277.5 |
263.9 |
262.1 |
267.1 |
268.6 |
|
Expected Return on Assets |
-317.8 |
-303.5 |
-301.5 |
-271.0 |
-267.4 |
|
Amortization of Past Service Cost |
0.0 |
0.0 |
0.0 |
0.0 |
0.0 |
|
Settlements & Curtailments |
0.0 |
0.0 |
0.0 |
-1.3 |
0.0 |
|
Domestic Pension Plan Expense |
74.8 |
69.7 |
69.3 |
96.8 |
96.8 |
|
Service Cost |
56.1 |
49.2 |
91.0 |
61.9 |
75.1 |
|
Interest Cost |
179.7 |
187.3 |
188.8 |
166.5 |
187.1 |
|
Expected Return on Assets |
-199.9 |
-211.9 |
-213.2 |
-171.6 |
-180.8 |
|
Amortization of Past Service Cost |
-2.9 |
-4.1 |
-2.7 |
-11.6 |
-1.3 |
|
Settlements & Curtailments |
-2.9 |
0.0 |
-8.1 |
2.6 |
-30.6 |
|
Foreign Pension Plan Expense |
30.2 |
20.5 |
55.7 |
47.7 |
49.7 |
|
Defined Contribution Expense - Domestic |
15.8 |
20.5 |
21.7 |
- |
20.4 |
|
Total Pension Expense |
120.8 |
110.7 |
146.7 |
144.5 |
166.8 |
|
Discount Rate |
4.90% |
5.00% |
- |
4.20% |
4.20% |
Annual
Balance Sheet
As Reported
Financials in: USD
(mil)
Except for share
items (millions) and per share items (actual units)
|
|
30-Sep-2010 |
30-Sep-2009 |
30-Sep-2008 |
30-Sep-2007 |
30-Sep-2006 |
|
UpdateType/Date |
Updated Normal |
Reclassified
Normal |
Updated Normal |
Updated Normal |
Restated Normal |
|
Filed Currency |
EUR |
EUR |
EUR |
EUR |
EUR |
|
Exchange Rate |
0.732493 |
0.684135 |
0.711921 |
0.703161 |
0.789422 |
|
Auditor |
Ernst &
Young LLP |
Ernst &
Young LLP |
KPMG LLP |
KPMG LLP |
KPMG LLP |
|
Auditor Opinion |
Unqualified |
Unqualified |
Unqualified |
Unqualified |
Unqualified |
|
|
|
|
|
|
|
|
Cash/Equivalents |
19,260.2 |
14,849.4 |
9,682.3 |
5,695.7 |
12,938.6 |
|
ST Investments |
335.8 |
248.5 |
213.5 |
274.5 |
755.0 |
|
Trade Receivables |
18,001.5 |
18,579.7 |
22,172.4 |
20,791.8 |
19,188.7 |
|
Finance Lease |
2,436.9 |
2,540.4 |
- |
- |
- |
|
Derivatives |
1,295.6 |
1,143.0 |
- |
- |
- |
|
Other Financial Assets |
2,267.6 |
2,375.3 |
4,376.9 |
4,169.7 |
3,002.2 |
|
Raw Materials |
3,303.8 |
3,331.2 |
3,642.3 |
3,130.2 |
3,305.0 |
|
Work in Progress |
5,084.0 |
5,289.9 |
5,039.9 |
4,545.2 |
3,768.6 |
|
Excess Earnings |
10,290.9 |
10,432.2 |
10,586.8 |
10,095.8 |
8,974.9 |
|
Finished Goods |
3,912.7 |
4,304.7 |
3,982.2 |
3,637.9 |
3,222.6 |
|
Advance-Supplier |
896.9 |
825.9 |
1,115.3 |
1,068.0 |
844.9 |
|
Adv. - Rcvd. |
-3,078.5 |
-3,531.5 |
-3,986.4 |
-4,088.7 |
-3,914.3 |
|
Income Tax Receivables |
1,078.5 |
894.6 |
856.8 |
566.0 |
580.2 |
|
Other Receivables |
936.5 |
903.3 |
- |
- |
- |
|
Prepaid Expeneses |
404.1 |
463.4 |
- |
- |
- |
|
Other Current Assets |
376.8 |
374.2 |
1,469.3 |
1,389.4 |
1,273.1 |
|
Prepaid Expenses |
- |
- |
452.3 |
490.6 |
340.8 |
|
Assets for Sale |
976.1 |
755.7 |
1,136.4 |
16,400.2 |
9,075.0 |
|
Total Current Assets |
67,779.4 |
63,779.8 |
60,739.9 |
68,166.5 |
63,355.2 |
|
|
|
|
|
|
|
|
Investments Using Equity Method |
6,449.2 |
6,839.3 |
9,856.4 |
9,977.8 |
3,744.5 |
|
Goodwill, Net |
21,519.6 |
23,125.6 |
22,480.0 |
17,778.3 |
12,273.5 |
|
Derivatives |
3,676.5 |
3,053.5 |
- |
- |
- |
|
Receivables |
724.9 |
662.2 |
- |
- |
- |
|
Other Financial Assets |
11,019.9 |
11,668.8 |
10,935.2 |
7,908.6 |
6,387.0 |
|
Amortization |
-6,972.1 |
-6,076.3 |
- |
- |
- |
|
Intangible Assets, Net |
13,755.8 |
13,422.8 |
7,603.4 |
6,568.9 |
4,287.9 |
|
Land/Buildings |
11,735.3 |
12,662.7 |
11,557.5 |
12,286.0 |
12,414.2 |
|
Equip./Mach. |
12,634.9 |
12,627.6 |
11,591.2 |
11,213.7 |
12,388.8 |
|
Office Equipment |
9,279.3 |
9,489.4 |
9,346.5 |
9,585.3 |
10,648.3 |
|
Leased Equipment |
4,334.5 |
3,913.0 |
3,694.2 |
2,871.3 |
2,044.5 |
|
Constr. in Prog. |
1,520.8 |
1,407.6 |
1,657.5 |
1,271.4 |
1,393.4 |
|
Depreciation |
-23,466.4 |
-23,549.4 |
-22,033.3 |
-22,216.8 |
-23,597.0 |
|
Deferred Taxes |
5,378.9 |
4,810.5 |
4,226.6 |
3,689.1 |
4,632.5 |
|
Other Assets |
1,008.9 |
916.5 |
1,032.4 |
1,105.0 |
903.2 |
|
Total Assets |
140,379.4 |
138,753.3 |
132,687.5 |
130,204.9 |
110,876.1 |
|
|
|
|
|
|
|
|
Notes/Bonds |
2,815.0 |
0.0 |
1,438.4 |
985.5 |
1,455.5 |
|
Bank Loans |
386.4 |
381.5 |
672.8 |
679.8 |
834.8 |
|
Other Loans |
30.0 |
573.0 |
372.2 |
6,283.1 |
397.8 |
|
Lease Oblig. |
66.9 |
65.8 |
71.6 |
68.3 |
67.1 |
|
Accounts Payable |
10,757.8 |
11,098.7 |
12,445.2 |
11,920.5 |
10,695.2 |
|
Derivatives |
603.4 |
663.6 |
- |
- |
- |
|
Accrued Expenses |
446.4 |
475.1 |
- |
- |
- |
|
Other Current Financial Liabilities |
862.8 |
1,200.1 |
3,409.1 |
3,630.7 |
2,443.6 |
|
Accrued Liabs. |
7,014.4 |
6,126.0 |
7,255.0 |
5,092.7 |
4,888.4 |
|
Income Tax Payables |
2,479.2 |
2,829.9 |
2,767.2 |
3,044.8 |
2,004.0 |
|
Deferred Income |
- |
- |
- |
- |
499.1 |
|
Acc. Expenses |
10,391.9 |
10,230.4 |
- |
- |
- |
|
Customer Advances |
18,016.5 |
17,775.7 |
- |
- |
- |
|
Other Liabilities |
1,344.7 |
1,682.4 |
30,402.2 |
24,259.0 |
19,250.8 |
|
Assets Held for Disposal |
199.3 |
229.5 |
795.0 |
6,459.4 |
6,821.4 |
|
Total Current Liabilities |
55,414.8 |
53,331.6 |
59,628.8 |
62,423.9 |
49,357.6 |
|
|
|
|
|
|
|
|
Bonds/Notes |
20,802.9 |
24,121.0 |
16,774.3 |
11,655.9 |
15,211.1 |
|
Bank Loans |
2,704.5 |
2,791.8 |
2,607.0 |
1,238.7 |
433.2 |
|
Other Loans |
213.0 |
554.0 |
393.3 |
789.3 |
643.5 |
|
Lease Oblig. |
166.6 |
217.8 |
255.6 |
338.5 |
334.4 |
|
Other Financial Liabilities |
1,351.5 |
1,032.0 |
528.1 |
584.5 |
314.2 |
|
Total Long Term Debt |
25,238.5 |
28,716.6 |
20,558.5 |
14,606.9 |
16,936.4 |
|
|
|
|
|
|
|
|
Pensions/Similar |
11,555.1 |
8,679.6 |
6,125.7 |
3,953.6 |
6,438.9 |
|
Deferred Taxes |
787.7 |
1,134.3 |
1,019.8 |
824.8 |
233.1 |
|
Other Accrued |
4,548.8 |
4,050.4 |
3,558.0 |
2,990.8 |
2,353.6 |
|
Minority Int. |
1,023.9 |
936.9 |
851.2 |
897.4 |
889.3 |
|
Other Liabilities |
3,112.7 |
2,955.6 |
3,337.4 |
3,270.9 |
2,753.9 |
|
Total Liabilities |
101,681.5 |
99,804.9 |
95,079.4 |
88,968.3 |
78,962.9 |
|
|
|
|
|
|
|
|
Common Stock |
3,744.7 |
4,009.4 |
3,853.0 |
3,901.0 |
3,386.0 |
|
Paid in Capital |
8,172.1 |
8,691.3 |
8,423.7 |
8,646.7 |
7,172.3 |
|
Retained Earnings |
31,396.9 |
33,101.7 |
32,291.5 |
29,087.2 |
21,157.3 |
|
Other Income |
-10.9 |
-1,545.0 |
-1,338.6 |
-398.2 |
197.6 |
|
Treasury Stock |
-4,604.8 |
-5,308.9 |
-5,621.4 |
0.0 |
- |
|
Total Equity |
38,698.0 |
38,948.5 |
37,608.1 |
41,236.7 |
31,913.2 |
|
|
|
|
|
|
|
|
Total Liabilities & Shareholders' Equity |
140,379.4 |
138,753.3 |
132,687.5 |
130,204.9 |
110,876.1 |
|
|
|
|
|
|
|
|
S/O-Common Stock |
869.8 |
866.4 |
861.6 |
914.2 |
891.1 |
|
Total Common Shares Outstanding |
869.8 |
866.4 |
861.6 |
914.2 |
891.1 |
|
T/S-Common Stock |
44.4 |
47.8 |
52.6 |
0.0 |
0.0 |
|
Deferred Revenue - Current |
18,016.5 |
17,775.7 |
15,999.0 |
797.8 |
499.1 |
|
Deferred Revenue - Long Term |
374.1 |
283.6 |
- |
- |
- |
|
Accu. Amortisation of Intangibles |
6,972.1 |
6,076.3 |
5,061.0 |
4,478.4 |
3,810.4 |
|
Full-Time Employees |
405,000 |
405,000 |
427,000 |
398,000 |
371,000 |
|
Long Term Debt Maturing Within 1 Year |
3,232.8 |
954.5 |
2,411.8 |
- |
- |
|
Long Term Debt Maturing Within 2 Years |
3,631.4 |
3,278.6 |
209.3 |
- |
- |
|
Long Term Debt Maturing Within 3 Years |
4,458.7 |
3,793.1 |
2,868.3 |
- |
- |
|
Long Term Debt Maturing Within 4 Years |
1,512.6 |
4,677.4 |
3,475.1 |
- |
- |
|
Long Term Debt Maturing Within 5 Years |
940.6 |
1,625.4 |
1,647.7 |
- |
- |
|
Long Term Debt Maturing Thereafter |
13,175.5 |
14,092.2 |
11,318.7 |
- |
- |
|
Total Long Term Debt, Supplemental |
26,951.8 |
28,421.3 |
21,930.8 |
- |
- |
|
Capital Lease Maturing Within 1 Year |
66.9 |
65.8 |
71.6 |
68.3 |
- |
|
Capital Lease Maturing Within 2 Years |
24.6 |
61.4 |
28.1 |
72.5 |
- |
|
Capital Lease Maturing Within 3 Years |
32.8 |
19.0 |
37.9 |
28.4 |
- |
|
Capital Lease Maturing Within 4 Years |
6.8 |
24.8 |
56.2 |
83.9 |
- |
|
Capital Lease Maturing Within 5 Years |
6.8 |
7.3 |
23.9 |
11.4 |
- |
|
Capital Lease Maturing Thereafter |
95.6 |
105.2 |
109.6 |
142.2 |
- |
|
Total Capital Leases |
233.4 |
283.6 |
327.3 |
406.7 |
- |
|
Operating Lease Maturing Within 1 Year |
984.3 |
1,011.5 |
886.3 |
826.3 |
- |
|
Operating Lease Maturing Within 2 Years |
753.6 |
754.2 |
679.9 |
675.5 |
- |
|
Operating Lease Maturing Within 3 Years |
569.3 |
552.5 |
507.1 |
514.8 |
- |
|
Operating Lease Maturing Within 4 Years |
451.9 |
423.9 |
401.7 |
371.2 |
- |
|
Operating Lease Maturing Within 5 Years |
383.6 |
350.8 |
368.0 |
312.9 |
- |
|
Operating Lease Maturing Thereafter |
1,124.9 |
996.9 |
970.6 |
783.6 |
- |
|
Total Operating Leases |
4,267.6 |
4,089.8 |
3,813.6 |
3,484.3 |
- |
|
Pension Obligation |
40,490.5 |
36,774.9 |
31,820.9 |
35,627.7 |
- |
|
Fair Value of Plan Assets |
31,811.9 |
30,906.2 |
28,365.5 |
34,150.1 |
- |
|
Funded Status |
-8,678.6 |
-5,868.7 |
-3,455.4 |
-1,477.6 |
- |
|
Total Funded Status |
-8,678.6 |
-5,868.7 |
-3,455.4 |
-1,477.6 |
- |
|
Discount Rate - Germany |
4.00% |
5.30% |
6.40% |
6.90% |
- |
|
Discount Rate - USA |
4.80% |
5.69% |
6.79% |
- |
- |
|
Discount Rate - Great Britain |
5.30% |
5.70% |
6.50% |
- |
- |
|
Compensation Rate - Germany |
2.25% |
2.25% |
2.25% |
2.25% |
- |
|
Compensation Rate - USA |
3.52% |
3.76% |
4.05% |
- |
- |
|
Compensation Rate - GB |
5.00% |
4.90% |
4.50% |
- |
- |
|
Compensation Rate - Switzerland |
1.50% |
1.50% |
2.50% |
- |
- |
|
Compensation Rate - Netherlands |
2.95% |
2.95% |
2.95% |
- |
- |
|
Expected Rate of Return - Germany |
6.50% |
6.50% |
6.50% |
- |
- |
|
Expected Rate of Return - USA |
6.95% |
6.97% |
6.97% |
- |
- |
|
Expected Rate of Return - Great Britain |
6.00% |
6.50% |
6.70% |
- |
- |
|
Equity Securities - Domestic |
27.00% |
27.00% |
29.00% |
33.00% |
- |
|
Equity Securities - Foreign |
28.00% |
29.00% |
29.00% |
- |
- |
|
Fixed Income - Domestic |
62.00% |
62.00% |
62.00% |
54.00% |
- |
|
Fixed Income - Foreign |
61.00% |
59.00% |
61.00% |
- |
- |
|
Real Estate - Domestic |
6.00% |
8.00% |
8.00% |
8.00% |
- |
|
Real Estate - Foreign |
9.00% |
9.00% |
10.00% |
- |
- |
|
Cash & Other - Domestic |
5.00% |
3.00% |
1.00% |
5.00% |
- |
|
Cash & Other - Foreign |
2.00% |
3.00% |
0.00% |
- |
- |
Interim
Balance Sheet
As Reported
Financials in: USD (mil)
Except for share items (millions) and per share items (actual units)
|
|
|
|
30-Jun-2011 |
31-Mar-2011 |
31-Dec-2010 |
30-Sep-2010 |
30-Jun-2010 |
|
UpdateType/Date |
Updated Normal |
Updated Normal |
Updated Normal |
Updated Normal |
Updated Normal |
|
Filed Currency |
EUR |
EUR |
EUR |
EUR |
EUR |
|
Exchange Rate |
0.689727 |
0.704672 |
0.745406 |
0.732493 |
0.816393 |
|
|
|
|
|
|
|
|
Cash/Equivalents |
18,856.7 |
21,248.2 |
21,011.4 |
19,260.2 |
14,489.3 |
|
Marketable Secs. - Held for Sale |
616.2 |
610.2 |
324.7 |
335.8 |
320.9 |
|
Accounts Receivable |
19,931.1 |
19,475.7 |
20,398.3 |
20,438.4 |
18,706.7 |
|
Other Current Financial Assets |
4,359.7 |
4,326.8 |
3,811.3 |
3,563.2 |
3,072.0 |
|
Inventories |
23,014.9 |
21,744.9 |
21,255.5 |
20,409.7 |
19,970.8 |
|
Income Tax Receivables |
1,171.5 |
1,047.3 |
1,065.2 |
1,078.5 |
951.7 |
|
Other Current Assets |
1,851.5 |
1,840.6 |
1,858.0 |
1,717.4 |
1,613.2 |
|
Assets Held for Sale |
8,275.7 |
7,372.2 |
1,224.8 |
976.1 |
832.9 |
|
Total Current Assets |
78,077.3 |
77,665.9 |
70,949.2 |
67,779.4 |
59,957.6 |
|
|
|
|
|
|
|
|
Goodwill, Net |
22,097.2 |
21,742.0 |
21,490.3 |
21,519.6 |
22,017.6 |
|
Intangibles, Net |
- |
- |
- |
6,783.7 |
6,569.1 |
|
Intangibles Gross |
13,395.2 |
13,067.1 |
13,779.1 |
- |
- |
|
Intangible Amortization |
-7,043.4 |
-6,733.6 |
-7,188.0 |
- |
- |
|
Property/Equip., Net |
14,447.8 |
14,039.2 |
15,850.4 |
16,038.4 |
14,676.8 |
|
Equity in Affiliates |
6,451.8 |
6,674.0 |
6,809.7 |
6,449.2 |
5,976.3 |
|
Other Financial Assets |
14,250.6 |
13,237.4 |
13,502.7 |
15,421.3 |
13,642.9 |
|
Deferred Taxes |
4,243.7 |
3,983.4 |
4,541.1 |
5,378.9 |
4,633.8 |
|
Other Assets |
980.1 |
962.1 |
1,046.4 |
1,008.9 |
874.6 |
|
Total Assets |
146,900.3 |
144,637.5 |
140,780.9 |
140,379.4 |
128,348.7 |
|
|
|
|
|
|
|
|
ST Debt/Cur.Port. |
7,182.6 |
7,087.0 |
5,434.6 |
3,231.4 |
501.0 |
|
Capital Lease |
24.6 |
31.2 |
- |
66.9 |
60.0 |
|
Accounts Payable |
9,618.3 |
10,023.1 |
10,158.2 |
10,757.8 |
9,282.3 |
|
Other Current Financial Liabilities |
2,431.4 |
3,519.4 |
2,463.1 |
1,912.6 |
3,009.6 |
|
Current Provisions |
6,972.3 |
6,977.7 |
7,139.7 |
7,014.4 |
5,844.0 |
|
Income Taxes Payable |
2,467.6 |
2,545.9 |
2,373.2 |
2,479.2 |
2,687.4 |
|
Other Current Liabilities |
29,558.1 |
28,120.9 |
29,705.9 |
29,753.2 |
25,989.9 |
|
Liabs. Held for Sales |
4,532.2 |
4,216.1 |
199.9 |
199.3 |
172.7 |
|
Total Current Liabilities |
62,787.2 |
62,521.3 |
57,474.7 |
55,414.8 |
47,546.9 |
|
|
|
|
|
|
|
|
L/T Debt |
20,384.9 |
19,958.2 |
21,003.3 |
23,720.4 |
24,387.8 |
|
Financial Lease |
189.9 |
187.3 |
- |
166.6 |
149.4 |
|
Other Financial Liabilities |
1,071.4 |
1,023.2 |
1,300.0 |
1,351.5 |
1,858.2 |
|
Total Long Term Debt |
21,646.3 |
21,168.7 |
22,303.3 |
25,238.5 |
26,395.4 |
|
|
|
|
|
|
|
|
Pension/Similar |
8,694.8 |
8,294.6 |
9,704.8 |
11,555.1 |
9,865.3 |
|
Deferred Taxes |
996.0 |
1,009.0 |
886.8 |
787.7 |
982.4 |
|
Other Accrued |
4,333.6 |
4,224.7 |
4,232.6 |
4,548.8 |
3,693.1 |
|
Minority Interest |
797.4 |
806.0 |
1,026.3 |
1,023.9 |
844.0 |
|
Other Liabilities |
2,711.2 |
2,741.7 |
3,172.8 |
3,112.7 |
2,860.1 |
|
Total Liabilities |
101,966.5 |
100,766.0 |
98,801.1 |
101,681.5 |
92,187.2 |
|
|
|
|
|
|
|
|
Common Stock |
3,976.9 |
3,892.6 |
3,679.9 |
3,744.7 |
3,359.9 |
|
Paid-in Capital |
8,677.4 |
8,446.5 |
7,913.8 |
8,172.1 |
7,272.2 |
|
Retained Earnings |
37,082.8 |
36,090.6 |
34,216.2 |
31,396.9 |
29,292.3 |
|
Other Equity |
-374.1 |
-200.1 |
419.9 |
-10.9 |
439.7 |
|
Treasury Stock |
-4,429.3 |
-4,358.1 |
-4,250.0 |
-4,604.8 |
-4,202.6 |
|
Total Equity |
44,933.8 |
43,871.5 |
41,979.8 |
38,698.0 |
36,161.5 |
|
|
|
|
|
|
|
|
Total Liabilities & Shareholders' Equity |
146,900.3 |
144,637.5 |
140,780.9 |
140,379.4 |
128,348.7 |
|
|
|
|
|
|
|
|
S/O-Common Stock |
874.0 |
873.8 |
872.5 |
869.8 |
869.1 |
|
Total Common Shares Outstanding |
874.0 |
873.8 |
872.5 |
869.8 |
869.1 |
|
T/S-Common Stock |
40.2 |
40.4 |
41.7 |
44.4 |
45.1 |
|
Amortization of Intangibles |
7,043.4 |
6,733.6 |
7,188.0 |
6,972.1 |
6,331.5 |
|
Full-Time Employees |
353,000 |
347,000 |
410,000 |
336,000 |
402,000 |
|
Discount Rate |
4.90% |
5.00% |
4.20% |
4.20% |
4.60% |
Annual
Cash Flows
As Reported
Financials in: USD (mil)
Except for share items (millions) and per share items (actual units)
|
|
30-Sep-2010 |
30-Sep-2009 |
30-Sep-2008 |
30-Sep-2007 |
30-Sep-2006 |
|
Period Length |
12 Months |
12 Months |
12 Months |
12 Months |
12 Months |
|
UpdateType/Date |
Updated Normal |
Reclassified
Normal |
Updated Normal |
Updated Normal |
Reclassified
Normal |
|
Filed Currency |
EUR |
EUR |
EUR |
EUR |
EUR |
|
Exchange Rate
(Period Average) |
0.740255 |
0.73971 |
0.666382 |
0.752073 |
0.813439 |
|
Auditor |
Ernst &
Young LLP |
Ernst &
Young LLP |
KPMG LLP |
KPMG LLP |
KPMG LLP |
|
Auditor Opinion |
Unqualified |
Unqualified |
Unqualified |
Unqualified |
Unqualified |
|
|
|
|
|
|
|
|
Net Income |
5,495.4 |
3,375.6 |
8,832.8 |
5,369.2 |
4,112.2 |
|
Depreciation |
5,563.0 |
3,881.2 |
4,821.6 |
4,987.5 |
3,833.1 |
|
Income Taxes |
2,280.3 |
2,017.0 |
1,247.0 |
2,915.9 |
952.7 |
|
Net Interest |
-366.1 |
93.3 |
-112.5 |
256.6 |
-174.6 |
|
Gain on Asset Sale |
-413.4 |
-586.7 |
-7,641.3 |
-2,727.1 |
-138.9 |
|
Gain on Investments |
-97.3 |
-474.5 |
-52.5 |
-126.3 |
-127.9 |
|
Gain on Securities |
17.6 |
14.9 |
-7.5 |
42.5 |
-572.9 |
|
Investment Income |
79.7 |
2,668.6 |
-492.2 |
-296.5 |
-699.5 |
|
Other Non-Cash Items |
-79.7 |
478.6 |
574.7 |
140.9 |
457.3 |
|
Inventories |
-101.3 |
-83.8 |
-2,447.5 |
-1,311.0 |
-2,843.5 |
|
Accounts Receivable |
-68.9 |
1,492.5 |
-1,632.7 |
-1,573.0 |
-1,262.5 |
|
Other Current Assets |
-278.3 |
139.2 |
250.6 |
-646.2 |
703.2 |
|
Accounts Payable |
151.3 |
-1,446.5 |
1,079.0 |
1,539.7 |
343.0 |
|
Accrued Liabilities |
849.7 |
-742.2 |
2,121.9 |
-343.1 |
-41.8 |
|
Other Current Liabs. |
1,765.6 |
-1,030.1 |
6,628.3 |
3,800.2 |
2,523.9 |
|
Other Assets/Liabs. |
-347.2 |
-482.6 |
300.1 |
-1,174.1 |
50.4 |
|
Income Taxes Paid |
-2,635.6 |
-2,076.5 |
-2,347.0 |
-2,566.2 |
-1,464.2 |
|
Dividends Received |
726.8 |
596.2 |
505.7 |
448.1 |
464.7 |
|
Interest Received |
929.4 |
1,039.6 |
1,313.1 |
1,006.6 |
842.1 |
|
Assets |
-841.6 |
-625.9 |
- |
- |
- |
|
Cash from Operating Activities |
12,629.4 |
8,247.8 |
12,941.5 |
9,743.7 |
6,956.9 |
|
|
|
|
|
|
|
|
Capital Expenditures |
-3,155.7 |
-3,325.6 |
-5,583.9 |
-4,987.5 |
-4,981.3 |
|
Acquisitions |
-655.2 |
-281.2 |
-8,114.0 |
-9,799.6 |
-2,526.3 |
|
Purch. Investments |
-570.1 |
-1,314.0 |
-226.6 |
-347.0 |
-478.2 |
|
Purchase Secs. |
-186.4 |
-70.3 |
-24.0 |
-196.8 |
-1,830.5 |
|
Receivables from Financing |
-259.4 |
-669.2 |
-3,669.1 |
-1,206.0 |
-576.6 |
|
Sale of Assets |
795.7 |
1,654.7 |
1,205.0 |
1,384.2 |
1,123.6 |
|
Sale of Businesses |
125.6 |
-316.3 |
15,728.2 |
-505.3 |
-319.6 |
|
Sale of Securities |
59.4 |
47.3 |
73.5 |
557.1 |
3,815.9 |
|
Cash from Investing Activities |
-3,846.0 |
-4,274.6 |
-610.8 |
-15,100.9 |
-5,773.0 |
|
|
|
|
|
|
|
|
Issuance of Common |
- |
- |
0.0 |
1,200.7 |
0.0 |
|
Repurchase of Stock |
- |
- |
-6,527.8 |
-134.3 |
-517.6 |
|
Issue of Treasury |
198.6 |
181.2 |
372.2 |
87.8 |
384.8 |
|
Issuance of Debt |
0.0 |
5,371.0 |
8,595.7 |
1,018.5 |
8,237.9 |
|
Repayment of Debt |
-60.8 |
-1,454.6 |
-1,036.9 |
-6,109.8 |
-2,102.2 |
|
S/T Debt Changes |
-974.0 |
-481.3 |
-6,955.5 |
5,831.9 |
-2,166.1 |
|
Interest Paid |
-594.4 |
-1,026.1 |
-1,244.0 |
-1,554.4 |
-732.7 |
|
Dividends Paid |
-1,875.0 |
-1,865.6 |
-2,193.9 |
-1,717.9 |
-1,476.4 |
|
Minority Dividends |
-268.8 |
-217.7 |
-207.1 |
-200.8 |
-145.1 |
|
Cash from Financing Activities |
-3,574.4 |
507.0 |
-9,197.4 |
-1,578.3 |
1,482.6 |
|
|
|
|
|
|
|
|
Foreign Exchange Effects |
225.6 |
-52.7 |
-148.6 |
-77.1 |
-93.4 |
|
Net Change in Cash |
5,434.6 |
4,427.4 |
2,984.8 |
-7,012.6 |
2,573.0 |
|
|
|
|
|
|
|
|
Net Cash - Beginning Balance |
13,784.4 |
9,367.2 |
7,413.2 |
13,581.1 |
9,983.5 |
|
Net Cash - Ending Balance |
19,219.1 |
13,794.6 |
10,397.9 |
6,568.5 |
12,556.6 |
|
Cash Interest Paid |
594.4 |
1,026.1 |
1,244.0 |
1,554.4 |
732.7 |
|
Cash Taxes Paid |
2,635.6 |
2,076.5 |
2,347.0 |
2,566.2 |
1,464.2 |
Interim
Cash Flows
As Reported
Financials in: USD (mil)
Except for share items (millions) and per share items (actual units)
|
|
30-Jun-2011 |
31-Mar-2011 |
31-Dec-2010 |
30-Sep-2010 |
30-Jun-2010 |
|
Period Length |
9 Months |
6 Months |
3 Months |
12 Months |
9 Months |
|
UpdateType/Date |
Updated Normal |
Updated Normal |
Updated Normal |
Updated Normal |
Reclassified
Normal |
|
Filed Currency |
EUR |
EUR |
EUR |
EUR |
EUR |
|
Exchange Rate
(Period Average) |
0.72104 |
0.733879 |
0.736368 |
0.740255 |
0.728766 |
|
|
|
|
|
|
|
|
Net Income/Continuing Operations |
8,020.4 |
6,840.4 |
2,380.6 |
5,495.4 |
5,905.9 |
|
Depreciation |
2,515.8 |
1,667.8 |
1,148.9 |
5,563.0 |
2,502.9 |
|
Income Taxes |
2,260.6 |
1,793.2 |
1,078.3 |
2,280.3 |
2,387.6 |
|
Interest Income/Expense, Net |
-503.4 |
-322.9 |
-177.9 |
-366.1 |
-267.6 |
|
Gain on Asset Sale |
-244.1 |
-147.2 |
-104.6 |
-413.4 |
-413.0 |
|
Gain on Investments |
-1,357.8 |
-2,270.1 |
-12.2 |
-97.3 |
-30.2 |
|
Gain on Securities |
-2.8 |
-2.7 |
-1.4 |
17.6 |
-2.7 |
|
Income from Investments |
-36.1 |
-139.0 |
-173.8 |
79.7 |
-134.5 |
|
Other Non-cash Items |
298.2 |
238.5 |
-69.3 |
-79.7 |
-517.3 |
|
Inventories |
-2,962.4 |
-2,158.4 |
-886.8 |
-101.3 |
-975.6 |
|
Accounts Receivable |
-395.3 |
-265.7 |
-266.2 |
-68.9 |
285.4 |
|
Other Current Assets |
-643.5 |
-600.9 |
-363.9 |
-278.3 |
65.9 |
|
Accounts Payable |
-380.0 |
222.1 |
-541.8 |
151.3 |
-750.6 |
|
Short Term Provisions |
-106.8 |
42.2 |
-129.0 |
849.7 |
455.6 |
|
Other Current Liabs. |
380.0 |
-802.6 |
445.4 |
1,765.6 |
200.3 |
|
Other Assets/Liabs. |
-334.2 |
-223.5 |
32.6 |
-347.2 |
-478.9 |
|
Additions to Assets for Rent |
-621.3 |
-406.1 |
-154.8 |
-841.6 |
-577.7 |
|
Income Taxes Paid |
-1,816.8 |
-1,047.9 |
-554.1 |
-2,635.6 |
-1,760.5 |
|
Dividends Received |
289.9 |
53.1 |
19.0 |
726.8 |
669.6 |
|
Interest Received |
780.8 |
493.3 |
243.1 |
929.4 |
686.1 |
|
Discontinued Operations |
-428.5 |
-404.7 |
- |
- |
175.6 |
|
Cash from Operating Activities |
4,712.6 |
2,559.0 |
1,912.1 |
12,629.4 |
7,426.3 |
|
|
|
|
|
|
|
|
Capital Expenditures |
-1,805.7 |
-1,038.3 |
-651.8 |
-3,155.7 |
-1,608.2 |
|
Acquisitions |
-337.0 |
-226.2 |
-173.8 |
-655.2 |
-599.6 |
|
Purchase Investments |
-478.5 |
-399.2 |
-361.2 |
-570.1 |
-200.3 |
|
Purchase Securities |
-20.8 |
-8.2 |
-1.4 |
-186.4 |
-171.5 |
|
Receivables from Financing |
-825.2 |
-230.3 |
124.9 |
-259.4 |
37.0 |
|
Sale of Investments, Assets |
2,726.6 |
3,457.0 |
770.0 |
795.7 |
624.3 |
|
Sale of Businesses |
231.6 |
184.0 |
51.6 |
125.6 |
160.5 |
|
Sale of Securities |
18.0 |
15.0 |
9.5 |
59.4 |
56.3 |
|
Discontinued Operations |
-1,199.7 |
-344.7 |
- |
- |
-436.4 |
|
Cash from Investing Activities |
-1,690.6 |
1,409.0 |
-232.2 |
-3,846.0 |
-2,137.9 |
|
|
|
|
|
|
|
|
Issuance of Treasury |
-1,067.9 |
258.9 |
110.0 |
198.6 |
126.2 |
|
Issuance of LT Debt |
156.7 |
154.0 |
153.5 |
0.0 |
0.0 |
|
Repayment of Debt |
-51.3 |
-34.1 |
-16.3 |
-60.8 |
0.0 |
|
S/T Change in Debt |
491.0 |
396.5 |
279.8 |
-974.0 |
-1,036.0 |
|
Interest Paid |
-504.8 |
-287.5 |
-188.8 |
-594.4 |
-470.7 |
|
Financing Discontinued Operations |
-1,597.7 |
-727.6 |
- |
- |
-266.2 |
|
Dividends Paid |
-3,267.5 |
-3,210.3 |
- |
-1,875.0 |
-1,904.6 |
|
Minority Dividends |
-199.7 |
-132.2 |
-24.4 |
-268.8 |
-133.1 |
|
Discontinued Operations |
1,628.2 |
749.4 |
- |
- |
260.7 |
|
Cash from Financing Activities |
-4,413.1 |
-2,832.9 |
313.7 |
-3,574.4 |
-3,423.6 |
|
|
|
|
|
|
|
|
Foreign Exchange Effects |
-31.9 |
-34.1 |
69.3 |
225.6 |
515.9 |
|
Net Change in Cash |
-1,422.9 |
1,101.0 |
2,062.8 |
5,434.6 |
2,380.7 |
|
|
|
|
|
|
|
|
Net Cash - Beginning Balance |
19,731.2 |
19,386.0 |
19,320.5 |
13,784.4 |
14,001.8 |
|
Net Cash - Ending Balance |
18,308.3 |
20,487.0 |
21,383.3 |
19,219.1 |
16,382.5 |
|
Cash Interest Paid |
504.8 |
287.5 |
188.8 |
594.4 |
470.7 |
|
Cash Taxes Paid |
1,816.8 |
1,047.9 |
554.1 |
2,635.6 |
1,760.5 |
FOREIGN EXCHANGE RATES
|
Currency |
Unit
|
Indian Rupees |
|
US Dollar |
1 |
Rs.53.21 |
|
UK Pound |
1 |
Rs.83.32 |
|
Euro |
1 |
Rs.69.51 |
RATING EXPLANATIONS
|
RATING |
STATUS |
PROPOSED CREDIT LINE |
|
|
>86 |
Aaa |
Possesses an extremely sound financial base with the strongest
capability for timely payment of interest and principal sums |
Unlimited |
|
71-85 |
Aa |
Possesses adequate working capital. No caution needed for credit
transaction. It has above average (strong) capability for payment of interest
and principal sums |
Large |
|
56-70 |
A |
Financial & operational base are regarded healthy. General
unfavourable factors will not cause fatal effect. Satisfactory capability for
payment of interest and principal sums |
Fairly Large |
|
41-55 |
Ba |
Overall operation is considered normal. Capable to meet normal commitments. |
Satisfactory |
|
26-40 |
B |
Capability to overcome financial difficulties seems comparatively
below average. |
Small |
|
11-25 |
Ca |
Adverse factors are apparent. Repayment of interest and principal sums
in default or expected to be in default upon maturity |
Limited with
full security |
|
<10 |
C |
Absolute credit risk exists. Caution needed to be exercised |
Credit not
recommended |
|
---- |
NB |
New Business |
---- |
This score serves as a reference to assess SC’s credit risk
and to set the amount of credit to be extended. It is calculated from a
composite of weighted scores obtained from each of the major sections of this
report. The assessed factors and their relative weights (as indicated through
%) are as follows:
Financial
condition (40%) Ownership
background (20%) Payment
record (10%)
Credit history
(10%) Market trend
(10%) Operational
size (10%)
This report is issued at your request without any
risk and responsibility on the part of MIRA INFORM PRIVATE LIMITED (MIPL)
or its officials.