![]()
MIRA INFORM
REPORT
|
Report Date : |
16.02.2011 |
IDENTIFICATION DETAILS
|
Name : |
INDORAMA
POLYESTER INDUSTRIES PUBLIC
COMPANY LIMITED |
|
|
|
|
Formerly Known as : |
TUNTEX
[ |
|
|
|
|
Registered Office : |
35th
Floor, |
|
|
|
|
Country : |
|
|
|
|
|
Financials (as on) : |
31.12.2009 |
|
|
|
|
Date of Incorporation : |
16.04.1987 |
|
|
|
|
Com. Reg. No.: |
0107537002451 |
|
|
|
|
Legal Form : |
Public
Limited Company |
|
|
|
|
Line of Business : |
Manufacturer, Distributor and Exporter of polyester yarns |
RATING & COMMENTS
|
MIRA’s Rating : |
B |
|
RATING |
STATUS |
PROPOSED CREDIT LINE |
|
|
26-40 |
B |
Capability to overcome financial difficulties seems comparatively
below average. |
Small |
|
Status : |
Moderate |
|
Payment
Behaviour : |
Unknown |
|
Litigation : |
Clear |
NOTES :
Any query related to this report can be made
on e-mail : infodept@mirainform.com
while quoting report number, name and date.
ECGC Country Risk Classification List – June 30, 2010
|
Country Name |
Previous Rating (01.04.2010) |
Current Rating (30.06.2010) |
|
|
B1 |
B1 |
|
Risk Category |
ECGC
Classification |
|
Insignificant |
A1 |
|
Low |
A2 |
|
Moderate |
B1 |
|
High |
B2 |
|
Very High |
C1 |
|
Restricted |
C2 |
|
Off-credit |
D |
Company name
INDORAMA POLYESTER
INDUSTRIES PUBLIC COMPANY
LIMITED
[FORMER
: TUNTEX [
SUMMARY
ADDRESS : 35th FLOOR,
75/92 SOI
SUKHUMVIT 19,
TELEPHONE : [66] 2661-6661
FAX : [66] 2661-6664
E-MAIL : solarn@indorama-th.com
info@indorama-th.com
REGISTRATION
ADDRESS : SAME
AS BUSINESS ADDRESS
EATABLISHED : 1987
REGISTRATION
NO. : 0107537002451 [Former : BOR MOR
JOR. 492]
CAPITAL REGISTERED : BHT. 2,226,220,000
CAPITAL PAID-UP : BHT. 2,202,850,000
FISCAL
YEAR CLOSING DATE : DECEMBER 31
LEGAL
STATUS : PUBLIC LIMITED
COMPANY
EXECUTIVE : MR.
SASHI PRAKASH KHAITAN,
INDIAN
CHIEF EXECUTIVE
OFFICER
NO.
OF STAFF : 1,000
LINES
OF BUSINESS : POLYESTER
YARNS
MANUFACTURER, DISTRIBUTOR
AND EXPORTER
CORPORATE PROFILE
OPERATING
TREND : STABLE
PRESENT
SITUATION : OPERATING NORMALLY
REPUTATION : GOOD
WITH
MANAGEMENT
STANDARD : MANAGEMENT WITH
FAIR PERFORMANCE
HISTORY
The
subject was initially
established on April
16, 1987 as a private
limited company under
the registered name C.P.P. [
The
subject received Board
of Investment Promotion
in producing synthetic
fibre such as
POY [Partially Oriented
Yarn], Staple Fibre,
Chip, DTY [Draw
Textured Yarn] and
SDY [Spin Draw
Yarn]. It was
a joint venture
company among Taiwanese, Japanese
and Thai investors.
On
December 30, 2008,
the subject registered
for a change
of its name
to INDORAMA POLYESTER INDUSTRIES
PUBLIC COMPANY LIMITED.,
then was revoked
its name from
the Stock Exchange
of Thailand on
April 30, 2009.
It currently employs
1,000 staff.
The subject’s product
quality has already
met the international
standard and received
ISO 9002 Certificate on
April 25, 1997.
Application for the
important environmental quality
standard of ISO
14000 was granted
in 1998.
The
subject’s registered address was
initially located at
Room 1812, 18th Floor,
B.B. Building, 54
Sukhumvit 21 Rd
[Soi Asoke], Klongtoey
Nua, Wattana, Bangkok
10110.
Later,
the registered address
was relocated to 35th Floor,
Ocean Tower 2,
75/92 Soi Sukhumvit
19, Asoke Rd.,
Klongtonnua, Wattana, Bangkok
10110, and this
is the subject’s
current operation address.
THE BOARD OF DIRECTORS
|
Name |
|
Nationality |
Age |
|
|
|
|
|
|
Mr. Chira Panupong |
[x] |
Thai |
78 |
|
Mrs.
Yaowaluck Pawijit |
|
Thai |
47 |
|
Mr.
Khanit Khongthanarat |
|
Thai |
60 |
|
Mr.
Aloke Lohia |
[x] |
Indian |
52 |
|
Mrs.
Suchitra Lohia |
[x] |
Indian |
46 |
|
Mr.
Amit Lohia |
|
Indian |
36 |
|
Mr.
Sashi Prakash Khaitan |
[x] |
Indian |
62 |
|
Mr.
Ramesh Kumar Narsinghpura |
[x] |
Indian |
50 |
|
Mr.
Vachara Phanchet |
[x] |
Thai |
49 |
AUTHORIZED PERSON
Two
of the mentioned
directors [x] can
jointly sign on
behalf of the
subject with the
company’s affixed.
MANAGEMENT
Mr.
Aloke Lohia is
the Chief Executive
Officer of Group.
He
is Indian nationality
with the age
of 52 years old.
Mr. Sashi
Prakash Khaitan is
the Chief Executive
Officer.
He
is Indian nationality
with the age
of 62 years old.
Mr.
Gopal Lal Modi is the
Chief Operating Officer.
He
is Indian nationality.
Mr. Asok
Mathur is the
VP. [Operations].
He
is Indian nationality.
Mr.
Olarn Suthipongkanalai is
the Senior Manager
of Finance &
Accounting.
He
is Thai nationality.
Mrs. Sunantha Larnopparat
is the Human
Resources Manager.
She
is Thai nationality.
BUSINESS OPERATIONS
The
subject’s activities are
manufacturer, exporter and
distributor of polyester
yarns such as
Partially Oriented Yarn
[POY], Draw Textured
Yarn [DTY] and
etc.
PRODUCTIONS
POY
: 95,000 metric
tons per year
DTY :
36,000 metric tons
per year
PURCHASE
Machinery and raw materials such as Mono Ethylene Glycol
[MEG] and Pure Terephthalic Acid
[PTA] are purchased from both
local and overseas
suppliers in Japan,
Germany, United States
of America, Taiwan,
Singapore, India and
Republic of China.
SALES [LOCAL]
80%
of the products
is sold locally
to manufacturers, wholesalers
and end-users.
EXPORT [COUNTRIES]
20% of the
products is also
exported to Europe, Australia, Republic of China, Singapore,
Taiwan, Indonesia and
Middle East.
LITIGATIONS
Bankruptcy and
Receivership
On December 15, 2003, the Central Bankruptcy Court has ordered Tuntex [Thailand] Public Company Limited [Debtor] to enter into business rehabilitation and appointed Tuntex [Thailand] Public Company Limited to be the Planner according to the lawsuit red case no. 2382/2546. As a result of such Court order, the power and duties in managing the business and assets of the debtor, including all legal rights of the company’s shareholders shall be vested in the Planner according to Article 90/25 of Bankruptcy Act B.E. 2483.
On September 10, 2004, the Court approved the rehabilitation plan and assigned Tuntex [Thailand] Public Company Limited to be the Plan Administrator. As a result of such Court order, the power and duties of the Planner shall be vested in the Plan Administrator according to Article 90/59 of Bankruptcy Act B.E. 2483.
On October 27, 2008, the Court has ordered a cancellation of company’s rehabilitation according to Article 90/70 of Bankruptcy Act B.E. 2483. As a result of such Court order, the power and duties in managing the business and assets of the debtor shall be vested in the management of debtor and shareholders.
Others
The subject
has several litigations
in relation to
its normal course
of business operation,
but the management
believes that it
would not have significant affect
on the company’s
business.
PARENT COMPANY
Indorama
Ventures Public Co., Ltd.
SUBSIDIARIES AND
ASSOCIATED COMPANIES
Chaophraya Heritage Co.,
Ltd.
Business Type : Real
Estate
Investment : The
subject holds 100% of
the company’s shares.
Tuntex
Textile [
Business Type : Manufacturing &
distribution of fabrics
Investment : The
subject holds 16.67% of
the company’s shares.
Business Type : Manufacturer of
polyester yarn
Investment : The
subject holds 6% of
the company’s shares.
CREDIT
Purchasing
terms are by
cash or on the
credits term of
30-60 days.
Imports
are by L/C
at sight or
T/T.
Selling
terms are by
cash or on
the credits term
of 30-60 days.
Exports
are against L/C
at sight or
T/T.
BANKING
Bangkok
Bank Public Co.,
Ltd.
[Head Office :
Siam
Commercial Bank Public
Co., Ltd.
[Head Office :
Krung
Thai Bank Public
Co., Ltd.
[Head Office :
EMPLOYMENT
The subject employs approximately 1,000 staff. [office, sales staff and factory workers]
LOCATION DETAILS
The
premise is rented
for operating administrative office
at the heading
address. Premise located
in commercial/residential area.
The
factory is located
at 6, I - 2
Road, Mabtaphut Industrial
Estate, T. Mabtaphut,
A. Muang, Rayong
21150 Tel: [66]
38 683-870-8, Fax [66] 38
683-884.
COMMENT
Trend
of Thai economic
growth is in
a negative way
while the world
economic is predicted
to lower rate
than the previous
year. However, the
economic growth in
2009 is expected
minus from both external
and internal factors.
Moreover political setback, higher fuel
prices and raw
materials cost increases
would be an obstacle for
company’s growth and expansion.
Despite
sluggish economy in 2009,
the company strived to
maintain its leadership in
the polyester industry, in which it was
recognized as one of the
world’s largest producers of
polyester yarns.
In
2010 it expects
to benefit from
the economic recovery in
Europe and the
USA, as well as
the other regions
which demand of polyester
yarns has been
consistently growing.
FINANCIAL INFORMATION
The
capital was originally
registered at Bht. 100,000
divided into 1,000
shares of Bht.
100 each.
The
capital was increased
later as followings:
Bht.
80 million on
July 30, 1987
Bht.
600 million on
December 28, 1987
Bht.
750
million on November
11, 1988
Bht.
900
million on November
22, 1989
Bht. 1,000
million on August
22, 1990
Bht. 1,500
million on July
21, 1992
Bht. 1,800
million on July
15, 1993
Bht. 2,100
million in 1996
Bht. 2,300
million in 1997
Bht. 2,800
million in 1998
Bht. 2,960
million on August
14, 2003
The
latest registered capital
was decreased to
Bht. 2,226,220,000 divided
into 2,226,220,000 shares
of Bht. 1
each with Bht. 2,202,850,000 paid-up.
MAIN
SHAREHOLDERS [as at
March 26, 2010]
|
NAME |
HOLDING |
% |
|
|
|
|
|
Indorama Ventures Co.,
Ltd. |
1,430,636,976 |
64.94 |
|
Indorama Holdings Co.,
Ltd. |
762,428,437 |
34.61 |
|
Mycene Holdings [B.V.I.] Ltd. |
2,017,899 |
0.09 |
|
Others |
7,766,688 |
0.36 |
Total Shareholders : 846
NAME OF AUDITOR
& CERTIFIED PUBLIC
ACCOUNTANT NO.:
Ms. Thipawal Nananuwat
No. 3459
BALANCE SHEET [BAHT]
The latest
financial figures published as
at December 31,
2009 & 2008
were:
ASSETS
|
Current Assets |
2009 |
2008 |
|
|
|
|
|
Cash and cash
equivalents |
25,015,749 |
76,336,932 |
|
Trade accounts receivable |
|
|
|
Related parties |
235,164,264 |
5,643,466 |
|
Unrelated parties |
1,483,476,968 |
13,695,034 |
|
Trade Account Receivable-Related Parties |
5,869,421 |
- |
|
Short-term loans and
advances to related
parties |
- |
401,987 |
|
Inventories |
1,565,213,140 |
310,747,803 |
|
Other current assets
|
|
|
|
Refundable input
tax |
121,363,301 |
36,628,885 |
|
Accrued tax
rebate from export
sales |
99,796,646 |
- |
|
Others |
120,855,334 |
15,659,875 |
|
|
|
|
|
Total Current Assets
|
3,656,754,823 |
459,113,982 |
|
Non-current assets |
|
|
|
Deposits at financial institution with restrictions |
7,140,873 |
7,038,000 |
|
Property, plant and equipment |
4,567,626,305 |
2,054,077,264 |
|
Intangible assets |
1,023,940 |
1,768,817 |
|
Other Non-current Assets |
71,667,679 |
6,921,922 |
|
Total non-current assets |
4,647,458,797 |
2,069,806,003 |
|
Total Assets |
8,304,213,620 |
2,528,919,985 |
LIABILITIES &
SHAREHOLDERS' EQUITY [BAHT]
|
Current
Liabilities |
2009 |
2008 |
|
|
|
|
|
Bank overdraft and
short-term loans from Financial institutions |
1,903,306,344 |
286,119,094 |
|
Trust receipts |
23,766,214 |
10,335,856 |
|
Trade account payable
|
|
|
|
Related parties |
1,241,657,292 |
60,938,523 |
|
Unrelated parties |
1,219,013,773 |
120,298,856 |
|
Other accounts
payable-related party |
- |
143,053,956 |
|
Other accounts
payable-unrelated parties |
30,337,676 |
75,469,876 |
|
Current portion of Long-term debt
under business rehabilitation plan
|
|
|
|
Long-term loan under
business rehabilitation Plan |
140,000,000 |
- |
|
under debt
restructuring agreement |
60,841,740 |
51,680,224 |
|
Current portion of finance
lease under liabilities |
12,399,092 |
- |
|
Other Current Liabilities Advance money goods |
93,917,666 |
- |
|
Accrued expenses |
88,749,042 |
3,524,542 |
|
Others |
20,653,981 |
3,248,255 |
|
|
|
|
|
Total Current Liabilities |
4,834,642,820 |
754,669,182 |
|
Non-current liabilities |
|
|
|
Long-term Loan debts under debt
restructuring agreement |
|
|
|
Long-term loan from
financial institution Under debt
restructuring agreement |
1,328,630,000 |
818,630,000 |
|
Accrued interest
under debt restructuring agreement |
115,654,695 |
166,064,510 |
|
Convertible debentures |
58,519,585 |
- |
|
Total non-current
liabilities |
1,502,804,280 |
984,694,510 |
|
Total Liabilities |
6,337,447,100 |
1,739,363,692 |
|
|
2009 |
2008 |
|
|
|
|
|
Shareholders' Equity |
|
|
|
Share capital |
|
|
|
Registered |
|
|
|
2,226,220,000 ordinary
shares of Baht 1 each |
|
|
|
[2008 : 824,350,000 ordinary
shares of Baht 10 each] |
2,226,220,000 |
824,350,000 |
|
|
|
|
|
Issued & Fully Paid 2,202,850,000 ordinary shares
of Baht 1
each |
|
|
|
[2008 : 824,350,000 ordinary
shares of Baht 10 each] |
2,202,850,000 |
824,350,000 |
|
Share premium |
96,495,000 |
- |
|
Revaluation surplus
on assets |
866,414,796 |
- |
|
Revaluation surplus
of changes in values of investments invested
by an associate
|
[907,144,640] |
- |
|
Retained Earnings Unappropriated [Deficit] |
[291,848,636] |
[34,793,707] |
|
Total Shareholders' Equity |
1,966,766,520 |
789,556,293 |
|
Total Liabilities &
Shareholders' Equity |
8,304,213,620 |
2,528,919,985 |
PROFIT &
LOSS ACCOUNT
|
Revenue |
2009 |
2008 |
|
|
|
|
|
Sales and service income |
8,791,502,560 |
267,167,891 |
|
Other Income |
|
|
|
Compensation Export Income |
104,184,354 |
- |
|
Gain on sales
of property, plant and equipment |
14,999 |
45,878,251 |
|
Gain on sales of
investment |
- |
17,017,223 |
|
Gain on debts
restructuring under business rehabilitation plant |
- |
7,563,715,100 |
|
Gain on debts
restructuring |
6,169,170 |
166,677,360 |
|
Interest income and
other income |
42,174,872 |
9,741,527 |
|
Total Revenues |
8,944,045,955 |
8,070,197,352 |
|
Expenses |
|
|
|
|
|
|
|
Cost of sales
and service |
8,663,477,157 |
411,673,467 |
|
Cost of progress |
- |
565,530,112 |
|
Loss on
of diminution in
value of investment [reversal] |
[87,764,396] |
51,114,236 |
|
Selling expenses |
476,939,746 |
9,702,134 |
|
Administrative expenses |
63,123,212 |
18,611,399 |
|
Remuneration management |
12,060,000 |
5,061,777 |
|
Other expenses |
|
|
|
Loss on sales o f
investment |
- |
218,581,881 |
|
Loss from impairment
of buildings, equipment and
spare parts |
- |
2,892,836,630 |
|
Doubtful debts
for short-term loans and advance to
related companies and
subsidiary |
- |
3,225 |
|
Total Expenses |
9,127,835,719 |
4,173,114,861 |
|
|
|
|
|
Income [loss] before
finance cost |
[183,789,764] |
3,897,082,491 |
|
Finance cost |
[73,265,165] |
[480,972,935] |
|
|
|
|
|
Net Profit / [Loss] |
[257,054,929] |
3,416,109,556 |
FINANCIAL ANALYSIS
|
ITEM |
UNIT |
2009 |
2008 |
|
|
|
|
|
|
LIQUIDITY RATIO |
|
|
|
|
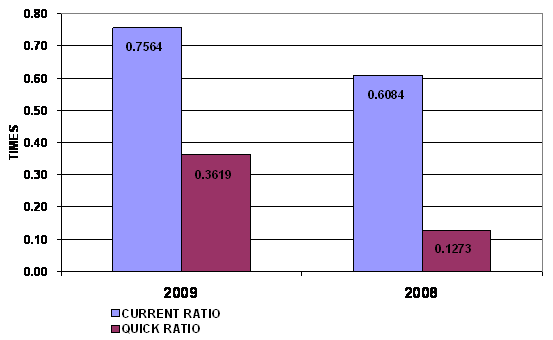
CURRENT RATIO |
TIMES |
0.76 |
0.61 |
|
QUICK RATIO |
TIMES |
0.36 |
0.13 |
|
|
|
|
|
|
ACTIVITY RATIO |
|
|
|
|
FIXED ASSETS TURNOVER |
TIMES |
1.92 |
0.13 |
|
TOTAL ASSETS TURNOVER |
TIMES |
1.06 |
0.11 |
|
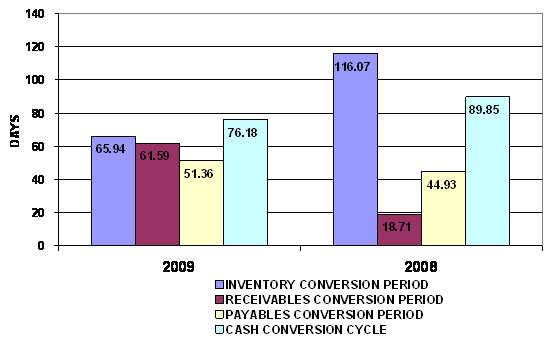
INVENTORY CONVERSION PERIOD |
DAYS |
65.94 |
116.07 |
|
INVENTORY TURNOVER |
TIMES |
5.54 |
3.14 |
|
RECEIVABLES CONVERSION PERIOD |
DAYS |
61.59 |
18.71 |
|
RECEIVABLES TURNOVER |
TIMES |
5.93 |
19.51 |
|
PAYABLES CONVERSION PERIOD |
DAYS |
51.36 |
44.93 |
|
CASH CONVERSION CYCLE |
DAYS |
76.18 |
89.85 |
|
|
|
|
|
|
PROFITABILITY
RATIO |
|
|
|
|
COST OF GOODS SOLD |
% |
98.54 |
365.76 |
|
SELLING & ADMINISTRATION |
% |
6.14 |
10.60 |
|
INTEREST |
% |
0.83 |
180.03 |
|
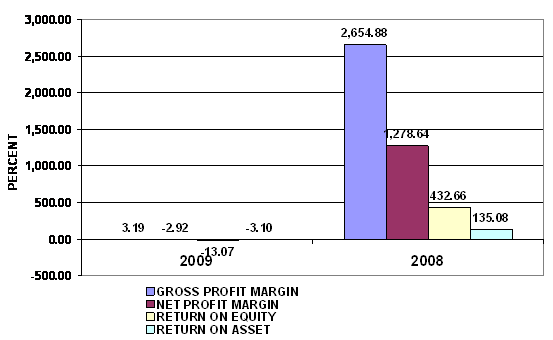
GROSS PROFIT MARGIN |
% |
3.19 |
2,654.88 |
|
NET PROFIT MARGIN BEFORE EX. ITEM |
% |
(2.09) |
1,458.66 |
|
NET PROFIT MARGIN |
% |
(2.92) |
1,278.64 |
|
RETURN ON EQUITY |
% |
(13.07) |
432.66 |
|
RETURN ON ASSET |
% |
(3.10) |
135.08 |
|
EARNING PER SHARE |
BAHT |
(1.17) |
41.44 |
|
|
|
|
|
|
LEVERAGE RATIO |
|
|
|
|
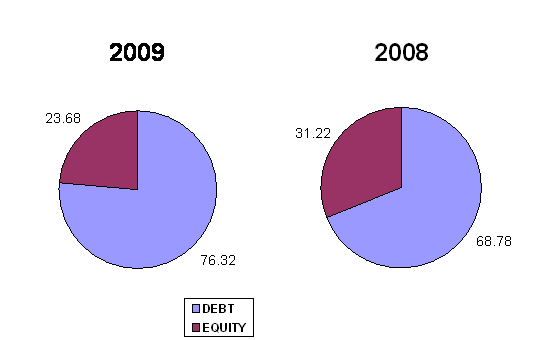
DEBT RATIO |
TIMES |
0.76 |
0.69 |
|
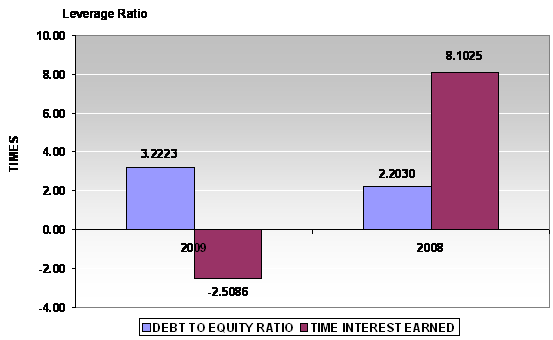
DEBT TO EQUITY RATIO |
TIMES |
3.22 |
2.20 |
|
TIME INTEREST EARNED |
TIMES |
(2.51) |
8.10 |
|
|
|
|
|
|
ANNUAL GROWTH |
|
|
|
|
SALES GROWTH |
% |
3,190.63 |
|
|
OPERATING PROFIT |
% |
(104.72) |
|
|
NET PROFIT |
% |
(107.52) |
|
|
FIXED ASSETS |
% |
117.51 |
|
|
TOTAL ASSETS |
% |
228.37 |
|
PROFITABILITY RATIO
|
Gross Profit Margin |
3.19 |
Deteriorated |
Industrial Average |
7.16 |
|
Net Profit Margin |
(2.92) |
Deteriorated |
Industrial Average |
(12.01) |
|
Return on Assets |
(3.10) |
Deteriorated |
Industrial Average |
(0.84) |
|
Return on Equity |
(13.07) |
Deteriorated |
Industrial Average |
(16.31) |
Gross Profit Margin used to assess a firm's financial health by
revealing the proportion of money left over from revenues after accounting for the
cost of goods sold. Gross profit margin serves as the source for paying
additional expenses and future savings. The company's figure is 3.19%. When
compared with the industry average, the ratio of the company was lower. This indicated that company was originated from
the problems with control over its
costs.
Net Profit Margin is the indicator of the company's efficiency in that
net profit takes into consideration all expenses of the company. A low profit
margin indicates a low margin of safety, higher risk that a decline in sales
will erase profits and result in a net loss. The company's figure is -2.92%
compared with those of its average competitors in the same industry, indicated
that business was an efficient operator
in a dominant position within its industry.
Return on Assets measures how efficiently profits are being generated
from the assets employed in the business when compared with the ratios of firms
in a similar business. A low ratio in comparison with industry averages
indicates an inefficient use of business assets. When compared with the
industry average, it was lower, the company's figure is -3.1%.
Return on Equity indicates how profitable a company is by comparing its
net income to its average shareholders' equity, ROE measures how much the
shareholders earned for their investment in the company. Return on Equity is
-13.07%, higher figure when compared with those of its average competitors in
the same industry, indicated that business was an efficient profit in a dominant position within its industry.
Trend of the
average competitors in the same industry for last 5 years
Return on Assets Uptrend
Return on Equity Downtrend
LIQUIDITY RATIO
|
Current Ratio |
0.76 |
Risky |
Industrial Average |
7.56 |
|
Quick Ratio |
0.36 |
|
|
|
|
Cash Conversion Cycle |
76.18 |
|
|
|
The Current Ratio is to ascertain whether a company's short-term assets
are readily available to pay off its short-term liabilities. The company's figure
is 0.76 times in 2009, increase from 0.61 times, then the company may not be
efficiently using its current assets. When compared with the industry average,
the ratio of the company was lower.
The Quick Ratio is a liquidity indicator that further refines the
current ratio by measuring the amount of the most liquid current assets there
are to cover current liabilities. The company's figure is 0.36 times in 2009,
increase from 0.13 times, then the company has not enough current assets that
presumably can be quickly converted to cash for pay financial obligations.
The Cash Conversion Cycle measures the number of days a company's cash
is tied up in the production and sales process of its operations and the
benefit from payment terms from its creditors. It meant the company could
survive when no cash inflow was received from sale for 77 days.
Trend of the
average competitors in the same industry for last 5 years
Current Ratio Uptrend
LEVERAGE RATIO
|
Debt Ratio |
0.76 |
Impressive |
Industrial Average |
1.13 |
|
Debt to Equity Ratio |
3.22 |
Risky |
Industrial Average |
0.16 |
|
Times Interest Earned |
(2.51) |
Risky |
Industrial Average |
0.62 |
Debt to Equity Ratio a measurement of how much suppliers, lenders, creditors
and obligors have committed to the company versus what the shareholders have
committed. A lower the percentage means that the company is using less leverage
and has stronger equity position.
Times Interest Earned measuring a company's ability to meet its debt
obligations. Ratio is -2.51 lower than 1, so the company is not generating
enough cash from EBIT to meet its interest obligations.
Debt Ratio shows the proportion of a company's assets which are financed
through debt. The company's figure is 0.76 greater than 0.5, most of the
company's assets are financed through debt.
Trend of the
average competitors in the same industry for last 5 years
Debt Ratio Uptrend
Times Interest Earned Downtrend
ACTIVITY RATIO
|
Fixed Assets Turnover |
1.92 |
Deteriorated |
Industrial Average |
6.81 |
|
Total Assets Turnover |
1.06 |
Satisfactory |
Industrial Average |
1.27 |
|
Inventory Conversion Period |
65.94 |
|
|
|
|
Inventory Turnover |
5.54 |
Acceptable |
Industrial Average |
9.00 |
|
Receivables Conversion Period |
61.59 |
|
|
|
|
Receivables Turnover |
5.93 |
Acceptable |
Industrial Average |
10.82 |
|
Payables Conversion Period |
51.36 |
|
|
|
Trend of the
average competitors in the same industry for last 5 years
Fixed Assets Turnover Uptrend
Total Assets Turnover Uptrend
Inventory Turnover Uptrend
Receivables Turnover Uptrend
FOREIGN EXCHANGE RATES
|
Currency |
Unit
|
Indian Rupees |
|
US Dollar |
1 |
Rs.45.45 |
|
|
1 |
Rs.72.90 |
|
Euro |
1 |
Rs.61.43 |
RATING EXPLANATIONS
|
RATING |
STATUS |
PROPOSED CREDIT LINE |
|
|
>86 |
Aaa |
Possesses an extremely sound financial base with the strongest
capability for timely payment of interest and principal sums |
Unlimited |
|
71-85 |
Aa |
Possesses adequate working capital. No caution needed for credit
transaction. It has above average (strong) capability for payment of interest
and principal sums |
Large |
|
56-70 |
A |
Financial & operational base are regarded healthy. General unfavourable
factors will not cause fatal effect. Satisfactory capability for payment of
interest and principal sums |
Fairly Large |
|
41-55 |
Ba |
Overall operation is considered normal. Capable to meet normal
commitments. |
Satisfactory |
|
26-40 |
B |
Capability to overcome financial difficulties seems comparatively
below average. |
Small |
|
11-25 |
Ca |
Adverse factors are apparent. Repayment of interest and principal sums
in default or expected to be in default upon maturity |
Limited with full
security |
|
<10 |
C |
Absolute credit risk exists. Caution needed to be exercised |
Credit not
recommended |
|
---- |
NB |
New Business |
---- |
This score serves as a reference to assess SC’s credit risk and
to set the amount of credit to be extended. It is calculated from a composite
of weighted scores obtained from each of the major sections of this report. The
assessed factors and their relative weights (as indicated through %) are as
follows:
Financial
condition (40%) Ownership
background (20%) Payment
record (10%)
Credit history
(10%) Market trend
(10%) Operational
size (10%)
This report is issued at your request without any
risk and responsibility on the part of MIRA INFORM PRIVATE LIMITED (MIPL) or
its officials.