![]()
MIRA INFORM
REPORT
|
Report Date : |
08.01.2011 |
IDENTIFICATION DETAILS
|
Name : |
LADDA
CO., LTD. |
|
|
|
|
Registered Office : |
|
|
|
|
|
Country : |
|
|
|
|
|
Financials (as on) : |
31.12.2009 |
|
|
|
|
Date of Incorporation : |
14.06.1966 |
|
|
|
|
Com. Reg. No.: |
0505509000045 |
|
|
|
|
Legal Form : |
Private Limited Company |
|
|
|
|
Line of Business : |
Manufacturer, Importer
and Distributor of
agrochemicals |
RATING & COMMENTS
|
MIRA’s Rating : |
Ba |
|
RATING |
STATUS |
PROPOSED CREDIT LINE |
|
|
41-55 |
Ba |
Overall operation is considered normal. Capable to meet normal
commitments. |
Satisfactory |
|
Status : |
Satisfactory |
|
Payment
Behaviour : |
No Complaints |
|
Litigation : |
Clear |
NOTES :
Any query related to this report can be made
on e-mail : infodept@mirainform.com
while quoting report number, name and date.
ECGC Country Risk Classification List – June 30, 2010
|
Country Name |
Previous Rating (01.04.2010) |
Current Rating (30.06.2010) |
|
|
b1 |
b1 |
|
Risk Category |
ECGC
Classification |
|
Insignificant |
A1 |
|
Low |
A2 |
|
Moderate |
B1 |
|
High |
B2 |
|
Very High |
C1 |
|
Restricted |
C2 |
|
Off-credit |
D |
Company name
LADDA
CO., LTD.
SUMMARY
BUSINESS
ADDRESS :
JATUJAK,
TELEPHONE : [66] 2954-3120-6
FAX :
[66] 2954-3128
E-MAIL
ADDRESS : info@ladda.com
REGISTRATION
ADDRESS : 77/6
MOO 1, CHANGPUEK,
MUANG,
CHIANGMAI 50000
ESTABLISHED
: 1966
REGISTRATION
NO. : 0505509000045 [Former: CHOR
MOR. 86]
CAPITAL REGISTERED : BHT. 110,000,000
CAPITAL PAID-UP : BHT.
110,000,000
FISCAL YEAR CLOSING DATE : DECEMBER 31
LEGAL
STATUS : PRIVATE LIMITED
COMPANY
EXECUTIVE : MR.
SERI CHAROENSUK, THAI
PRESIDENT
NO.
OF STAFF : 400
LINES
OF BUSINESS : AGROCHEMICALS
MANUFACTURER, IMPORTER
AND DISTRIBUTOR
CORPORATE PROFILE
OPERATING
TREND : STABLE
PRESENT
SITUATION : OPERATING NORMALLY
REPUTATION : GOOD
WITH
MANAGEMENT
STANDARD : MANAGEMENT WITH
GOOD PERFORMANCE
HISTORY
The
subject was established
on June 14,
1966 as a
private limited company
under the name
style LADDA CO.,
LTD., by Thai
group, with the
business objective to
manufacture, import and
distribute agrochemicals to
domestic market. It currently
employs approximate 400
staff.
The
subject’s registered address
is 77/6 Moo
1, Changpuek, Muang,
Chiangmai 50000, while
the operation address
is located at
99/220 Tesabansongkroh Rd.,
Ladyao, Jatujak, Bangkok
10900.
THE BOARD OF DIRECTOR
|
Name |
|
Nationality |
Age |
|
|
|
|
|
|
Mr. Seri Charoensuk |
|
Thai |
53 |
|
Mrs. Klinporn Patratanapong |
[x] |
Thai |
32 |
|
Mr. Methavee Maneechote |
[x] |
Thai |
31 |
|
Ms. Patcharaporn Chiarwutthi |
[x] |
Thai |
32 |
|
Ms. Ratchadaporn Nartajara |
|
Thai |
35 |
|
Ms. Sukonthip Siridej |
|
Thai |
38 |
|
Mrs. Supawan Srilaemthong |
|
Thai |
61 |
AUTHORIZED PERSON
Any of the mentioned directors
[x] can sign
or any two
of the rest
directors can jointly
sign on behalf
of the subject
with company’s affixed.
MANAGEMENT
Mr. Seri Charoensuk is
the President.
He is Thai
nationality with the
age of 53
years old.
Mr. Methavee Maneechote is
the Managing Director.
He is Thai
nationality with the
age of 31
years old.
Ms. Patcharaporn Chiarwutthi is
the Deputy Managing
Director.
She is Thai
nationality with the
age of 32 years
old.
Mr. Suchin Chantarasa-ard is
the Assistant Managing
Director [Marketing & Development].
He is Thai
nationality.
Ms. Thanya Thungvachirakul is
the Human Resources
Manager..
She is Thai
nationality.
BUSINESS OPERATIONS
The subject is
engaged in manufacturing, importing
and distributing of
agrochemical such as
insecticides, herbicides, fungicides,
plant growth regulator,
rodenticides, molluscicides, micronutrients and
etc.
BRAND NAMES
“BIOK”, “RHODIA”, “NUFARM”,
“SANONDA”, “SINON”, “WOCKHARDT”
and etc.
PURCHASE
Raw materials are
purchased from local
suppliers and agents.
IMPORT
The
products are imported
from Republic of
China,
United
Kingdom, India, Netherlands,
Malaysia, Australia, Belgium,
Israel, Ireland and
etc.
MAJOR SUPPLIERS
Simonis
B.V. :
United
Phosphorus Ltd. :
Keery
Algde :
Makhteshim
AGEN Ltd. :
SALES
100% of the
products is sold
locally by wholesale
to dealers and
end-users.
RELATED AND AFFILIATED COMPANIES
Agro Industry Development
Co., Ltd.
Business Type : Importer and
distributor of agrochemicals.
Bessaw Engineers [
Business Type :
Importer and distributor
of agrochemicals.
Dynamic Seeds Co.,
Ltd.
Business Type :
Importer and distributor
of agrochemicals and
seeds.
Ladda Intertrade Co.,
Ltd.
Business Type :
Importer and distributor
of fertilizer.
LITIGATION
Bankruptcy and
Receivership
There are no
litigation on bankruptcy
and receivership cases
filed against the
subject found at
Legal Execution Department
for the past
five years.
Others
There are no
legal suits filed
against the subject
for the past
two years.
CREDIT
Sales are by
cash or on
the credits term
of 30-60 days.
Local bills are
paid by cash
or on the
credits term of
30-60 days.
Imports are by
L/C at sight
or T/T.
BANKING
Bangkok Bank Public
Co., Ltd.
[Head Office :
Siam Commercial Bank
Public Co., Ltd.
[Head Office :
EMPLOYMENT
The
subject employs approximately
400 office staff
and workers.
LOCATION DETAILS
The
premise is owned
for administrative office
at the heading
address. Premise is
located in commercial/residential area.
Factory
and warehouse are
located at 151
Moo 6, Watsamkwaipuek Rd.,
Muang, Nakornpathom 73000,
Tel. : [66]
34 305-282.
REMARK
CREDIT
OF US$ 125,000
AGAINST D/A TERMS
SHOULD BE IN
ORDER.
COMMENT
Despite economic
slowdown in 2009, it
had a small effect
to agrochemical industry
due to farm
products were still the
major industry for
both domestic consumption
and exports. Subject also
reported healthy income,
while consumption in
2010 had gradually
improved in line
with agricultural industry
improvement.
FINANCIAL INFORMATION
The
capital was registered
at Bht. 110,000,000
divided into 110,000
shares of Bht.
1,000 each with
fully paid.
THE
SHAREHOLDERS LISTED WERE
: [as at July
30, 2010]
|
NAME |
HOLDING |
% |
|
|
|
|
|
Ladda Holding Group
Co., Ltd. Nationality: Thai Address :
Jatujak, |
107,690 |
97.90 |
|
Mrs. Piyada Rangkasiri Nationality: Thai Address : Chiangmai |
1,138 |
1.03 |
|
Ms. Vavida Angsuphan Nationality: Thai Address : 29/11
Moo 7, Wangthonglang, Bangkapi,
|
1,122 |
1.02 |
|
Mr. Seri Charoensuk Nationality: Thai Address : 34
Moo 5, Nongchangyai, Muangsamsib,
Ubonratchathani |
50 |
0.05 |
Total Shareholders : 4
NAME OF AUDITOR
& CERTIFIED PUBLIC
ACCOUNTANT NO. :
Mr. Vichit Luechaiprasit
No. 3563
BALANCE SHEET [BAHT]
The latest financial figures published for December 31, 2009 & 2008 were:
ASSETS
|
Current Assets |
2009 |
2008 |
|
|
|
|
|
Cash and Cash
Equivalents |
41,316,940.85 |
1,376,748.68 |
|
Trade Accts. Receivable |
275,454,637.67 |
127,872,217.00 |
|
Inventories |
199,746,680.21 |
325,716,218.55 |
|
Other Current Assets
|
1,627,510.42 |
3,646,945.80 |
|
Total Current Assets
|
518,145,769.15 |
458,615,130.03 |
|
|
|
|
|
Fixed Assets |
47,120,995.15 |
49,777,808.66 |
|
Intangible Assets |
3,653,139.55 |
- |
|
Other Assets |
143,569.07 |
592,621.25 |
|
Total Assets |
569,063,472.92 |
508,985,559.94 |
LIABILITIES &
SHAREHOLDERS' EQUITY [BAHT]
|
Current
Liabilities |
2009 |
2008 |
|
|
|
|
|
Bank Overdraft &
Short Term Loan
from Financial Institute |
226,098,751.07 |
210,050,462.03 |
|
Trade Accts. Payable |
60,548,976.53 |
49,464,515.62 |
|
Current Portion of Lease
Contract Liabilities |
779,644.51 |
1,731,447.27 |
|
Other Current Liabilities |
|
|
|
Accrued Income
Tax |
7,551,342.95 |
3,650,953.68 |
|
Accrued Expenses & Other |
5,052,980.36 |
7,310,508.38 |
|
Total Current Liabilities |
300,031,695.42 |
272,207,886.98 |
|
Lease Contract Liabilities, Net |
- |
779,644.44 |
|
Total Liabilities |
300,031,695.42 |
272,987,531.42 |
|
|
|
|
|
Shareholders' Equity |
|
|
|
|
|
|
|
Share capital : Baht 1,000
value authorized, issued
and fully paid share
capital 110,000 shares |
110,000,000.00 |
110,000,000.00 |
|
Capital Paid |
110,000,000.00 |
110,000,000.00 |
|
Statutory Reserve |
6,200,000.00 |
6,200,000.00 |
|
Retained Earning -
Unappropriated |
152,831,777.50 |
119,798,028.52 |
|
Total Shareholders' Equity |
269,031,777.50 |
235,998,028.52 |
|
Total Liabilities &
Shareholders' Equity |
569,063,472.92 |
508,985,559.94 |
PROFIT & LOSS ACCOUNT
|
|
2009 |
2008 |
|
|
|
|
|
Sales |
1,084,214,683.03 |
1,177,141,416.57 |
|
Other Income |
3,334,891.95 |
4,440,913.42 |
|
Total Sales |
1,087,549,574.98 |
1,181,582,329.99 |
|
Expenses |
|
|
|
|
|
|
|
Cost of Goods
Sold |
959,519,773.40 |
1,063,817,315.32 |
|
Selling & Administrative Expenses |
16,406,600.28 |
8,948,399.44 |
|
Other Expenses |
59,863,778.28 |
55,428,331.79 |
|
Total Expenses |
1,035,790,151.96 |
1,128,194,046.55 |
|
Profit / [Loss] Before Interest Expenses & Income Tax |
51,759,423.02 |
53,388,283.44 |
|
Interest Expenses |
[5,113,466.01] |
[16,254,203.63] |
|
Profit / [Loss] Before Income
Tax |
46,645,957.01 |
37,134,079.81 |
|
Income Tax |
[13,612,208.03] |
[11,277,269.16] |
|
Net Profit / [Loss] |
33,033,748.98 |
25,856,810.65 |
FINANCIAL ANALYSIS
|
ITEM |
UNIT |
2009 |
2008 |
|
|
|
|
|
|
LIQUIDITY RATIO |
|
|
|
|
CURRENT RATIO |
TIMES |
1.73 |
1.68 |
|
QUICK RATIO |
TIMES |
1.06 |
0.47 |
|
|
|
|
|
|
ACTIVITY RATIO |
|
|
|
|
FIXED ASSETS TURNOVER |
TIMES |
23.01 |
23.65 |
|
TOTAL ASSETS TURNOVER |
TIMES |
1.91 |
2.31 |
|
INVENTORY CONVERSION PERIOD |
DAYS |
75.98 |
111.75 |
|
INVENTORY TURNOVER |
TIMES |
4.80 |
3.27 |
|
RECEIVABLES CONVERSION PERIOD |
DAYS |
92.73 |
39.65 |
|
RECEIVABLES TURNOVER |
TIMES |
3.94 |
9.21 |
|
PAYABLES CONVERSION PERIOD |
DAYS |
23.03 |
16.97 |
|
CASH CONVERSION CYCLE |
DAYS |
145.68 |
134.43 |
|
|
|
|
|
|
PROFITABILITY
RATIO |
|
|
|
|
COST OF GOODS SOLD |
% |
88.50 |
90.37 |
|
SELLING & ADMINISTRATION |
% |
1.51 |
0.76 |
|
INTEREST |
% |
0.47 |
1.38 |
|
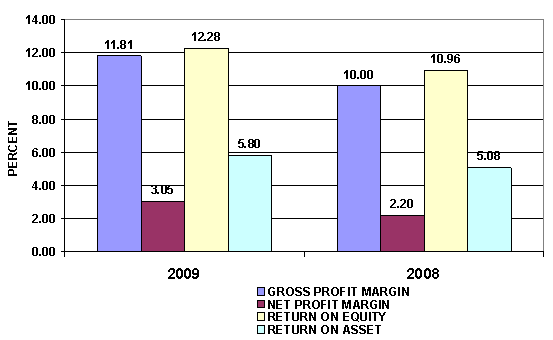
GROSS PROFIT MARGIN |
% |
11.81 |
10.00 |
|
NET PROFIT MARGIN BEFORE EX. ITEM |
% |
4.77 |
4.54 |
|
NET PROFIT MARGIN |
% |
3.05 |
2.20 |
|
RETURN ON EQUITY |
% |
12.28 |
10.96 |
|
RETURN ON ASSET |
% |
5.80 |
5.08 |
|
EARNING PER SHARE |
BAHT |
300.31 |
235.06 |
|
|
|
|
|
|
LEVERAGE RATIO |
|
|
|
|
DEBT RATIO |
TIMES |
0.53 |
0.54 |
|
DEBT TO EQUITY RATIO |
TIMES |
1.12 |
1.16 |
|
TIME INTEREST EARNED |
TIMES |
10.12 |
3.28 |
|
|
|
|
|
|
ANNUAL GROWTH |
|
|
|
|
SALES GROWTH |
% |
(7.89) |
|
|
OPERATING PROFIT |
% |
(3.05) |
|
|
NET PROFIT |
% |
27.76 |
|
|
FIXED ASSETS |
% |
(5.34) |
|
|
TOTAL ASSETS |
% |
11.80 |
|
PROFITABILITY RATIO
|
Gross Profit Margin |
11.81 |
Deteriorated |
Industrial Average |
26.94 |
|
Net Profit Margin |
3.05 |
Impressive |
Industrial Average |
(3.20) |
|
Return on Assets |
5.80 |
Impressive |
Industrial Average |
(4.05) |
|
Return on Equity |
12.28 |
Impressive |
Industrial Average |
9.01 |
Gross Profit Margin used to assess a firm's financial health by
revealing the proportion of money left over from sales after accounting for the
cost of goods sold. Gross profit margin serves as the source for paying
additional expenses and future savings. The company's figure is 11.81%. When
compared with the industry average, the ratio of the company was lower.
This indicated that company was
originated from the problems with control over its costs.
Net Profit Margin is the indicator of the company's efficiency in that
net profit takes into consideration all expenses of the company. A low profit
margin indicates a low margin of safety, higher risk that a decline in sales
will erase profits and result in a net loss. The company's figure is 3.05%
compared with those of its average competitors in the same industry, indicated
that business was an efficient operator
in a dominant position within its industry.
Return on Assets measures how efficiently profits are being generated
from the assets employed in the business when compared with the ratios of firms
in a similar business. A low ratio in comparison with industry averages
indicates an inefficient use of business assets. Return on Assets is 5.8%, higher figure when compared with
those of its average competitors in the same industry, indicated that business
was an efficient profit in a dominant
position within its industry.
Return on Equity indicates how profitable a company is by comparing its
net income to its average shareholders' equity, ROE measures how much the
shareholders earned for their investment in the company. Return on Equity is
12.28%, higher figure when compared with those of its average competitors in
the same industry, indicated that business was an efficient profit in a dominant position within its industry.
Trend of the
average competitors in the same industry for last 5 years
Return on Assets Uptrend
Return on Equity Uptrend

LIQUIDITY RATIO
|
Current Ratio |
1.73 |
Deteriorated |
Industrial Average |
25.05 |
|
Quick Ratio |
1.06 |
|
|
|
|
Cash Conversion Cycle |
145.68 |
|
|
|
The Current Ratio is to ascertain whether a company's short-term assets
are readily available to pay off its short-term liabilities. The company's figure
is 1.73 times in 2009, increase from 1.68 times, then it is generally
considered to have good short-term financial strength. When compared with the
industry average, the ratio of the company was lower.
The Quick Ratio is a liquidity indicator that further refines the
current ratio by measuring the amount of the most liquid current assets there
are to cover current liabilities. The company's figure is 1.06 times in 2009,
increase from 0.47 times, although excluding inventory so the company still have
good short-term financial strength.
The Cash Conversion Cycle measures the number of days a company's cash
is tied up in the production and sales process of its operations and the
benefit from payment terms from its
creditors. It meant the company could survive when no cash inflow was received
from sale for 146 days.
Trend of the
average competitors in the same industry for last 5 years
Current Ratio Downtrend


LEVERAGE RATIO
|
Debt Ratio |
0.53 |
Impressive |
Industrial Average |
0.91 |
|
Debt to Equity Ratio |
1.12 |
Impressive |
Industrial Average |
2.86 |
|
Times Interest Earned |
10.12 |
Impressive |
Industrial Average |
(123.23) |
Debt to Equity Ratio a measurement of how much suppliers, lenders, creditors
and obligors have committed to the company versus what the shareholders have
committed. A lower the percentage means that the company is using less leverage and has stronger equity position.
Times Interest Earned measuring a company's ability to meet its debt
obligations. Ratio is 10.13 higher than 1, so the company can pay interest
expenses on outstanding debt.
Debt Ratio shows the proportion of a company's assets which are financed
through debt. The company's figure is 0.53 greater than 0.5, most of the
company's assets are financed through debt.
Trend of the
average competitors in the same industry for last 5 years
Debt Ratio Uptrend
Times Interest Earned Downtrend

ACTIVITY RATIO
|
Fixed Assets Turnover |
23.01 |
Deteriorated |
Industrial Average |
73.03 |
|
Total Assets Turnover |
1.91 |
Impressive |
Industrial Average |
1.72 |
|
Inventory Conversion Period |
75.98 |
|
|
|
|
Inventory Turnover |
4.80 |
Deteriorated |
Industrial Average |
21.19 |
|
Receivables Conversion Period |
92.73 |
|
|
|
|
Receivables Turnover |
3.94 |
Deteriorated |
Industrial Average |
13.04 |
|
Payables Conversion Period |
23.03 |
|
|
|
Trend of the
average competitors in the same industry for last 5 years
Fixed Assets Turnover Uptrend
Total Assets Turnover Uptrend
Inventory Turnover Uptrend
Receivables Turnover Uptrend
FOREIGN EXCHANGE RATES
|
Currency |
Unit
|
Indian Rupees |
|
US Dollar |
1 |
Rs.45.37 |
|
|
1 |
Rs.70.38 |
|
Euro |
1 |
Rs.58.93 |
RATING EXPLANATIONS
|
RATING |
STATUS |
PROPOSED CREDIT LINE |
|
|
>86 |
Aaa |
Possesses an extremely sound financial base with the strongest
capability for timely payment of interest and principal sums |
Unlimited |
|
71-85 |
Aa |
Possesses adequate working capital. No caution needed for credit
transaction. It has above average (strong) capability for payment of interest
and principal sums |
Large |
|
56-70 |
A |
Financial & operational base are regarded healthy. General
unfavourable factors will not cause fatal effect. Satisfactory capability for
payment of interest and principal sums |
Fairly Large |
|
41-55 |
Ba |
Overall operation is considered normal. Capable to meet normal
commitments. |
Satisfactory |
|
26-40 |
B |
Capability to overcome financial difficulties seems comparatively
below average. |
Small |
|
11-25 |
Ca |
Adverse factors are apparent. Repayment of interest and principal sums
in default or expected to be in default upon maturity |
Limited with
full security |
|
<10 |
C |
Absolute credit risk exists. Caution needed to be exercised |
Credit not
recommended |
|
---- |
NB |
New Business |
---- |
This score serves as a reference to assess SC’s credit risk
and to set the amount of credit to be extended. It is calculated from a
composite of weighted scores obtained from each of the major sections of this
report. The assessed factors and their relative weights (as indicated through
%) are as follows:
Financial
condition (40%) Ownership
background (20%) Payment
record (10%)
Credit history
(10%) Market trend
(10%) Operational
size (10%)
This report is issued at your request without any risk
and responsibility on the part of MIRA INFORM PRIVATE LIMITED (MIPL) or its
officials.