MIRA INFORM REPORT


Report Date :

10.01.2011


IDENTIFICATION DETAILS


Name :

MAROC PHOSPHORE SA


Registered Office :

2, Rue AL Abtal, Hayerraha, Casablanca 2‑4 Rue Al Abtal ‑ Hay Erraha Casablanca 20200


Country :

Morocco


Financials (as on) :

31.12.2008


Date of Incorporation :

09.01.1981


Com. Reg. No.:

39755


Legal Form :

Societe Anonyme


Line of Business :

Manufacture of other organic basic chemicals


RATING & COMMENTS


MIRA’s Rating :

Ba


RATING

STATUS

PROPOSED CREDIT LINE

41-55

Ba

Overall operation is considered normal. Capable to meet normal commitments.

Satisfactory


Maximum Credit Limit :

57,903,000 EUR

Status :

Satisfactory

Payment Behaviour :

No Complaints

Litigation :

Clear


NOTES:

Any query related to this report can be made on e-mail: infodept@mirainform.com while quoting report number, name and date.


ECGC Country Risk Classification List – June 30, 2010


Country Name

Previous Rating

(01.04.2010)

Current Rating

(30.06.2010)

Morocco

A2

A2


Risk Category

ECGC Classification

Insignificant


A1

Low


A2

Moderate


B1

High


B2

Very High


C1

Restricted


C2

Off-credit


D


Company name


MAROC PHOSPHORE SA


Rating Briefing


Current Recommended Credit:              57,903,000 EUR


Payment Record:                                   NO COMPLAINTS


Registration Briefing


Registration Number:                             39755


Registration Date:                                  09/01/1981


Legal Form:                                           SOCIETE ANONYME


Latest Financials:                                  December 31, 2008


Financial Briefing


Nominal Capital:                                    6,500,000,000 Moroccan Dirham


Issued Capital:                                       N/A


Turnover:                                               31,612,216,012 Moroccan Dirham


Net Loss:                                                69,064,599


Net Worth:                                              3,206,434,223 Moroccan Dirham


Company Details


Company Name:                                          MAROC PHOSPHORE SA

Headquarter Address:                                   2‑4 Rue Al Abtal ‑ Hay Erraha,

                                                                  Casablanca 20200,

                                                                  Morocco


Telephone:                                                  +212522 230025

                                                                  +212522 230125

                                                                  +212522 232025

                                                                  +212523 345230

                                                                  +212524 463048


Fax:                                                            +212522 230570

                                                                  +212522 230624

                                                                  +212524 462348

                                                                  +212524 462403


Web Site:                                                    www.ocpgroup.com


Company was originally started as a SOCIETE ANONYME on 09/01/1981


Registration & Legal Details


Current Legal Form:                                   SOCIETE ANONYME

Registration Address:                                 2‑4 Rue Al Abtal ‑ Hay Erraha,

                                                                Casablanca 20200

Registration Number:                                  39755

Registration Date:                                      09/01/1981

Year/Date Company Established:                09/01/1981

Registration Town:                                     Casablanca

Tax Registration Number:                           02220797


Capital


Currency:                                                                 Moroccan Dirham

Authorized Capital:                                                        6,500,000,000

Paid Up Capital:                                                            6,500,000,000


Shareholders


Parent Company:                                     OFFICE CHERIFIEN DES PHOSPHATES OCP SA,

                                                                2‑4 RUE AL ABTAL ‑ HAY ERRAHA,

                                                                Casablanca,

                                                                Morocco

                                                                % Shares Held:   100.00%


Principals


Name:                                                       Mr Mostafa Terrab

Position within the company:                      President

Date of Birth:                                             19/10/1955

Country of Birth:                                         Morocco

Nationality:                                                Moroccan

Can fluently speak:                                    French

Education:                                                 from Massachusetts Institute Technical University


Name:                                                       Mr Saïd Gouzrou

Position within the company:                      Director

Country of Birth:                                         Morocco

Nationality:                                                Moroccan

Can fluently speak:                                    French


Company Activities


NACE Codes:          2014           Manufacture of other organic basic chemicals

                              2015           Manufacture of fertilisers and nitrogen compounds


The company "Maroc Phosphore" is completely integrated in the organization of Group OCP, this entity is specialized in the production of phosphoric acid and the phosphoric fertilizers in Safi and in Jorf Lasfar. It exportes 80% of the production to Europe, Asia and America.


Local Reporters consider the investigated company to be LARGE in their field of concern.


Operations


Employees                                               Company Employs: 7000

                                                                Including number of principals: 200


HQ Premises                                            Operates from:     Owned Offices

                                                                Premises Size:    1200 square meters

                                                                                          1200 square meters site

                                                                Location:             Central Business Area, Main Road


Branches                                                 Maroc Chimie,

                                                                Route Djorf El Youdi,

                                                                Safi,

                                                                Morocco

                                                                Branch is: Owned

                                                                Description of branch: Office, Factory, Warehouse


                                                                Maroc Phosphore I & II,

                                                                Route Djorf El Youdi,

                                                                Safi,

                                                                Morocco

                                                                Branch is: Owned

                                                                Description of branch: Office, Factory, Warehouse


                                                                Maroc Phophore III,

                                                                Jorf El Asfaar,

                                                                Eljadida,

                                                                Morocco

                                                                Branch is: Owned

                                                                Description of branch: Office, Factory, Warehouse


Exports


                                                              Export % and type of product:     80%

Exports To:                                              Europe, South East Asia, North America, South America


Trading & Selling

                                                               Territory:                                   20% Nationally, 80% International


Related Companies


Subsidiaries

                                  Maroc Chimie SA

                                  Boulevard de la Grande Ceinture,       Owned 100% by subject

                                  Casablanca,

                                  Morocco

                                 Operates as: manufacturing of fertilizer and phosphoric products.


Bankers


BMCE Bank,

Branch: Head Office

140 Avenue Hassan II,

Casablanca 20000,

Morocco


Attijariwafa Bank,

Branch: Head Office

163 Avenue Hassan II,

Casablanca 20000,

Morocco


Financial Information


Financial Interview Date:                             19/08/2010

Source:                                                     Companies Registry

Figures are:                                               Official Figures

Currency:                                                  Moroccan Dirham

           Months         Sales Figures           Sales                             Gross Profit/Loss                  Net

                                                                                                                                                           Profit/Loss

               12                31/12/2008              31,612,216,012                     93,204,611                      (69,064,599)

               12                31/12/2007              16,801,586,048                     2,429,277,442                  2,057,568,120

               12                31/12/2006              13,182,210,112                     (3,601,793,762)             (3,639,955,176)

               12                31/12/2005              17,503,051,500

               12                31/12/2004              19,300,000,000

               12                31/12/2003              11,525,760,000

               12                31/12/2002              17,100,000,000

               12                31/12/2001              11,439,000,000


     BALANCE SHEET


                                                                   As at: 31‑Dec‑2008                  As at: 31‑Dec‑2007        As at: 31‑Dec‑2006

  Fixed Assets

  Land & Buildings                                               424,577,369                              456,540,976                              435,764,773

  Plant & Machinery                                          1,953,987,817                           2,128,359,402                           2,451,359,931

  Furniture & Equipment                                         20,007,388                               24,105,148                               24,583,434

  Motor Vehicles                                                      9,099,441                               11,663,177                               14,401,760

  Misc. Fixed Assets                                         3,223,029,352                           2,096,562,631                              967,649,674

  Total Fixed Assets                                        5,630,701,367                           4,717,231,334                           3,893,759,572


  Financial Assets

  Shares in Related Companies                             353,134,686                              353,134,686                              363,776,452

  Loans to related companies

  Investments                                                          3,580,805                                 4,838,297                                 6,046,495

  Deposits                                                                 454,955                                    454,955                                    454,955

  Misc. Financial Assets                                             855,483                                 1,311,588                                 4,623,051

  Total Financial Assets                                     358,025,929                              359,739,526                              374,900,953


  Intangibles

  Goodwill

  Organisational Expenses                                          219,950                                    311,972

  Patents                                                                1,049,581                                 2,109,016                                 3,202,689

  Misc. Intangible Assets                                       12,211,591                               11,970,516                               13,330,945

  Total Intangible Assets                                      13,481,122                               14,391,504                               16,533,634


  Current Assets

  Stock                                                            5,329,665,524                           1,961,404,543                           2,133,099,864

  Stock & Work in Progress

  Trade Debtors & receivables                             2,571,042,413                           2,627,337,199                           1,709,597,383

  Provision for bad debs

  Other receivables                                                74,064,676                               23,060,694                               17,015,661

  Due from related companies

  Owed by shareholders

  Prepaid expenses                                              574,126,098                              321,226,069                              154,008,460

  Cash                                                                214,376,275                              411,503,839                              296,144,927

  Tax recoverable                                              2,075,502,642                              152,518,100                              212,021,411

  Marketable Securities                                            3,057,348                                 1,591,827                                 7,427,237

  Misc. Current Assets                                         656,999,409                               36,884,731                               33,680,219

  Total Current Assets                                    11,498,834,385                           5,535,527,002                           4,562,995,162

  Total Assets                                                17,501,042,803                         10,626,889,366                           8,848,189,321

  Owner's Equity & Liabilities

  Issued and paid up capital                               6,500,000,000                           6,500,000,000                           6,500,000,000

  Share premium account

  Retained earnings                                          ‑3,565,940,897                          ‑5,623,509,017                          ‑1,920,758,830

  Net profit/Loss for the year                                  ‑69,064,599                           2,057,568,120                          ‑3,639,955,177

  Revaluation reserves

  Legal Reserves                                                   29,698,802                               29,698,802                               29,698,802

  Other reserves                                                   311,740,917                              311,740,917                              248,945,907

  Net Worth                                                     3,206,434,223                           3,275,498,822                           1,217,930,702


  Deffered Taxation

  Provisions/allowances                                        891,592,339                              826,190,394                               24,973,310

  Mortgages/Loans                                               798,786,940                               57,756,412                              123,082,424

  Hire purchase

  Due to group of companies

  Minority interest

  Misc. deferred liabilities                                         2,180,974                                 2,218,707                                 2,990,880

  Total Long Term Liabilities                          1,692,560,253                              886,165,513                              151,046,614


  Current Liabilities

  Creditors                                                        7,270,330,517                           2,719,398,946                           2,298,708,525

  Other creditors                                               3,325,530,784                               91,527,016                              261,679,431

  Accruals                                                           769,812,588                           2,942,090,847                           4,737,785,105

  Bank overdrafts/Loans                                           3,393,158                               72,874,997                                 9,414,032

  Misc. Loans

  Directors accounts

  Owing to shareholders

  Owing to related companies

  Proposed dividend

  Long Term‑due 1 year

  Hire Purchase‑under 1 year

  Taxation                                                           113,544,538                              393,988,097                               50,684,278

  Advance receipts                                            1,065,869,384                              201,468,292                               75,026,744

  Misc. Current Liabilities                                       53,567,358                               43,876,836                               45,913,890

  Total Current Liabilities                              12,602,048,327                           6,465,225,031                           7,479,212,005

  Owner's Equity & Liabilities                        17,501,042,803                         10,626,889,366                           8,848,189,321


          PROFIT & LOSS


                                                                            Figures are:                              Figures are:                              Figures are:

                                                                             Fiscal Year                               Fiscal Year                               Fiscal Year


                                                        01/01/2008 to 31/12/2008    01/01/2007 to 31/12/2007            01/01/2006 to 31/12/2006

  Total Income/Turnover                                    31,612,216,012                         16,801,586,048                         13,182,210,112

  Cost of sales


  Gross Profit/(Loss)                                        31,612,216,012                         16,801,586,048                         13,182,210,112


  Admin/selling expenses                                 30,500,825,239                           9,838,409,828                           9,385,775,099

  Services                                                         1,002,129,696                           1,225,139,172                           1,457,926,039

  Salaries                                                         1,875,118,066                           1,580,011,626                           1,823,484,004

  Auditors Fee                                                       57,335,598                               75,095,931                               76,096,963

  Stock Depreciation                                        ‑5,535,789,570                              148,716,795                        ‑290,861,700

  Depreciation                                                   4,631,691,511                           1,214,058,851                           1,147,050,614

  Misc. Operating Expenses                                 119,642,327                                 6,273,345                                 9,899,169

  Misc. Operating Income                                  1,010,012,963                              616,337,513                              730,188,909

  Net Operating Profit/(Loss)                               ‑28,723,892                           3,330,218,013                              303,028,833


  Interest Receivable/Finance Income                        9,771,412                               17,740,205                               17,574,772

  Group related income

  Misc. Financial Income                                   1,247,982,241                              174,949,280                              206,160,519

  Total Financial Income                                1,257,753,653                              192,689,485                              223,735,291


  Interest Payable/Finance costs                            30,900,479                                 3,597,612                                 9,156,741

  Misc. financial expenses                                 1,104,924,671                           1,090,032,444                           4,119,401,145

  Total Financial Expenses                             1,135,825,150                           1,093,630,056                           4,128,557,886


  Profit/(Loss) before taxes                                  93,204,611                           2,429,277,442                          ‑3,601,793,762


  Income Tax                                                       162,269,210                              371,709,322                               38,161,414

  Other Tax

  Profit/(Loss) after taxes                                    ‑69,064,599                           2,057,568,120                          ‑3,639,955,176


  Extraordinary items

                                                                                                                                                                     Exceptional items

  Misc. Items


  Net Profit/(Loss)                                                ‑69,064,599                           2,057,568,120                          ‑3,639,955,176


  Previous years retained earnings

  Current years net income                                                                                2,057,568,120

  Misc. additions in current year

  Current years net loss                                        ‑69,064,599                                                                         ‑3,639,955,176

  Dividends in current year

  Withdrawals in current year

  Misc. deductions in current year


  Retained earnings at end of                            ‑69,064,599                           2,057,568,120                          ‑3,639,955,176

  financial period


  Average employees


  Directors fee

  Earnings per share

  Earnings per share‑previous year


Auditors Comments


Accounts obtained from:                      Companies registry


Auditors Opinion:                                 The audited financial statement gives a true and fair view of the state of affairs of the subject

Financial Statements have been prepared on an on‑going basis.

Assuming support of: shareholders


FINANCIAL RATIOS / COMPARATIVE DATA


                                      Actual Company      Industrial Averages     Actual Company      Industrial Averages

                                        Results (2008)                   (2008)                   Results (2007)                   (2007)

  Liquidity Ratios

  Current Ratio                                      0.91                            1.45                           0.86                            1.51

  Acid Test Ratio                                   0.49                            0.97                           0.55                            1.03

  Accounts                                            0.23                            0.28                           0.16                            0.33

  Payable/Sales Ratio

  Current Liabilities/Net                          3.93                            2.28                           1.97                            0.52

  Worth

  Total Liabilities/Net                              4.46                            2.58                           2.24                            0.45

  Worth

  Fixed Assets/Net                             175.61                          91.57                        144.02                       ‑123.76

  Worth (%)


  Profitability Ratios

  Gross Profit Ratio (%)                      100.00                          94.47                        100.00                          95.37

  Return on Capital                                1.90                          13.56                          58.37                            7.28

  Employed (ROCE)(%)

  Net Profit/Sales (%)                             0.29                            1.11                          14.46                            1.79

  Return on Assets (%)                          0.53                            5.10                          22.86                            5.01


  Efficiency Ratios

  Sales/Working Capital                      ‑28.65                            3.01                         ‑18.07                        160.96

  Assets/Sales(%)                               55.36                        140.22                          63.25                        146.59

  Shareholders                                      2.91                          17.29                          74.17                          24.90

  Return(%)

  Average Collection                             30.01                        100.26                          47.11                        116.69

  Period


  Leverage Ratios

  Capital Employed                                9.90                            4.56                           5.15                            0.14

  Capital Structure (%)                         34.55                          20.78                          21.29                          31.44


  Number of                                                                             424                                                              424

  Companies within the

  industry (NACE C)

  Statistics based on                                       Manufacturing                                               Manufacturing

  NACE(C)

           
INDUSTRY SECTOR COMPARATIVE DATA


        Elements Taken              Result for specific                    RANKING                Total Companies Used

                                                      company

DATE OF REGISTRATION                        09/01/1981                                    293                                    609

TOTAL EMPLOYEES                                       7,000                                       1                                    628

SALES (2008)                                     2,779,346,032                                       2                                    270

SALES (2007)                                     1,477,195,445                                       2                                    410

NET PROFIT (2008)                                    8,194,549                                      10                                    229

NET PROFIT (2007)                                180,901,389                                       1                                    410

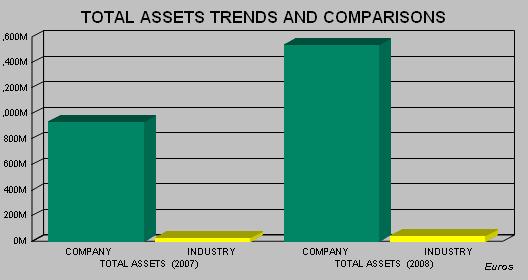
TOTAL ASSETS (2008)                        1,538,691,683                                       2                                    227

TOTAL ASSETS (2007)                           934,316,113                                       2                                    414


                                                                                                                                        Currency: EUROS


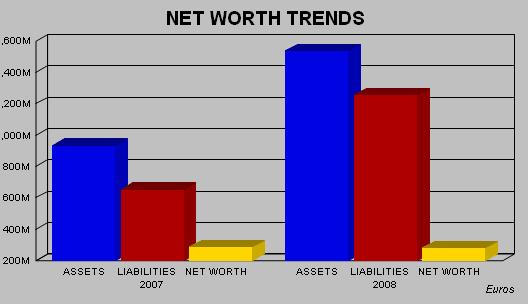
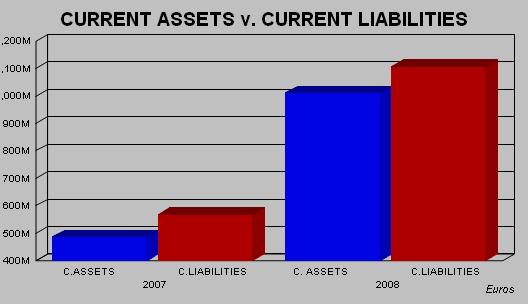
Charts of Financial Trends and Industry Comparisons


PLEASE NOTE THAT CHARTS ARE SHOWN IN EUROS FOR TREND AND COMPARISON PURPOSES


The statistical Industrial Average results are calculated against companies within the database for the  specific country.


Payments


Subject's payments reported to be:        NO COMPLAINTS


Representation


Other Comments


Other Comments:                                      Patent N° : 36000730


Interview & Reporter Comments


Date:                                                        17/08/2010

Comment:                                                 Latest Financial Statements are not currently available.

We have sent a fax/e‑mail/questionnaire however no reply has been received as of yet.


Reporter Comment Date:                            19/08/2010

Reporter Comment:                                    Please note that we have contacted Subject Company many times and we have sent a fax but no reply has been received till now.


    The Accounts 2009 are not currently available at the Companies   

    Registry Office.


Conclusions

Local Reputation:                                       The company being investigated is considered by local reporters to be a Fair / Normal Trade Risk.


General Conclusion:                                   As a State‑owned concern adequate resources should be made available.


Financial Results Trend:                             Financial Information indicates that the business activities of the 

                                                                company are declining in strength.


Age of Business:                                       The company is long established in the local market.


FOREIGN EXCHANGE RATES


Currency

Unit

Indian Rupees

US Dollar

1

Rs.45.37

UK Pound

1

Rs.70.38

Euro

1

Rs.58.93


RATING EXPLANATIONS


RATING

STATUS


PROPOSED CREDIT LINE

>86

Aaa

Possesses an extremely sound financial base with the strongest capability for timely payment of interest and principal sums


Unlimited

71-85

Aa

Possesses adequate working capital. No caution needed for credit transaction. It has above average (strong) capability for payment of interest and principal sums


Large

56-70

A

Financial & operational base are regarded healthy. General unfavourable factors will not cause fatal effect. Satisfactory capability for payment of interest and principal sums


Fairly Large

41-55

Ba

Overall operation is considered normal. Capable to meet normal commitments.


Satisfactory

26-40

B

Capability to overcome financial difficulties seems comparatively below average.


Small

11-25

Ca

Adverse factors are apparent. Repayment of interest and principal sums in default or expected to be in default upon maturity


Limited with full security

<10

C

Absolute credit risk exists. Caution needed to be exercised


Credit not recommended


This score serves as a reference to assess SC’s credit risk and to set the amount of credit to be extended. It is calculated from a composite of weighted scores obtained from each of the major sections of this report. The assessed factors and their relative weights (as indicated through %) are as follows:


Financial condition (40%)            Ownership background (20%)                 Payment record (10%)

Credit history (10%)                    Market trend (10%)                                Operational size (10%)


PRIVATE & CONFIDENTIAL : This information is provided to you at your request, you having employed MIPL for such purpose. You will use the information as aid only in determining the propriety of giving credit and generally as an aid to your business and for no other purpose. You will hold the information in strict confidence, and shall not reveal it or make it known to the subject persons, firms or corporations or to any other. MIPL does not warrant the correctness of the information as you hold it free of any liability whatsoever. You will be liable to and indemnify MIPL for any loss, damage or expense, occasioned by your breach or non observance of any one, or more of these conditions

This report is issued at your request without any risk and responsibility on the part of MIRA INFORM PRIVATE LIMITED (MIPL) or its officials.