![]()
MIRA INFORM
REPORT
|
Report Date : |
29.01.2011 |
IDENTIFICATION DETAILS
|
Name : |
PRESIDENT
CHEMICAL CO., LTD. |
|
|
|
|
Registered Office : |
54/15-17 Soi Santiparb,
|
|
|
|
|
Country : |
|
|
|
|
|
Financials (as on) : |
31.12.2009 |
|
|
|
|
Date of Incorporation : |
18.07.1979 |
|
|
|
|
Com. Reg. No.: |
0105522013442 |
|
|
|
|
Legal Form : |
Private Limited Company |
|
|
|
|
Line of Business : |
importer and distributor of industrial chemicals |
RATING & COMMENTS
|
MIRA’s Rating : |
Ba |
|
RATING |
STATUS |
PROPOSED CREDIT LINE |
|
|
41-55 |
Ba |
Overall operation is considered normal. Capable to meet normal
commitments. |
Satisfactory |
|
Status : |
Satisfactory |
|
|
|
|
Payment
Behaviour : |
No Complaints |
|
|
|
|
Litigation : |
Clear |
NOTES :
Any query related to this report can be made
on e-mail : infodept@mirainform.com
while quoting report number, name and date.
ECGC Country Risk Classification List – June 30, 2010
|
Country Name |
Previous Rating (01.04.2010) |
Current Rating (30.06.2010) |
|
|
b1 |
b1 |
|
Risk Category |
ECGC
Classification |
|
Insignificant |
A1 |
|
Low |
A2 |
|
Moderate |
B1 |
|
High |
B2 |
|
Very High |
C1 |
|
Restricted |
C2 |
|
Off-credit |
D |
Company name
PRESIDENT
CHEMICAL CO., LTD.
SUMMARY
BUSINESS
ADDRESS : 54/15-17 SOI
SANTIPARB,
SURIYAWONGSE, BANGRAK,
TELEPHONE : [66] 2233-3126,
2234-4171-4, 2235-7812-3
FAX
: [66] 2236-2008,
2631-6216
E-MAIL
ADDRESS : sales@president-chemicals.co.th
REGISTRATION
ADDRESS : SAME
AS BUSINESS ADDRESS
ESTABLISHED
: 1979
REGISTRATION
NO. : 0105522013442
CAPITAL REGISTERED : BHT. 40,000,000
CAPITAL PAID-UP : BHT.
40,000,000
FISCAL YEAR CLOSING DATE : DECEMBER 31
LEGAL
STATUS : PRIVATE LIMITED
COMPANY
EXECUTIVE : MR. PRAYUTH SUWANPATRA,
THAI
MANAGING DIRECTOR
NO.
OF STAFF : 120
LINES
OF BUSINESS : INDUSTRIAL CHEMICALS
IMPORTER AND
DISTRIBUTOR
CORPORATE PROFILE
OPERATING
TREND : STABLE
PRESENT
SITUATION : OPERATING NORMALLY
REPUTATION : GOOD
WITH
MANAGEMENT
STANDARD : MANAGEMENT WITH
GOOD PERFORMANCE
HISTORY
The
subject was formed
on July 18,
1979 as a
private limited company
by Thai and
Japanese businessmen, under
the name style
PRESIDENT CHEMICAL CO.,
LTD. Its business
objective to import
and distribute wide
range of industrial
chemicals to domestic
market. It currently
employs approximately 120
staff.
The
subject’s registered address
is 54/15-17 Soi Santiparb,
Surawong Rd., Suriyawongse, Bangrak,
Bangkok 10500, and
this is the
subject’s current operation
address.
THE BOARD OF DIRECTOR
|
Name |
|
Nationality |
Age |
|
|
|
|
|
|
Mr. Sumon Suwanpatra |
[x] |
Thai |
68 |
|
Mr. Prayuth Suwanpatra |
[x] |
Thai |
60 |
|
Mr. Prawit Suwanpatra |
|
Thai |
62 |
|
Mr. Tawatchai Chaiyapinan |
|
Thai |
58 |
|
Mr. Montree Mangkornkanonk |
|
Thai |
65 |
|
Mr. Karoon Taedamrongvanich |
|
Thai |
59 |
|
Mr. Kiyotaka Emori |
|
Japanese |
51 |
|
Mr. Krit Charoensiriwat |
|
Thai |
42 |
|
Mrs. Suwanna Fakpairoj |
|
Thai |
61 |
AUTHORIZED PERSON
Any one of
the mentioned directors [x]
can sign or
any two of
the rest directors
can jointly sign
on behalf of
the subject with
company’s affixed.
MANAGEMENT
Mr. Prayuth Suwanpatra is
the Managing Director.
He is Thai
nationality with the
age of 60
years old.
Mr. Krit Charoensiriwat is the Marketing
Manager.
He is Thai
nationality with the
age of 42
years old.
BUSINESS OPERATIONS
The subject
is engaged in
importing and distributing
wide range of
industrial chemicals, includes
textile dyestuff & textile
chemical, caustic soda [50%],
acetic acid, hydrogen
peroxide [50%], sodium
hydrosulfite, plating
chemicals, as well
as energy saving
equipment, etc.
IMPORT
Most of the
products is imported
from Japan, India,
Taiwan and Republic
of China.
MAJOR SUPPLIER
STC Nicca Co.,
Ltd. :
Nicca
Chemical Co., Ltd. :
TOA
Resin Corporation Ltd. :
SALES
100% of the
products is sold
locally to wholesalers,
manufacturers and end-users.
SUBSIDIARY AND AFFILIATED
COMPANY
The subject is
not found to
have any subsidiary
nor affiliated company
here in Thailand.
LITIGATION
Bankruptcy and
Receivership
There are no
litigation on bankruptcy
and receivership cases
filed against the
subject found at
Legal Execution Department
for the past
five years.
Others
There are no
legal suits filed
against the subject for
the past two
years.
CREDIT
Sales are by
cash or on
the credits term
of 30-60 days.
Local bills are
paid by cash
or on the
credits term of
30-60 days.
Imports are by
L/C at sight
or T/T.
BANKING
Bangkok
Bank Public Co.,
Ltd.
EMPLOYMENT
The
subject employs approximately
120 staff.
LOCATION
DETAILS
The
premise is rented
for administrative office
at the heading
address. Premise is
located in prime
commercial area.
Warehouse
is located at
9/2 Soi Chanpring,
Rama 2 Rd.,
Bangmod, Bangkhunthien, Bangkok
10150. Tel. [66]
2476-5983-4, Fax. [66] 2468-5161.
REMARK
CREDIT
OF US$ 125,000
AGAINST DA TERMS
SHOULD BE IN
ORDER.
COMMENT
Even
though the subject’s performance
had been slowing
down in 2009,
its business remained strong
and also had a
good business record.
Nevertheless the recovery
of some industries
in 2010 were
considered good, which
has resulted to
fast changing market situation and
demand of chemical
products has been
speed up to
cover their needs.
FINANCIAL INFORMATION
The
capital was registered
at Bht. 4,000,000 divided into 40,000 shares of Bht.
100 each with
fully paid.
On
April 23, 1999,
capital was increased
to Bht. 40,000,000 divided
into 400,000 shares of Bht.
100 each
with fully paid.
MAIN
SHAREHOLDERS : [as at
March 23, 2010]
|
NAME |
HOLDING |
% |
|
|
|
|
|
Mr. Prayuth Suwanpatra Nationality: Thai Address : Pathumwan, |
93,000 |
23.25 |
|
Emori Co., Ltd. Nationality: Japanese Address : 1-6-23
Keya, |
60,000 |
15.00 |
|
Mr. Sumon Suwanpatra Nationality: Thai Address : |
60,000 |
15.00 |
|
STC Nikka Co.,
Ltd. Nationality: Thai Address : |
40,000 |
10.00 |
|
Mr. Prawit Suwanpatra Nationality: Thai Address : 50-50/1
Rama 4 Rd.,
Mahaprutharam,
Bangrak, |
40,000 |
10.00 |
|
Mr. Karoon Taedamrongvanich Nationality: Thai Address : 275/8
Rama 3 Rd.,
Bangkorlaem, |
20,000 |
5.00 |
|
Mr. Chutipat Bhodiratanagkul Nationality: Thai Address : |
20,000 |
5.00 |
|
Others |
67,000 |
16.75 |
Total Shareholders : 17
NAME OF AUDITOR
& CERTIFIED PUBLIC
ACCOUNTANT NO. :
Mr. Sukij Aranyakasemsuk No.
2364
BALANCE SHEET [BAHT]
The latest
financial figures published
for December 31,
2009 & 2008
were:
ASSETS
|
Current Assets |
2009 |
2008 |
|
|
|
|
|
Cash in Hand
& at Bank |
36,229,703.15 |
20,950,348.50 |
|
Short-term Investment |
119,225.74 |
115,912.31 |
|
Trade Accounts Receivable |
262,175,420.69 |
248,973,810.76 |
|
Inventories |
68,061,544.47 |
68,499,484.11 |
|
Other Current Assets
Advance Payment |
4,067,459.12 |
4,257,033.58 |
|
Prepaid Expenses |
364,949.69 |
457,448.00 |
|
Deferred Income |
1,609,684.05 |
1,594,699.72 |
|
Others |
48,017.07 |
48,017.07 |
|
|
|
|
|
Total Current Assets
|
372,676,003.98 |
344,896,754.05 |
|
Long-term Investment |
35,162,200.00 |
35,136,200.00 |
|
Fixed Assets |
32,445,362.79 |
35,981,727.79 |
|
Other Assets |
36,853.00 |
6,000.00 |
|
Total Assets |
440,320,419.77 |
416,020,681.84 |
LIABILITIES &
SHAREHOLDERS' EQUITY [BAHT]
|
Current
Liabilities |
2009 |
2008 |
|
|
|
|
|
Bank Overdraft &
Short-term Loan from Bank |
40,466,664.30 |
45,053,753.09 |
|
Trade Accounts Payable |
192,105,467.31 |
178,104,606.56 |
|
Sale Department Payable |
431,478.27 |
1,178,273.83 |
|
Accrued Income Tax |
5,906,055.32 |
4,572,650.92 |
|
Reserve for Retirement
Liabilities |
1,769,280.00 |
1,654,280.00 |
|
Other Current Liabilities |
17,319,245.84 |
18,220,137.51 |
|
|
|
|
|
Total Current Liabilities |
257,998,191.04 |
248,783,701.91 |
|
Total Liabilities |
257,998,191.04 |
248,783,701.91 |
|
|
|
|
|
Shareholders' Equity |
|
|
|
|
|
|
|
Share capital : Baht 100
par value authorized, issued
and fully paid share
capital 400,000 shares |
40,000,000.00 |
40,000,000.00 |
|
|
|
|
|
Capital Paid |
40,000,000.00 |
40,000,000.00 |
|
Retained Earning Appropriated for Statutory Reserve |
4,000,000.00 |
4,000,000.00 |
|
Unappropriated |
138,296,228.73 |
123,236,979.93 |
|
Total Shareholders' Equity |
182,296,228.73 |
167,236,979.93 |
|
Total Liabilities & Shareholders' Equity |
440,294,419.77 |
416,020,681.84 |
PROFIT & LOSS ACCOUNT
|
|
2009 |
2008 |
|
|
|
|
|
Sales |
953,826,077.19 |
1,145,971,168.27 |
|
Dividend Income |
1,080,000.00 |
1,400,000.00 |
|
Other Income - Interest
Income |
291,046.31 |
482,691.38 |
|
- Gain
from |
355,235.50 |
665,021.59 |
|
- Gain
from Exchange Rate |
118,566.34 |
- |
|
- Others |
4,111,737.93 |
4,317,206.99 |
|
Total Sales |
959,782,663.27 |
1,152,836,088.23 |
|
Expenses |
|
|
|
|
|
|
|
Cost of Goods
Sold |
849,384,059.87 |
1,029,053,363.08 |
|
Selling Expenses |
31,903,860.34 |
34,112,223.50 |
|
Administrative Expenses |
45,313,762.01 |
50,439,857.20 |
|
Other Expenses - Loss
from Exchange Rate |
- |
78,702.78 |
|
- Loss
from Diminution of
Assets |
- |
3,742,089.56 |
|
Total Expenses |
926,601,682.22 |
1,117,426,236.12 |
|
|
|
|
|
Profit / [Loss] before Interest
Expenses & Income Tax |
33,180,981.05 |
35,409,852.11 |
|
Interest Expenses |
[2,556,161.54] |
[4,141,059.28] |
|
Income Tax |
[9,565,570.71] |
[9,568,441.72] |
|
|
|
|
|
Net Profit / [Loss] |
21,059,248.80 |
21,700,351.11 |
FINANCIAL ANALYSIS
|
ITEM |
UNIT |
2009 |
2008 |
|
|
|
|
|
|
LIQUIDITY RATIO |
|
|
|
|
CURRENT RATIO |
TIMES |
1.44 |
1.39 |
|
QUICK RATIO |
TIMES |
1.16 |
1.09 |
|
|
|
|
|
|
ACTIVITY RATIO |
|
|
|
|
FIXED ASSETS TURNOVER |
TIMES |
29.40 |
31.85 |
|
TOTAL ASSETS TURNOVER |
TIMES |
2.17 |
2.75 |
|
INVENTORY CONVERSION PERIOD |
DAYS |
29.25 |
24.30 |
|
INVENTORY TURNOVER |
TIMES |
12.48 |
15.02 |
|
RECEIVABLES CONVERSION PERIOD |
DAYS |
100.33 |
79.30 |
|
RECEIVABLES TURNOVER |
TIMES |
3.64 |
4.60 |
|
PAYABLES CONVERSION PERIOD |
DAYS |
82.55 |
63.17 |
|
CASH CONVERSION CYCLE |
DAYS |
47.02 |
40.42 |
|
|
|
|
|
|
PROFITABILITY
RATIO |
|
|
|
|
COST OF GOODS SOLD |
% |
89.05 |
89.80 |
|
SELLING & ADMINISTRATION |
% |
8.10 |
7.38 |
|
INTEREST |
% |
0.27 |
0.36 |
|
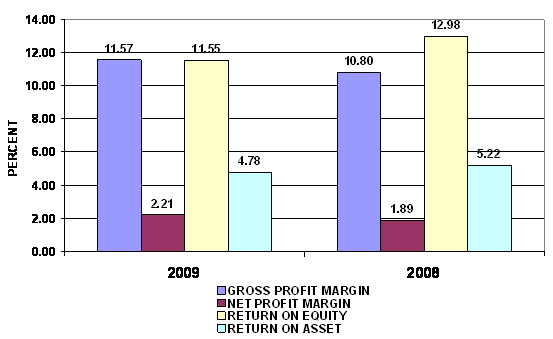
GROSS PROFIT MARGIN |
% |
11.57 |
10.80 |
|
NET PROFIT MARGIN BEFORE EX. ITEM |
% |
3.48 |
3.09 |
|
NET PROFIT MARGIN |
% |
2.21 |
1.89 |
|
RETURN ON EQUITY |
% |
11.55 |
12.98 |
|
RETURN ON ASSET |
% |
4.78 |
5.22 |
|
EARNING PER SHARE |
BAHT |
52.65 |
54.25 |
|
|
|
|
|
|
LEVERAGE RATIO |
|
|
|
|
DEBT RATIO |
TIMES |
0.59 |
0.60 |
|
DEBT TO EQUITY RATIO |
TIMES |
1.42 |
1.49 |
|
TIME INTEREST EARNED |
TIMES |
12.98 |
8.55 |
|
|
|
|
|
|
ANNUAL GROWTH |
|
|
|
|
SALES GROWTH |
% |
(16.77) |
|
|
OPERATING PROFIT |
% |
(6.29) |
|
|
NET PROFIT |
% |
(2.95) |
|
|
FIXED ASSETS |
% |
(9.83) |
|
|
TOTAL ASSETS |
% |
5.84 |
|
PROFITABILITY RATIO
|
Gross Profit Margin |
11.57 |
Impressive |
Industrial Average |
10.07 |
|
Net Profit Margin |
2.21 |
Impressive |
Industrial Average |
1.37 |
|
Return on Assets |
4.78 |
Impressive |
Industrial Average |
3.50 |
|
Return on Equity |
11.55 |
Impressive |
Industrial Average |
10.32 |
Gross Profit Margin used to assess a firm's financial health by revealing
the proportion of money left over from sales after accounting for the cost of
goods sold. Gross profit margin serves as the source for paying additional
expenses and future savings. The company’s figure is 11.57%. When compared with the industry
average, the ratio of the company was higher, indicated that company was more
profitable than the same industry.
Net Profit Margin is the indicator of the company's efficiency in that
net profit takes into consideration all expenses of the company. A low profit
margin indicates a low margin of safety, higher risk that a decline in sales
will erase profits and result in a net loss. The company’s figure is 2.21% compared with those of its average
competitors in the same industry, indicated that business was an efficient
operators in a dominant position within its industry.
Return on Assets measures how efficiently profits are being generated
from the assets employed in the business when compared with the ratios of firms
in a similar business. A low ratio in comparison with industry averages
indicates an inefficient use of business assets. Return on Assets is 4.78%,
higher figure when compared with those of its average competitors in the same
industry, indicated that business was an efficient profit in a dominant position within its industry.
Return on Equity indicates how profitable a company is by comparing its
net income to its average shareholders' equity, ROE measures how much the
shareholders earned for their investment in the company. Return on Equity is
11.55%, higher figure when compared with those of its average competitors in
the same industry, indicated that business was an efficient profit in a dominant position within its industry.
Trend of the
average competitors in the same industry for last 5 years
Return on Assets Uptrend
Return on Equity Downtrend

LIQUIDITY RATIO
|
Current Ratio |
1.44 |
Impressive |
Industrial Average |
1.41 |
|
Quick Ratio |
1.16 |
|
|
|
|
Cash Conversion Cycle |
47.02 |
|
|
|
The Current Ratio is to ascertain whether a company's short-term assets
are readily available to pay off its short-term liabilities. The company's
figure is 1.44 times in 2009, increase from 1.39 times, then it is generally
considered to have good short-term financial strength. When compared with the
industry average, the ratio of the company was higher, indicated that company
was an efficient operator in a dominant
position within its industry.
The Quick Ratio is a liquidity indicator that further refines the
current ratio by measuring the amount of the most liquid current assets there
are to cover current liabilities. The company's figure is 1.16 times in 2009,
increase from 1.09 times, although excluding inventory so the company still
have good short-term financial strength.
The Cash Conversion Cycle measures the number of days a company's cash
is tied up in the production and sales process of its operations and the
benefit from payment terms from its
creditors. It meant the company could survive when no cash inflow was received
from sale for 48 days.
Trend of the
average competitors in the same industry for last 5 years
Current Ratio Uptrend


LEVERAGE RATIO
|
Debt Ratio |
0.59 |
Impressive |
Industrial Average |
0.61 |
|
Debt to Equity Ratio |
1.42 |
Acceptable |
Industrial Average |
1.74 |
|
Times Interest Earned |
12.98 |
Impressive |
Industrial Average |
2.23 |
Debt to Equity Ratio a measurement of how much suppliers, lenders, creditors
and obligors have committed to the company versus what the shareholders have
committed. A lower the percentage means that the company is using less leverage
and has stronger equity position.
Times Interest Earned measuring a company's ability to meet its debt
obligations. Ratio is 12.99 higher than 1, so the company can pay interest
expenses on outstanding debt.
Debt Ratio shows the proportion of a company's assets which are financed
through debt. The company's figure is 0.59 greater than 0.5, most of the
company's assets are financed through debt.
Trend of the
average competitors in the same industry for last 5 years
Debt Ratio Downtrend
Times Interest Earned Uptrend

ACTIVITY RATIO
|
Fixed Assets Turnover |
29.40 |
Impressive |
Industrial Average |
10.31 |
|
Total Assets Turnover |
2.17 |
Satisfactory |
Industrial Average |
2.56 |
|
Inventory Conversion Period |
29.25 |
|
|
|
|
Inventory Turnover |
12.48 |
Impressive |
Industrial Average |
7.30 |
|
Receivables Conversion Period |
100.33 |
|
|
|
|
Receivables Turnover |
3.64 |
Satisfactory |
Industrial Average |
4.60 |
|
Payables Conversion Period |
82.55 |
|
|
|
Trend of the
average competitors in the same industry for last 5 years
Fixed Assets Turnover Downtrend
Total Assets Turnover Uptrend
Inventory Turnover Uptrend
Receivables Turnover Uptrend
FOREIGN EXCHANGE RATES
|
Currency |
Unit
|
Indian Rupees |
|
US Dollar |
1 |
Rs.45.74 |
|
|
1 |
Rs.72.73 |
|
Euro |
1 |
Rs.62.73 |
RATING EXPLANATIONS
|
RATING |
STATUS |
PROPOSED CREDIT LINE |
|
|
>86 |
Aaa |
Possesses an extremely sound financial base with the strongest
capability for timely payment of interest and principal sums |
Unlimited |
|
71-85 |
Aa |
Possesses adequate working capital. No caution needed for credit
transaction. It has above average (strong) capability for payment of interest
and principal sums |
Large |
|
56-70 |
A |
Financial & operational base are regarded healthy. General unfavourable
factors will not cause fatal effect. Satisfactory capability for payment of
interest and principal sums |
Fairly Large |
|
41-55 |
Ba |
Overall operation is considered normal. Capable to meet normal
commitments. |
Satisfactory |
|
26-40 |
B |
Capability to overcome financial difficulties seems comparatively
below average. |
Small |
|
11-25 |
Ca |
Adverse factors are apparent. Repayment of interest and principal sums
in default or expected to be in default upon maturity |
Limited with full
security |
|
<10 |
C |
Absolute credit risk exists. Caution needed to be exercised |
Credit not
recommended |
This score serves as a reference to assess SC’s credit risk and
to set the amount of credit to be extended. It is calculated from a composite
of weighted scores obtained from each of the major sections of this report. The
assessed factors and their relative weights (as indicated through %) are as
follows:
Financial
condition (40%) Ownership
background (20%) Payment
record (10%)
Credit history
(10%) Market trend
(10%) Operational
size (10%)
This report is issued at your request without any
risk and responsibility on the part of MIRA INFORM PRIVATE LIMITED (MIPL)
or its officials.