![]()
MIRA
INFORM REPORT
|
Report Date : |
17.06.2011 |
IDENTIFICATION DETAILS
|
Name : |
SAFETY SHOES
COMPANY LIMITED |
|
|
|
|
Registered Office : |
318/10-22
Sukhumvit 22 Road, Klongtoey, Bangkok
10110 |
|
|
|
|
Country : |
Thailand |
|
|
|
|
Financials (as on) : |
31.12.2009 |
|
|
|
|
Date of Incorporation : |
01.06.1983 |
|
|
|
|
Com. Reg. No.: |
0115526000418 |
|
|
|
|
Legal Form : |
Private
Limited Company |
|
|
|
|
Line of Business : |
Manufacturer, Distributor
and Exporter of Safety Shoes
and Related Equipment |
RATING & COMMENTS
|
MIRA’s Rating : |
B |
|
RATING |
STATUS |
PROPOSED CREDIT LINE |
|
|
26-40 |
B |
Capability to overcome financial difficulties seems comparatively
below average. |
Small |
|
Status : |
Moderate |
|
Payment Behaviour : |
No Complaints |
|
Litigation : |
Clear |
NOTES :
Any query related to this report can be made
on e-mail: infodept@mirainform.com
while quoting report number, name and date.
ECGC Country Risk Classification List – March 31st, 2011
|
Country Name |
Previous Rating (31.12.2010) |
Current Rating (31.03.2011) |
|
Thailand |
B1 |
B1 |
|
Risk Category |
ECGC
Classification |
|
Insignificant |
A1 |
|
Low |
A2 |
|
Moderate |
B1 |
|
High |
B2 |
|
Very High |
C1 |
|
Restricted |
C2 |
|
Off-credit |
D |
Company name
SAFETY
SHOES COMPANY LIMITED
SUMMARY
BUSINESS
ADDRESS : 318/10-22 SUKHUMVIT
22 ROAD,
KLONGTOEY, BANGKOK
10110
TELEPHONE : [66] 2259-0320,
2259-2680-3
FAX :
[66] 2259-7504,
2259-5268
E-MAIL
ADDRESS : pangolin@charoensin.co.th
REGISTRATION
ADDRESS : 199/8
MOO 3, PANTHONG-BANBUENG ROAD,
BANBUENG, CHONBURI
20170
ESTABLISHED
: 1983
REGISTRATION
NO. : 0115526000418 [Former : SOR
POR. 350]
CAPITAL REGISTERED : BHT. 80,000,000
CAPITAL PAID-UP : BHT.
80,000,000
FISCAL YEAR CLOSING DATE : DECEMBER 31
LEGAL
STATUS : PRIVATE LIMITED
COMPANY
EXECUTIVE : MR. PUWASIT WONGCHAROENSIN, THAI
MANAGING DIRECTOR
NO.
OF STAFF : 630
LINES
OF BUSINESS : SAFETY SHOES
AND RELATED EQUIPMENT
MANUFACTURER, DISTRIBUTOR
AND EXPORTER
CORPORATE PROFILE
OPERATING
TREND : STABLE
PRESENT
SITUATION : OPERATING NORMALLY
REPUTATION : GOOD
WITH NORMAL BUSINESS
ENGAGEMENT
MANAGEMENT
STANDARD : MANAGEMENT GOOD
FAIR PERFORMANCE
HISTORY
The
subject was established
on June 1,
1983 as a
private limited company
under the name
style SAFETY SHOES
COMPANY LIMITED, by
Thai groups, the
Wongcharoensin family, in
order to manufacture
safety shoes and
related equipment to
both domestic and
oversea markets. It
currently employs approximate
630 staff.
The major
shareholders are Charoensin
Asset Co., Ltd., and
Charoensin Holding Co.,
Ltd., which are
members of Charoensin
group of companies.
The
subject’s registered address
is 199/8 Moo
3, Panthong-Banbueng Rd.,
Banbueng, Chonburi 20170,
while the current
operation address is
at 318/10-22 Sukhumvit
22 Rd., Klongtoey,
Bangkok 10110.
THE BOARD
OF DIRECTORS
|
Name |
|
Nationality |
Age |
|
|
|
|
|
|
Mr. Rattanachai Wongcharoensin |
[x] |
Thai |
61 |
|
Mr. Manit Wongcharoensin |
|
Thai |
64 |
|
Mr. Viwat Wongcharoensin |
|
Thai |
40 |
|
Mr. Puwasit [Teerachai] Wongcharoensin |
|
Thai |
37 |
|
Mr. Kitichai Wongcharoensin |
|
Thai |
35 |
Note.
“Mr. Puwasit” changed his
name from “Mr. Teerachai” in
2010.
AUTHORIZED PERSON
Two of the
above directors excepted
the director [x]
can jointly sign
on behalf of
the subject with
company’s affixed.
MANAGEMENT
Mr. Puwasit Wongcharoensin is
the Managing Director.
He is Thai
nationality with the
age of 37
years old.
Mrs. U-sa Wongcharoensin is
the Executive Director
[Finance & Accounting].
She is Thai
nationality.
Mr. Liyu Lianti Kwang
is the Exports
Manager.
He is Chinese nationality.
BUSINESS OPERATIONS
The subject is
engaged in manufacturing
safety shoes, mainly
steel toed capped,
as well as
safety helmet and
other related equipment.
MAJOR BRANDS
“PANGOLIN” and “GOLDEN
ANCHOR SHOES”
PRODUCTION CAPACITY
Safety shoes
: 800 pairs
per day
PURCHASE
Raw materials and machinery
are purchased from
suppliers both domestic
and overseas, mainly
in U.S.A., Germany,
Republic of China,
Taiwan, Japan and
European countries.
SALES
80% of the
products is sold
locally by wholesale
to dealers and
end-users, as well as
the remaining 20% is exported
to Singapore, Hong Kong,
Malaysia, Australia, Japan,
Europe and Middle
East countries.
SUBSIDIARY AND
AFFILIATED COMPANY
The subject is
not found to
have any subsidiary
nor affiliated company
here in Thailand.
LITIGATION
Bankruptcy and Receivership
There are no
litigation on bankruptcy
and receivership cases
filed against the
subject found at
Legal Execution Department
for the past
five years.
Others
There are no
legal suits filed
against the subject
for the past
two years.
CREDIT
Sales are by
cash or on
the credits term
of 30-60 days.
Local bills are
paid by cash
or on the
credits term of
30-60 days.
Imports are by
L/C at sight
or T/T.
Exports are against
L/C at sight
or T/T.
BANKING
Bangkok Bank Public
Co., Ltd.
Kasikornbank Public Co.,
Ltd.
EMPLOYMENT
The
subject employs approximately
630 staff.
LOCATION DETAILS
The
premise is owned
for administrative office
at the heading
address. Premise is
located in commercial/residential area.
Factory
and warehouse are
located at 199/8
Moo 3, Panthong-Banbueng Rd.,
Banbueng, Chonburi 20170.
Branches
and showrooms :
The
subject currently has
12 branches, located
in provincial as
follows:
-
267/6-7
Sukhumvit Rd., Maptaphut,
Rayong 21150.
-
133/29-30
Moo 7, Sukhumvit
Rd., Bangpoomai, Samutprakarn
10280
-
54/109
Moo 13, Phaholyothin
Rd., Klongnueng, Klongmuang,
Pathumthani 12120.
-
90/62
Moo 6, Phaolyothin
Rd., Chiangraknoi, Bangpa-in,
Ayudhya 13160.
-
318/10-22 Sukhumvit 22
Rd., Klongtoey, Bangkok
10110.
-
99/9
Moo 3, By-pas
Rd., Nongmaidaeng, Muang,
Chonburi 20000.
-
333/101-102
Moo 3, Bor-win,
Sriracha, Chonburi 20110.
-
111/33
Moo 6, Rama
2 Rd., Samaedam,
Bangkhunthien, Bangkok 10150.
-
11/20-21
Moo 1, Bangna-Trad
Rd., Bangchalong, Bangplee,
Samutprakarn 10540.
-
235 Moo 10,
Thatoom, Srimahaphote, Prachinburi
25140.
-
5/2-3
Moo 8, Petchkasem
Rd., Omyai, Sampran,
Nakornpathom 73160.
-
99/419-421
Moo 9, Bangna-Trad
Rd., Bangchalong, Bangplee,
Samutprakarn 10540.
REMARK
CREDIT
OF US$ 125,000 AGAINST
D/A TERM SHOULD
BE IN ORDER.
COMMENT
The subject’s sales
revenue in 2009 was
dropped comparing to
the same period
of 2008 due
to lower demand
of the products
from both local and
overseas markets. However, industrial improvement
would also spur
demand of the
products. This would
be a good benefit
to the subject.
Generally, its business remains
solid.
FINANCIAL INFORMATION
The
capital was registered
at Bht. 10,000,000 divided into 1,000 shares of Bht. 10,000 each.
The
capital was increased
later as following:
Bht. 20,000,000
on September 9,
1994
Bht. 50,000,000
on December 12,
2000
Bht. 80,000,000
on October 2,
2002
The
latest registered capital
was increased to Bht. 80,000,000 divided into 8,000,000 shares
of Bht. 10
each with fully
paid.
MAIN SHAREHOLDERS
[as at December
24, 2010]
|
NAME |
HOLDING |
% |
|
|
|
|
|
Charoensin Asset Co.,
Ltd. Nationality: Thai Address : 318/10-22
Sukhumvit 22 Rd.,
Klongtoey, Bangkok |
3,200,000 |
40.00 |
|
Charoensin Holding Co.,
Ltd. Nationality: Thai Address : 318/10-22
Sukhumvit 22 Rd.,
Klongtoey, Bangkok |
2,000,000 |
25.00 |
|
Mr. Chiu Nan Kwang Nationality: Chinese Address : 318/10-22
Sukhumvit 22 Rd.,
Klongtoey, Bangkok |
1,200,000 |
15.00 |
|
Master Isara Wongcharoensin Nationality: Thai Address : 750
Moo 1, Sukhumvit
Rd., Bangpoomai, Muang, Samutprakarn |
420,000 |
5.25 |
|
Mr. Viwat Wongcharoensin Nationality: Thai Address : 180
Moo 7, Sukhumvit
Rd., Bangpoomai, Muang, Samutprakarn |
350,000 |
4.38 |
|
Mrs. Payao Wongcharoensin Nationality: Thai Address : 700/1
Moo 1, Sukhumvit
Rd.,
Bangpoomai, Muang, Samutprakarn |
280,000 |
3.50 |
|
Mr. Natthakit Wongcharoensin Nationality: Thai Address : 180
Moo 7, Sukhumvit
Rd., Bangpoomai, Muang, Samutprakarn |
280,000 |
3.50 |
|
Other Shareholders |
270,000 |
3.37 |
Total Shareholders : 16
NAME OF AUDITOR
& CERTIFIED PUBLIC
ACCOUNTANT NO.
Mr. Vichit Luechaiprasit No.
3563
BALANCE SHEET [BAHT]
The
latest financial figures
published for December
31, 2009 &
2008 were:
ASSETS
|
Current Assets |
2009 |
2008 |
|
|
|
|
|
Cash in hand
& at Bank
|
14,340,027.40 |
10,321,639.47 |
|
Trade Accts. Receivable |
49,508,681.89 |
56,632,819.01 |
|
Inventories |
125,948,490.94 |
122,363,363.46 |
|
Other Current Assets
|
1,137,411.29 |
5,113,972.07 |
|
Total Current Assets
|
190,934,611.52 |
194,431,794.01 |
|
|
|
|
|
Fixed Assets |
116,295,636.54 |
126,010,776.45 |
|
Leasehold Right |
2,279,911.34 |
2,509,690.98 |
|
Other Assets |
606,763.56 |
284,100.00 |
|
Total Assets |
310,116,922.96 |
323,236,361.44 |
LIABILITIES &
SHAREHOLDERS' EQUITY [BAHT]
|
Current
Liabilities |
2009 |
2008 |
|
|
|
|
|
Bank Overdraft &
Short-term Loan from Financial Institution |
28,128,113.37 |
53,489,283.62 |
|
Trade Accts. Payable |
46,609,678.73 |
61,338,697.80 |
|
Current Portion of Long-term Loan from Related Person |
27,100,000.00 |
34,700,000.00 |
|
Current Portion of Long-term Loan from Financial Institution |
12,922,782.59 |
11,742,878.81 |
|
Current Portion of
Hire-purchase Payable |
- |
293,867.76 |
|
Other Current Liabilities |
|
|
|
Accrued Expenses |
7,485,848.49 |
4,661,132.85 |
|
Others |
1,600,174.79 |
2,579,448.98 |
|
Total Current Liabilities |
123,846,597.97 |
168,805,309.82 |
|
|
|
|
|
Long-term Loans from
Related Person, Net
of Current Portion |
82,700,000.00 |
27,100,000.00 |
|
Long-term Loans from Financial,
Net of Current Portion |
11,885,641.94 |
25,171,141.62 |
|
Other Liabilities |
206,500.00 |
1,406,500.00 |
|
Total Liabilities |
218,638,739.91 |
222,482,951.44 |
|
|
|
|
|
Shareholders' Equity |
|
|
|
|
|
|
|
Share capital : Baht 10
par value authorized, issued
and fully paid share
capital 8,000,000 shares |
80,000,000.00 |
80,000,000.00 |
|
Capital Paid |
80,000,000.00 |
80,000,000.00 |
|
Statutory Reserve |
1,062,688.81 |
- |
|
Retained Earning -
Unappropriated |
10,415,494.24 |
20,753,410.00 |
|
Total Shareholders' Equity |
91,478,183.05 |
100,753,410.00 |
|
Total Liabilities & Shareholders' Equity |
310,116,922.96 |
323,236,361.44 |
PROFIT &
LOSS ACCOUNT
|
Revenue |
2009 |
2008 |
|
|
|
|
|
Sales |
272,867,031.97 |
302,041,898.85 |
|
Other Income |
1,712,075.84 |
6,804,094.65 |
|
Total Revenues |
274,579,107.81 |
308,845,993.50 |
|
Expenses |
|
|
|
|
|
|
|
Cost of Goods
Sold |
202,658,157.82 |
230,073,661.92 |
|
Selling Expenses |
23,078,537.68 |
25,986,422.48 |
|
Administrative Expenses |
39,398,838.19 |
37,849,525.15 |
|
Total Expenses |
265,135,533.69 |
293,909,609.55 |
|
Profit/ [Loss] Before Financial Expenses & Income Tax |
9,443,574.12 |
14,936,383.95 |
|
Financial Expenses |
[6,622,075.26] |
[8,134,415.92] |
|
Profit/ [Loss] Before Income Tax |
2,821,498.86 |
6,801,968.03 |
|
Income Tax |
[2,096,725.81] |
[2,669,773.33] |
|
Net Profit / [Loss] |
724,773.05 |
4,132,194.70 |
FINANCIAL ANALYSIS
|
ITEM |
UNIT |
2009 |
2008 |
|
|
|
|
|
|
LIQUIDITY RATIO |
|
|
|
|
CURRENT RATIO |
TIMES |
1.54 |
1.15 |
|
QUICK RATIO |
TIMES |
0.52 |
0.40 |
|
|
|
|
|
|
ACTIVITY RATIO |
|
|
|
|
FIXED ASSETS TURNOVER |
TIMES |
2.35 |
2.40 |
|
TOTAL ASSETS TURNOVER |
TIMES |
0.88 |
0.93 |
|
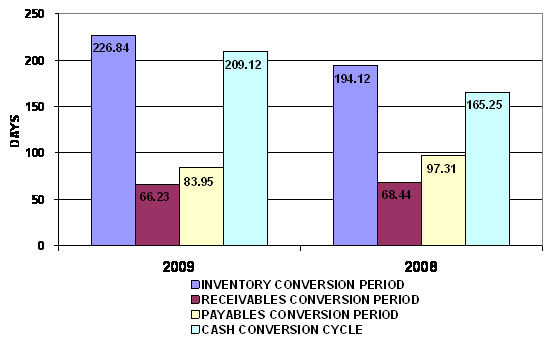
INVENTORY CONVERSION PERIOD |
DAYS |
226.84 |
194.12 |
|
INVENTORY TURNOVER |
TIMES |
1.61 |
1.88 |
|
RECEIVABLES CONVERSION PERIOD |
DAYS |
66.23 |
68.44 |
|
RECEIVABLES TURNOVER |
TIMES |
5.51 |
5.33 |
|
PAYABLES CONVERSION PERIOD |
DAYS |
83.95 |
97.31 |
|
CASH CONVERSION CYCLE |
DAYS |
209.12 |
165.25 |
|
|
|
|
|
|
PROFITABILITY
RATIO |
|
|
|
|
COST OF GOODS SOLD |
% |
74.27 |
76.17 |
|
SELLING & ADMINISTRATION |
% |
22.90 |
21.13 |
|
INTEREST |
% |
2.43 |
2.69 |
|
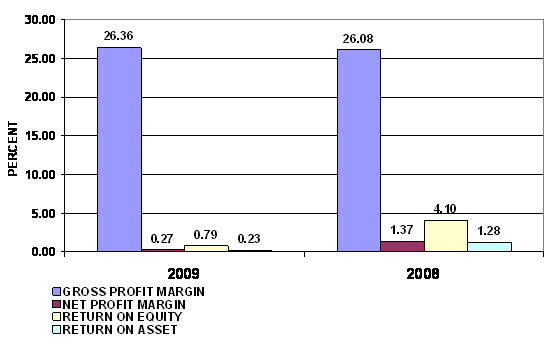
GROSS PROFIT MARGIN |
% |
26.36 |
26.08 |
|
NET PROFIT MARGIN BEFORE EX. ITEM |
% |
3.46 |
4.95 |
|
NET PROFIT MARGIN |
% |
0.27 |
1.37 |
|
RETURN ON EQUITY |
% |
0.79 |
4.10 |
|
RETURN ON ASSET |
% |
0.23 |
1.28 |
|
EARNING PER SHARE |
BAHT |
0.09 |
0.52 |
|
|
|
|
|
|
LEVERAGE RATIO |
|
|
|
|
DEBT RATIO |
TIMES |
0.71 |
0.69 |
|
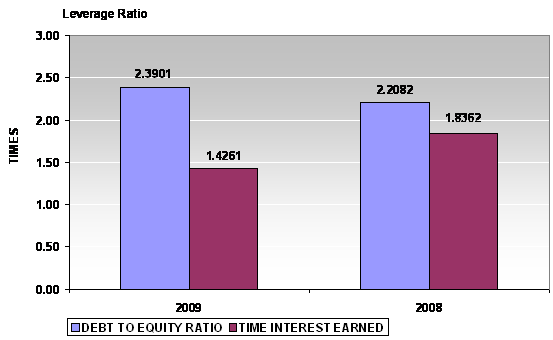
DEBT TO EQUITY RATIO |
TIMES |
2.39 |
2.21 |
|
TIME INTEREST EARNED |
TIMES |
1.43 |
1.84 |
|
|
|
|
|
|
ANNUAL GROWTH |
|
|
|
|
SALES GROWTH |
% |
(9.66) |
|
|
OPERATING PROFIT |
% |
(36.77) |
|
|
NET PROFIT |
% |
(82.46) |
|
|
FIXED ASSETS |
% |
(7.71) |
|
|
TOTAL ASSETS |
% |
(4.06) |
|
PROFITABILITY
RATIO
|
Gross Profit Margin |
26.36 |
Impressive |
Industrial Average |
15.67 |
|
Net Profit Margin |
0.27 |
Deteriorated |
Industrial Average |
1.06 |
|
Return on Assets |
0.23 |
Deteriorated |
Industrial Average |
1.74 |
|
Return on Equity |
0.79 |
Deteriorated |
Industrial Average |
6.16 |
Gross Profit Margin used to assess a firm's financial health by
revealing the proportion of money left over from revenues after accounting for the
cost of goods sold. Gross profit margin serves as the source for paying
additional expenses and future savings. The company’s figure is 26.36%. When compared with the
industry average, the ratio of the company was higher, This indicated that
company was more profitable than the same industry.
Net Profit Margin is the indicator of the company's efficiency in that
net profit takes into consideration all expenses of the company. A low profit
margin indicates a low margin of safety, higher risk that a decline in sales
will erase profits and result in a net loss. The company's figure is 0.27%.
When compared with the industry average, the ratio of the company was lower.
Return on Assets measures how efficiently profits are being generated
from the assets employed in the business when compared with the ratios of firms
in a similar business. A low ratio in comparison with industry averages
indicates an inefficient use of business assets. When compared with the
industry average, it was lower, the company's figure is 0.23%.
Return on Equity indicates how profitable a company is by comparing its
net income to its average shareholders' equity, ROE measures how much the
shareholders earned for their investment in the company. When compared with the
industry average, it was lower, the company's figure is 0.79%.
Trend of the
average competitors in the same industry for last 5 years
Return on Assets Uptrend
Return on Equity Uptrend
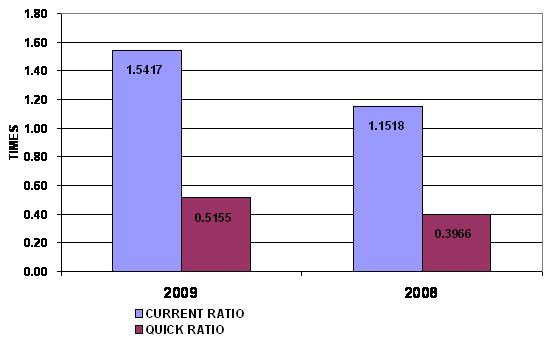
LIQUIDITY RATIO
|
Current Ratio |
1.54 |
Impressive |
Industrial Average |
1.16 |
|
Quick Ratio |
0.52 |
|
|
|
|
Cash Conversion Cycle |
209.12 |
|
|
|
The Current Ratio is to ascertain whether a company's short-term assets
are readily available to pay off its short-term liabilities. The company's figure
is 1.54 times in 2009, increase from 1.15 times, then it is generally
considered to have good short-term financial strength. When compared with the
industry average, the ratio of the company was higher, indicated that company
was an efficient operator in a dominant position within its industry.
The Quick Ratio is a liquidity indicator that further refines the
current ratio by measuring the amount of the most liquid current assets there
are to cover current liabilities. The company's figure is 0.52 times in 2009,
increase from 0.4 times, then the company has not enough current assets that
presumably can be quickly converted to cash for pay financial obligations.
The Cash Conversion Cycle measures the number of days a company's cash
is tied up in the production and sales process of its operations and the
benefit from payment terms from its creditors. It meant the company could
survive when no cash inflow was received from sale for 210 days.
Trend of the average
competitors in the same industry for last 5 years
Current Ratio Downtrend
LEVERAGE RATIO
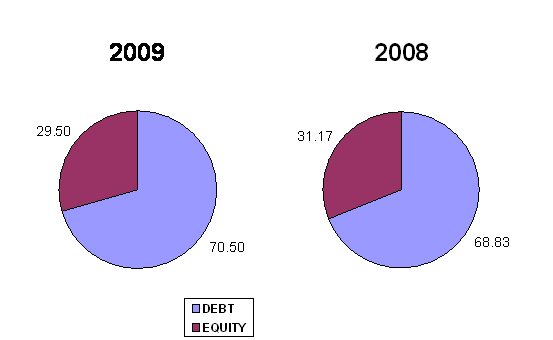
|
Debt Ratio |
0.71 |
Impressive |
Industrial Average |
0.64 |
|
Debt to Equity Ratio |
2.39 |
Risky |
Industrial Average |
2.10 |
|
Times Interest Earned |
1.43 |
Impressive |
Industrial Average |
1.37 |
Debt to Equity Ratio a measurement of how much suppliers, lenders,
creditors and obligors have committed to the company versus what the shareholders
have committed. A lower the percentage means that the company is using less
leverage and has a stronger equity position.
Times Interest Earned measuring a company's ability to meet its debt obligations.
Ratio is 1.43 higher than 1, so the company can pay interest expenses on
outstanding debt.
Debt Ratio shows the proportion of a company's assets which are financed
through debt. The company's figure is 0.71 greater than 0.5, most of the company's
assets are financed through debt.
Trend of the
average competitors in the same industry for last 5 years
Debt Ratio Downtrend
Times Interest Earned Downtrend
ACTIVITY RATIO
|
Fixed Assets Turnover |
2.35 |
Acceptable |
Industrial Average |
4.09 |
|
Total Assets Turnover |
0.88 |
Acceptable |
Industrial Average |
1.64 |
|
Inventory Conversion Period |
226.84 |
|
|
|
|
Inventory Turnover |
1.61 |
Deteriorated |
Industrial Average |
3.86 |
|
Receivables Conversion Period |
66.23 |
|
|
|
|
Receivables Turnover |
5.51 |
Impressive |
Industrial Average |
4.23 |
|
Payables Conversion Period |
83.95 |
|
|
|
Trend of the
average competitors in the same industry for last 5 years
Fixed Assets Turnover Downtrend
Total Assets Turnover Downtrend
Inventory Turnover Downtrend
Receivables Turnover Downtrend
FOREIGN EXCHANGE RATES
|
Currency |
Unit
|
Indian Rupees |
|
US Dollar |
1 |
Rs.44.90 |
|
|
1 |
Rs.72.54 |
|
Euro |
1 |
Rs.63.39 |
RATING EXPLANATIONS
|
RATING |
STATUS |
PROPOSED CREDIT LINE |
|
|
>86 |
Aaa |
Possesses an extremely sound financial base with the strongest
capability for timely payment of interest and principal sums |
Unlimited |
|
71-85 |
Aa |
Possesses adequate working capital. No caution needed for credit
transaction. It has above average (strong) capability for payment of interest
and principal sums |
Large |
|
56-70 |
A |
Financial & operational base are regarded healthy. General unfavourable
factors will not cause fatal effect. Satisfactory capability for payment of
interest and principal sums |
Fairly Large |
|
41-55 |
Ba |
Overall operation is considered normal. Capable to meet normal
commitments. |
Satisfactory |
|
26-40 |
B |
Capability to overcome financial difficulties seems comparatively
below average. |
Small |
|
11-25 |
Ca |
Adverse factors are apparent. Repayment of interest and principal sums
in default or expected to be in default upon maturity |
Limited with full
security |
|
<10 |
C |
Absolute credit risk exists. Caution needed to be exercised |
Credit not
recommended |
|
-- |
NB |
New Business |
-- |
This score serves as a reference to assess SC’s credit risk and
to set the amount of credit to be extended. It is calculated from a composite
of weighted scores obtained from each of the major sections of this report. The
assessed factors and their relative weights (as indicated through %) are as
follows:
Financial
condition (40%) Ownership
background (20%) Payment
record (10%)
Credit history
(10%) Market trend
(10%) Operational
size (10%)
This report is issued at your request without any
risk and responsibility on the part of MIRA INFORM PRIVATE LIMITED (MIPL)
or its officials.