![]()
MIRA INFORM
REPORT
|
Report Date : |
27.06.2011 |
IDENTIFICATION DETAILS
|
Correct Name : |
CONTROL DE EMBALATGES |
|
|
|
|
Registered Office : |
Partida Lligallo La Lloma, S/N, 43560 La Senia
Tarragona |
|
|
|
|
Country : |
Spain |
|
|
|
|
Financials (as on) : |
31.12.2009 |
|
|
|
|
Date of Incorporation : |
|
|
|
|
|
Legal Form : |
Limited Liability Company |
|
|
|
|
Line of Business : |
RATING & COMMENTS
|
MIRA’s Rating : |
Ba |
|
RATING |
STATUS |
PROPOSED CREDIT LINE |
|
|
41-55 |
Ba |
Overall operation is considered normal. Capable to meet normal
commitments. |
Satisfactory |
|
Maximum Credit Limit : |
226.657,00 € |
|
Status : |
Satisfactory |
|
Payment
Behaviour : |
No Complaints |
|
Litigation : |
Clear |
NOTES :
Any query related to this report can be made
on e-mail : infodept@mirainform.com
while quoting report number, name and date.
ECGC Country Risk Classification List – March 31st, 2011
|
Country Name |
Previous Rating (31.12.2010) |
Current Rating (31.03.2011) |
|
Spain |
a2 |
a2 |
|
Risk Category |
ECGC
Classification |
|
Insignificant |
A1 |
|
Low |
A2 |
|
Moderate |
B1 |
|
High |
B2 |
|
Very High |
C1 |
|
Restricted |
C2 |
|
Off-credit |
D |
Company name
CONTROL DE EMBALATGES SL
TAX NUMBER: B43367796
Company situation: Active
EXECUTIVE
SUMMARY
Identification
Current Business Name: CONTROL DE EMBALATGES SL
Commercial name: CONTROLPACK
Other names: NO
Current Address: PARTIDA LLIGALLO LA
LLOMA, S/N
Branches: 2
Telephone number: 977713562 Fax: 977570078
URL: www.controlpack.com
Corporate e-mail: info@controlpack.net
Trade Risk
Credit Appraisal: 226.657,00 €
Incidents: NO
R.A.I.: NO
Bank and business defaults of payment - ASNEF EMPRESAS: NO
Financial Information
Latest sales known (2011): 15.000.000,00
€ (Forecast)
Balance sheet latest sales (2009): 10.235.029,38 € (Trade Register)
Result: 163.708,52 €
Total Assets: 5.780.558,56 €
Social Capital: 84.141,69 €
Employees: 40
Listed on a Stock Exchange: NO
Commercial Information
Incorporation date: 05/01/1993
Activity: Wholesale of other products
NACE 2009 CODE: 4669
International Operations: Imports and
Exports
Corporate Structure
Administrator:
Other Complementary Information
Latest filed accounts published in the Mercantile Register: 2009
Type of Accounts available at the Mercantile Register: Individuals
Latest act published in BORME: 16/09/2010 Annual Filed Accounts
Latest press article: 27/02/2011 DIARI DE
TARRAGONA (GENERAL INFORMATION)
Bank Entities: There are
The date when this report was last updated is 27/06/2011.
The information contained in this report has been investigated and contrasted
on 27/06/2011
Credit Appraisal
Maximum Credit
(from 0 to 6,000,000 €)
Favourable to 226.657,00 €
Financial Situation
Exercise:2009
|
Treasury |
Excellent |
|
Indebtedness |
Average |
|
Profitability |
Average |
|
Balance |
Excellent |
Performance
|
Incidents |
None or Negligible |
|
Business
Trajectory |
Superior |
INCIDENTS

Summary
LEGAL ACTIONS: No legal actions registered .
ADMINISTRATIVE CLAIMS: No administrative claims registered .
AFFECTED BY: No significant element.
BANK AND BUSINESS DEFAULTS OF
PAYMENT - ASNEF EMPRESAS
R.A.I.
COMPANY NOT REGISTERED IN THE R.A.I.
This company is not registered in the Disputed Bills register (R.A.I.)
DATE AND TIME OF THE CONSULTATION
27/06/2011 09:06:55
Information from the Registro de Aceptaciones Impagados (RAI)- Disputed
Bills register.
It can only be used for information legitimate needs of the consulting
party, in accordance with its social or business activity, in order to grant a
credit or the monitoring or control of the already granted credits and can not
be transmitted or communicated to thirds, nor copied, duplicated, reproduced
nor implemented to any database , owned or external, or reused it in anyway,
direct or indirectly.
FINANCIAL ELEMENTS AND SECTORIAL COMPARATIVE
FINANCIAL ELEMENTS
Figures given in €
|
|
31/12/2009 (12) BALANCE SHEET |
% ASSETS |
31/12/2008 (12) BALANCE SHEET |
% ASSETS |
|
ASSETS |
|
|
|
|
|
A) NON CURRENT ASSETS |
573.736,32 |
9,93 |
539.954,67 |
10,63 |
|
B) CURRENT ASSETS |
5.206.822,24 |
90,07 |
4.537.835,82 |
89,37 |
|
LIABILITIES |
|
|
|
|
|
A) NET WORTH |
1.998.465,75 |
34,57 |
1.837.757,23 |
36,19 |
|
B) NON CURRENT LIABILITIES |
185.000,54 |
3,20 |
191.297,20 |
3,77 |
|
C) CURRENT LIABILITIES |
3.597.092,27 |
62,23 |
3.048.736,06 |
60,04 |
Profit and Loss Account Analysis ![]()
Figures given in €
|
|
2011 FORECAST |
2010 ESTIMATED |
31/12/2009 (12) BALANCE SHEET |
% NET TURNOVER |
31/12/2008 (12) BALANCE SHEET |
% NET TURNOVER |
|
SALES |
15.000.000,00 |
13.500.000,00 |
10.235.029,38 |
|
11.658.186,65 |
|
|
GROSS MARGIN |
|
|
2.970.604,24 |
29,02 |
3.026.028,04 |
25,96 |
|
EBITDA |
|
|
537.374,83 |
5,25 |
572.850,67 |
4,91 |
|
EBIT |
|
|
328.763,54 |
3,21 |
293.843,50 |
2,52 |
|
NET RESULT |
|
|
163.708,52 |
1,60 |
131.316,18 |
1,13 |
|
EFFECTIVE TAX RATE (%) |
|
|
29,80 |
0,00 |
29,58 |
0,00 |
COMPARATIVE SECTOR ANALYSIS
Values table
Figures expressed in %
|
|
COMPANY (2009) |
SECTOR |
DIFFERENCE |
|
BALANCE SHEET ANALYSIS: % on the total
assets |
|
|
|
|
ASSETS |
|
|
|
|
A) NON CURRENT ASSETS |
9,93 |
18,55 |
-8,63 |
|
A) CURRENT ASSETS |
90,07 |
81,45 |
8,63 |
|
LIABILITIES |
|
|
|
|
A) NET WORTH |
34,57 |
39,69 |
-5,12 |
|
B) NON CURRENT LIABILITIES |
3,20 |
6,51 |
-3,31 |
|
C) CURRENT LIABILITIES |
62,23 |
53,80 |
8,43 |
|
|
|
|
|
|
|
COMPANY (2009) |
SECTOR |
DIFFERENCE |
|
PROFIT AND LOSS ACCOUNT ANALYSIS: % on the total
operating income |
|
|
|
|
SALES |
99,42 |
98,89 |
0,53 |
|
GROSS MARGIN |
28,85 |
29,02 |
-0,16 |
|
EBITDA |
5,22 |
8,73 |
-3,51 |
|
EBIT |
3,19 |
7,00 |
-3,81 |
|
NET RESULT |
1,59 |
4,69 |
-3,10 |
Sector Composition
Compared sector (NACE 2009): 4669
Number of companies: 370
Size (Sales Figure): 7,000,000.00 - 40,000,000.00 Euros
OTHER DATA FROM THE ANNUAL FINANCIAL REPORT
Results Distribution
Source: annual financial report 2009
Figures given in €
|
DISTRIBUTION BASE |
APPLICATION A |
||
|
Profit and Loss Account Balance |
163.708,52 |
Legal Reserve |
0,00 |
|
Carry over |
0,00 |
Goodwill reserve |
0,00 |
|
Voluntary reserves |
0,00 |
Special reserves |
0,00 |
|
Other reserves disposable at will |
0,00 |
Voluntary reserves |
163.708,52 |
|
Total of Amounts to be distributed |
163.708,52 |
Dividends |
0,00 |
|
|
|
Carry over and others |
0,00 |
|
|
|
Compensation of previous exercises losses |
0,00 |
|
|
|
Application total |
163.708,52 |
Auditing
Source: filing of annual financial statement 2009
Auditors’ opinion: FAVOURABLE
Auditor: BDO AUDITORES SL
Auditing fees: 8.550,00 €
Facts subsequent
to the closing
Source: Annual financial report 2009
Posterior to the closure there were no relevant facts that require the
inclusion in the annual accounts.
company ADDRESSES
Current Legal Seat Address:
PARTIDA LLIGALLO LA LLOMA, S/N
43560 LA SENIA TARRAGONA
Previous Seat Address:
CALLE MAESTRAT 18
43560 LA
SENIA TARRAGONA
Characteristics of
the current address
Type of establishment: store
Local Situation: secondary
|
STREET |
POSTAL CODE |
TOWN |
PROVINCE |
|
APARTADO DE CORREOS 146 |
43560 |
LA SENIA |
Tarragona |
|
CARRETERA SANTA BARBARA |
43560 |
LA SENIA |
Tarragona |
There are 2 branches registered .
CORPORATE STRUCTURE
ADMINISTRATIVE LINKS
|
|
|
|
|
|
Distribution of the administration board |
|
|
Governing body : 2 members (latest change:
05/03/1998) Auditor : 1 (latest change: 05/12/2008) Operative Board Members : 4 (latest change: 21/06/2011) |
|
|

Main Board
members, Directors and Auditor ![]()
Governing body
|
POSITION |
NAME AND SURNAME |
DATE APPOINTMENT |
|
ADMINISTRATOR |
VINALS ALLEPUZ, MANUEL |
05/03/1998 |
|
ADMINISTRATOR |
VINALS ALLEPUZ, NICOLAS RICARDO |
05/03/1998 |
|
|
|
|
Auditor
|
POSITION |
NAME AND SURNAME |
DATE APPOINTMENT |
|
AUDITOR |
BDO AUDIBERIA AUDITORES SL |
05/12/2008 |
There are 3 board members, directors and auditors registered .
|
POSITION |
NAME AND SURNAME |
|
General Manager |
VINALS ALLEPUZ, MANUEL |
|
Financial Manager |
VINALS ALLEPUZ, MANUEL |
|
Purchases Director |
IRANZO FIBLA, JORDI |
|
Imports Director |
IRANZO FIBLA, JORDI |
FINANCIAL LINKS
|
|
BUSINESS NAME |
CIF / COUNTRY |
% |
SOURCE |
DATE REP. |
|
|
VINALS ALLEPUZ NICOLAS |
|
50,00 |
OWN SOURCES |
27/06/2011 |
|
|
VINALS ALLEPUZ MANUEL |
|
50,00 |
OWN SOURCES |
27/06/2011 |
There are 2 direct financial links through shareholders
registered .
|
|
BUSINESS NAME |
CIF / COUNTRY |
% |
SOURCE |
DATE REP. |
|
|
PROMOCIONS SORT DEL PI SL |
B43439249 |
31,25 |
TRADE REG. |
31/12/1998 |
POTENTIAL LINKS
Search for Link by
Administrator ![]()
Search Criterion: ”NICOLAS RICARDO VINALS ALLEPUZ”
|
COMPANY |
POSITION |
PROVINCE |
|
ABC ENCIKLOPEDIOJ SL |
Presidente |
TARRAGONA |
In case you need more information you can request:Board Members
Monitoring
Search Criterion: ”CONTROL DE EMBALATGES SL”
URL: www.controlpack.com
Controlpack - La web del embalaje Embalajes respetuosos con el medio
ambiente · Distribuidor Robopac · Certificación ISO · Catalogos · Film
CORELESS, I+D. Renting. Nuestras promociones ...
BUSINESS INFORMATION
Incorporation date: 05/01/1993
Establishment date: 01/03/1986
Founder’s Name: VINYALS MANEL
Activity: Wholesale of other products
NACE 2009 CODE: 4669
NACE 2009 Activity: Wholesale of other machinery and equipment
Business: FABRICACION Y COMERCIALIZACION DE TODO TIPO DE
EMBALAJES
(MANUFACTURING AND TRADING OF ALL KINDS OF PACKAGING).
Activity description: Venta de maquinaria y material de embajale.
(Sale
of machinery
and equipment embajale)
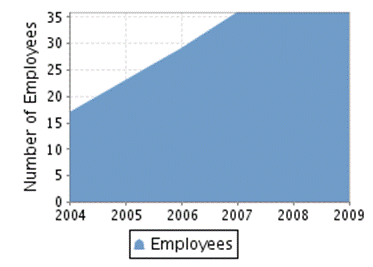
Latest employees figure: 40 (2011)
% of fixed employees: 83,33%
% of temporary employees: 16,67%
Employees
evolution
|
|
|
|
SALES
Exports to: UE Y RESTO DEL MUNDO
SUPPLIERS
|
BUSINESS NAME |
INTERNATIONAL |
|
ROBOCAP |
YES |
|
REPRESENTACIONS
I SERVEIS INTEGRALS S.L. |
NO |
|
PROMOCIONS SORT
DEL PI S.L. |
NO |
There are 3 Suppliers .
CLIENTS
|
BUSINESS NAME |
INTERNATIONAL |
|
MAQUINARIA JAVIER
VAZQUEZ |
NO |
There are 1 Clients .
•
El 8.27% de su cifra de negocio corresponde a la
venta de maquinaria.
•
El 91.73% de su cifra de negocio corresponde a la
venta de embalaje.
|
ENTITY |
BRANCH |
ADDRESS |
TOWN OR CITY |
PROVINCE |
|
CAJA DE AHORROS Y PENSIONES DE BARCELONA |
0175 |
C. TARRAGONA, 1 |
SENIA (LA) |
Tarragona |
|
BANCO DE SABADELL, S.A. |
0408 |
PS CLOTADA 000038 |
SENIA (LA) |
Tarragona |
|
BANCO SANTANDER, S.A. |
|
|
SENIA (LA) |
|
|
CAIXA D’ESTALVIS DE CATALUNYA,TARRAGONA I MANRESA |
|
|
SENIA (LA) |
|
There are 4 bank entities registered .
Discount facilities: 1
Credit policy: 1
Mortgage loan: 0
Loans with no real security: 0
|
|
|
|
Debt type: Discount
facilities |
Granted limit:309.000,00 € Used limit:170.559,25 € Available limit:138.440,75
€ Source: Filed
Accounts (2009) |
|
|
|
|
Debt type: Credit policy |
Granted limit:1.749.499,84 € Used limit:1.342.379,38
€ Available limit:407.120,46
€ Source: Filed
Accounts (2009) |
|
|
|
There are 2 bank operations registered .
LEGAL
STRUCTURE
Constitution Data
Register Date: 05/01/1993
Register town: Tarragona
Announcement number: 87481
Social Capital: 24.040,48 €
Legal form: Limited Liability Company
Social Capital: 84.141,69 €
Obligation to fill in Financial Statements: YES
Chamber census: YES (2009)
B.O.R.M.E.
(OFFICIAL COMPANIES
REGISTRY GAZETTE) ![]()
· Acts on activity: 0
· Acts on administrators: 5 (Last: 05/12/2008, first: 09/03/1993)
· Acts on capital: 1 (Last: 09/03/2000)
· Acts on creation: 1 (Last: 09/03/1993)
· Acts on filed accounts: 17 (Last: 16/09/2010, first: 06/09/1994)
· Acts on identification: 0
· Acts on Information: 1 (Last: 05/03/1998)
Latest acts in
B.O.R.M.E.
Other acts
|
ACT |
DATE |
NOTICE NUM. |
TRADE REGISTER |
|
Appointments |
05/12/2008 |
561833 |
Tarragona |
|
Appointments |
05/12/2008 |
561832 |
Tarragona |
|
Capital enlargement |
09/03/2000 |
95216 |
Tarragona |
|
Appointments |
05/03/1998 |
84863 |
Tarragona |
|
Resignations |
05/03/1998 |
84863 |
Tarragona |
|
Law 2/95 Adjustment |
05/03/1998 |
84863 |
Tarragona |
|
Appointments |
09/03/1993 |
87481 |
Tarragona |
|
Constitution |
09/03/1993 |
87481 |
Tarragona |
Latest filed accounts
|
ACT |
DATE |
NOTICE NUM. |
TRADE REGISTER |
|
Annual Filed Accounts (2009) |
16/09/2010 |
570634 |
Tarragona |
|
Annual Filed Accounts (2008) |
05/11/2009 |
810940 |
Tarragona |
|
Annual Filed Accounts (2006) |
15/12/2008 |
1215258 |
Tarragona |
There are 25 acts registered .
PRESS ARTICLES
Press summary by
type of information (last five years) ![]()
Legal notices: 0
Structural Data: 0
Informative data: 1 (Last: 27/02/2011)
Financial Information: 0
Negative information: 0
Business lines: 0
Historical press releases: 0
Latest press
article published ![]()
27/02/2011 DIARI DE
TARRAGONA (Page 6) GENERAL INFORMATION
CONTROLPACK fue fundada el 01/03/86 por Manel Vinyals. La empresa se ha
convertido en una especie de consultoría que asesora a los clientes sobre los
sistemas y formatos para embalar y transportar productos.
La sociedad cuenta con centros logísticos en Zaragoza, Guipúzcoa y
Madrid, además de la sede de La Senia. En total, emplea a 40 personas.
CONTROLPACK cerró 2010 con una facturación de 13,5 millones de euros, un
32% más que el año anterior, cuando la cifra ascendió a 10,23 millones. Para el
presente año prevé alcanzar 15 millones.
La sociedad ha presentado dos nuevos productos: la envolvedora Macroplat
y la embolsadora Smart.
La firma tiene previsto invertir 380.000 euros en 2011.
There are 1 press articles registered for this company .
FINANCIAL INFORMATION
The information on the last account contained in this report is
extracted from the Mercantile Register file of the legal address of the Company
and dated 22/10/2010.
SITUATION
BALANCE-SHEET
Assets
Figures given in €
|
|
31/12/2009 (12) |
% ASSETS |
31/12/2008 (12) |
% ASSETS |
|
A) NON CURRENT ASSETS |
573.736,32 |
9,93 |
539.954,67 |
10,63 |
|
I. Intangible assets |
5.476,36 |
0,09 |
2.176,91 |
0,04 |
|
5. Software |
5.476,36 |
0,09 |
2.176,91 |
0,04 |
|
II. Tangible fixed assets |
556.004,04 |
9,62 |
525.521,84 |
10,35 |
|
1. Property, plant and equipment |
22.712,23 |
0,39 |
23.383,95 |
0,46 |
|
2. Technical fittings and other tangible assets |
533.291,81 |
9,23 |
502.137,89 |
9,89 |
|
III. Real-estate investments |
|
|
|
|
|
IV. Long term investments in associated and affiliated companies |
|
|
|
|
|
V. Long Term Financial Investments |
12.255,92 |
0,21 |
12.255,92 |
0,24 |
|
1. Net worth instruments |
5.765,00 |
0,10 |
5.765,00 |
0,11 |
|
5. Other financial assets |
6.490,92 |
0,11 |
6.490,92 |
0,13 |
|
VI. Assets by deferred taxes |
|
|
|
|
|
VII. Non current commercial debts |
|
|
|
|
|
B) CURRENT ASSETS |
5.206.822,24 |
90,07 |
4.537.835,82 |
89,37 |
|
I. Non-current assets maintained for sale |
|
|
|
|
|
II. Stocks |
2.073.906,56 |
35,88 |
1.589.199,70 |
31,30 |
|
1. Goods available for sale |
2.068.266,56 |
35,78 |
1.589.199,70 |
31,30 |
|
6. Pre-payments to suppliers |
5.640,00 |
0,10 |
|
|
|
III. Trade Debtors and other receivable accounts |
3.127.352,18 |
54,10 |
2.914.886,19 |
57,40 |
|
1. Clients |
3.127.352,18 |
54,10 |
2.914.886,19 |
57,40 |
|
b) Clients for sales and short term services
rendering |
3.127.352,18 |
54,10 |
2.914.886,19 |
57,40 |
|
IV. Short term investments in associated and affiliated companies |
|
|
|
|
|
V. Short term financial investments |
|
|
|
|
|
VI. Short term periodifications |
|
|
|
|
|
VII. Cash and equivalents |
5.563,50 |
0,10 |
33.749,93 |
0,66 |
|
1. Treasury |
5.563,50 |
0,10 |
33.749,93 |
0,66 |
|
TOTAL ASSETS (A + B) |
5.780.558,56 |
100,00 |
5.077.790,49 |
100,00 |
Net Worth and
Liabilities
Figures given in €
|
|
31/12/2009 (12) |
% ASSETS |
31/12/2008 (12) |
% ASSETS |
|
A) NET WORTH |
1.998.465,75 |
34,57 |
1.837.757,23 |
36,19 |
|
A-1) Equity |
1.998.465,75 |
34,57 |
1.837.757,23 |
36,19 |
|
I. Capital |
84.141,69 |
1,46 |
84.141,69 |
1,66 |
|
1. Authorized capital |
84.141,69 |
1,46 |
84.141,69 |
1,66 |
|
II. Issue premium |
|
|
|
|
|
III. Reserves |
1.750.615,54 |
30,28 |
1.622.299,36 |
31,95 |
|
1. Legal and statutory |
16.828,34 |
0,29 |
16.828,34 |
0,33 |
|
2. Other funds |
1.733.787,20 |
29,99 |
1.605.471,02 |
31,62 |
|
IV. (Net worth own shares and participations) |
|
|
|
|
|
V. Results from previous years |
|
|
|
|
|
VI. Other loans from partners |
|
|
|
|
|
VII. Exercise Result |
163.708,52 |
2,83 |
131.316,18 |
2,59 |
|
VIII. (Interim dividend) |
|
|
|
|
|
IX. Other net worth instruments |
|
|
|
|
|
A-2) Value changes adjustments |
|
|
|
|
|
I. Financial assets available for sale |
|
|
|
|
|
II. Coverage operations |
|
|
|
|
|
III. Non-current assets and related liabilities, maintained for sale |
|
|
|
|
|
IV. Conversion differences |
|
|
|
|
|
V. Other |
|
|
|
|
|
A-3) Received legacies, grants and subventions |
|
|
|
|
|
B) NON CURRENT LIABILITIES |
185.000,54 |
3,20 |
191.297,20 |
3,77 |
|
I. Long term provisions |
|
|
|
|
|
II. Long term debts |
177.338,80 |
3,07 |
182.872,56 |
3,60 |
|
2. Debts with bank entities |
170.557,93 |
2,95 |
171.512,48 |
3,38 |
|
3. Financial leasing creditors |
6.780,87 |
0,12 |
11.360,08 |
0,22 |
|
III. Long term debts with associated and affiliated companies |
|
|
|
|
|
IV. Liabilities by deferred taxes |
7.661,74 |
0,13 |
8.424,64 |
0,17 |
|
V. Long term periodifications |
|
|
|
|
|
VI. Non current trade creditors |
|
|
|
|
|
VII. Long term debts with special characteristics |
|
|
|
|
|
C) CURRENT LIABILITIES |
3.597.092,27 |
62,23 |
3.048.736,06 |
60,04 |
|
I. Liabilities related with non-current assets maintained for sale |
|
|
|
|
|
II. Short term provisions |
|
|
|
|
|
III. Short term debts |
1.620.001,68 |
28,03 |
1.270.506,85 |
25,02 |
|
2. Debts with bank entities |
1.614.368,17 |
27,93 |
1.261.995,81 |
24,85 |
|
3. Financial leasing creditors |
5.633,51 |
0,10 |
8.511,04 |
0,17 |
|
IV. Short term debts with associated and affiliated companies |
|
|
|
|
|
V. Trade creditors and other payable accounts |
1.977.090,59 |
34,20 |
1.778.229,21 |
35,02 |
|
1. Suppliers |
1.442.365,12 |
24,95 |
1.358.370,88 |
26,75 |
|
b) Short term suppliers |
1.442.365,12 |
24,95 |
1.358.370,88 |
26,75 |
|
2. Suppliers group and associated companies |
121.701,33 |
2,11 |
122.662,17 |
2,42 |
|
3. Different creditors |
277.705,39 |
4,80 |
195.403,55 |
3,85 |
|
4. Staff (pending remunerations) |
1.452,76 |
0,03 |
478,48 |
0,01 |
|
5. Liabilities by current taxes |
34.279,97 |
0,59 |
5.469,25 |
0,11 |
|
6. Other debts with Public Administrations |
64.759,22 |
1,12 |
68.319,48 |
1,35 |
|
7. Clients pre-payments |
34.826,80 |
0,60 |
27.525,40 |
0,54 |
|
VI. Short term periodifications |
|
|
|
|
|
VII. Short term debts with special characteristics |
|
|
|
|
|
TOTAL NET WORTH AND LIABILITIES (A + B + C) |
5.780.558,56 |
100,00 |
5.077.790,49 |
100,00 |
PROFIT AND LOSS
ACCOUNT
Figures given in €
|
|
31/12/2009 (12) |
%OPERATING INCOME |
31/12/2008 (12) |
%OPERATING INCOME |
|
A) CONTINUED OPERATIONS |
|
|
|
|
|
1. Net Turnover |
10.235.029,38 |
99,42 |
11.658.186,65 |
100,00 |
|
A) Sales |
10.224.485,55 |
99,31 |
11.640.522,39 |
99,85 |
|
b) Services provided |
10.543,83 |
0,10 |
17.664,26 |
0,15 |
|
2. Variation in stocks of finished goods and work in progress |
|
|
|
|
|
3. Works for its own assets |
43.116,18 |
0,42 |
|
|
|
4. Supplies |
-7.324.570,12 |
-71,15 |
-8.632.158,61 |
-74,04 |
|
a) Material consumed |
-6.672.713,97 |
-64,81 |
-4.574,55 |
-0,04 |
|
b) Raw materials consumed |
-633.903,30 |
-6,16 |
-8.596.099,50 |
-73,73 |
|
d) Deterioration on merchandises, raw materials and other supplies |
-17.952,85 |
-0,17 |
-31.484,56 |
-0,27 |
|
5. Other operating income |
17.028,80 |
0,17 |
|
|
|
a) Other incomes |
17.028,80 |
0,17 |
|
|
|
6. Labour cost |
-969.442,18 |
-9,42 |
-992.069,08 |
-8,51 |
|
a) Wages and similar expenses |
-770.602,00 |
-7,49 |
-790.610,45 |
-6,78 |
|
b) Social costs |
-198.840,18 |
-1,93 |
-201.458,63 |
-1,73 |
|
7. Other operating costs |
-1.552.651,53 |
-15,08 |
-1.597.978,29 |
-13,71 |
|
a) External services |
-1.478.441,30 |
-14,36 |
-1.485.058,62 |
-12,74 |
|
b) Taxes |
-3.298,78 |
-0,03 |
-6.156,23 |
-0,05 |
|
c) Losses, deterioration and variation on business operations
provisions |
-70.911,45 |
-0,69 |
-106.763,44 |
-0,92 |
|
8. Amortization of fixed assets |
-119.746,99 |
-1,16 |
-140.759,17 |
-1,21 |
|
9. Allocation of subventions on non financial investments and other |
|
|
|
|
|
10. Provisions excess |
|
|
|
|
|
11. Deterioration and result for fixed assets disposal |
|
|
-1.378,00 |
-0,01 |
|
b) Results for disposals and others |
|
|
-1.378,00 |
-0,01 |
|
12. Negative difference of business combinations |
|
|
|
|
|
13. Other results |
|
|
|
|
|
A.1) OPERATING RESULT (1 + 2 + 3 + 4 + 5 + 6 + 7 + 8 + 9 + 10 + 11 +
12 + 13) |
328.763,54 |
3,19 |
293.843,50 |
2,52 |
|
14. Financial income |
33,61 |
0,00 |
729,75 |
0,01 |
|
b) From negotiable values and other financial instruments |
33,61 |
0,00 |
729,75 |
0,01 |
|
b 2) From third parties |
33,61 |
0,00 |
729,75 |
0,01 |
|
15. Financial expenses |
-92.190,33 |
-0,90 |
-108.045,35 |
-0,93 |
|
b) For debts with third parties |
-92.190,33 |
-0,90 |
-108.045,35 |
-0,93 |
|
16. Reasonable value variation on financial instruments |
|
|
|
|
|
17. Exchange differences |
-3.410,43 |
-0,03 |
-61,71 |
0,00 |
|
18. Deterioration and result for disposal of financial instruments |
|
|
|
|
|
19. Other financial income and expenses |
|
|
|
|
|
A.2) FINANCIAL RESULT (14 + 15 + 16 + 17 + 18 + 19) |
-95.567,15 |
-0,93 |
-107.377,31 |
-0,92 |
|
A.3) RESULT BEFORE TAXES (A.1 + A.2) |
233.196,39 |
2,27 |
186.466,19 |
1,60 |
|
20. Taxes on profits |
-69.487,87 |
-0,67 |
-55.150,01 |
-0,47 |
|
A.4) EXERCISE RESULT COMING FROM CONTINUED OPERATIONS (A.3 + 20) |
163.708,52 |
1,59 |
131.316,18 |
1,13 |
|
B) DISCONTINUED OPERATIONS |
|
|
|
|
|
21. Net of taxes exercise result coming from discontinued operations |
|
|
|
|
|
A.5) EXERCISE RESULT (A.4 + 21) |
163.708,52 |
1,59 |
131.316,18 |
1,13 |
NET WORTH CHANGES STATUS
Status of recognized income and expenses
Figures given in €
|
NET WORTH CHANGES (1/2) |
31/12/2009 (12) |
31/12/2008 (12) |
|
A) PROFIT AND LOSS ACCOUNT RESULT |
163.708,52 |
131.316,18 |
|
INCOME AND EXPENSES ALLOCATED DIRECTLY TO NET WORTH |
|
|
|
I. For valuation of financial instruments |
|
|
|
II. Cash flow coverage |
|
|
|
III. Received legacies, grants and subventions |
|
|
|
IV. For actuarial profits and losses and other adjustments |
|
|
|
V. Non-current assets and related liabilities, maintained for sale |
|
|
|
VI. Conversion differences |
|
|
|
VII. Tax effect |
|
|
|
B) TOTAL INCOME AND EXPENSES ALLOCATED DIRECTLY TO NET WORTH (I + II +
III + IV +V+VI+VII) |
|
|
|
PROFIT AND LOSS ACCOUNT TRANSFERS |
|
|
|
VIII. For valuation of financial instruments |
|
|
|
IX. Cash flow coverage |
|
|
|
X. Received legacies, grants and subventions |
|
|
|
XI. Non-current assets and related liabilities, maintained for sale |
|
|
|
XII. Conversion differences |
|
|
|
XIII. Tax effect |
|
|
|
C) TOTAL TRANSFERS TO THE PROFIT AND LOSS ACCOUNT (VIII + IX + X + XI+
XII+ XIII) |
|
|
|
TOTAL INCOME AND EXPENSES RECOGNIZED (A + B + C) |
163.708,52 |
131.316,18 |
Total net worth
changes status
Figures given in €
|
NET WORTH CHANGES ( 2 /2) |
AUTHORIZED CAPITAL |
RESERVES |
EXERCISE RESULT |
TOTAL |
|
FINAL ACCOUNT BALANCE OF EXERCISE (2007) |
84.141,69 |
1.337.661,31 |
287.638,05 |
1.709.441,05 |
|
I. Adjustments by change of criteria in the exercise (2007) |
|
|
|
|
|
II. Adjustments by errors in the exercise (2007) |
|
|
|
|
|
ADJUSTED ACCOUNT BALANCE, BEGINNING OF EXERCISE (2008) |
84.141,69 |
1.337.661,31 |
287.638,05 |
1.709.441,05 |
|
I. Total recognized income and expenses |
|
|
131.316,18 |
131.316,18 |
|
II. Operations with partners or owners |
|
-3.000,00 |
|
-3.000,00 |
|
4. (-) Dividends distribution |
|
-3.000,00 |
|
-3.000,00 |
|
III. Other net worth variations |
|
287.638,05 |
-287.638,05 |
|
|
FINAL ACCOUNT BALANCE OF EXERCISE (2008) |
84.141,69 |
1.622.299,36 |
131.316,18 |
1.837.757,23 |
|
I. Adjustments by change of criteria in the exercise (2008) |
|
|
|
|
|
II. Adjustments by errors in the exercise (2008) |
|
|
|
|
|
ADJUSTED ACCOUNT BALANCE, BEGINNING OF EXERCISE (2009) |
84.141,69 |
1.622.299,36 |
131.316,18 |
1.837.757,23 |
|
I. Total recognized income and expenses |
|
|
163.708,52 |
163.708,52 |
|
II. Operations with partners or owners |
|
-3.000,00 |
|
-3.000,00 |
|
4. (-) Dividends distribution |
|
-3.000,00 |
|
-3.000,00 |
|
III. Other net worth variations |
|
131.316,18 |
-131.316,18 |
|
|
FINAL ACCOUNT BALANCE OF EXERCISE (2009) |
84.141,69 |
1.750.615,54 |
163.708,52 |
1.998.465,75 |
CASH FLOW STATUS
Figures given in €
|
|
31/12/2009 (12) |
31/12/2008 (12) |
|
A) CASH FLOW COMING FROM OPERATING ACTIVITIES |
|
|
|
1. exercise result before taxes |
233.196,39 |
186.466,19 |
|
2. Results adjustments |
168.018,88 |
280.937,33 |
|
a) Amortization of fixed assets (+) |
119.746,99 |
140.759,17 |
|
c) Change of Provisions (+/-) |
8.242,68 |
31.484,56 |
|
e) Results for decline and disposal of fixed assets (+/-) |
|
1.378,00 |
|
g) Financial income (-) |
-33,61 |
-729,75 |
|
f) Financial expenses (+) |
92.190,33 |
108.045,35 |
|
k) Other income and expenses (-/+) |
-52.127,51 |
|
|
3. Changes in current capital |
-571.335,67 |
309.946,83 |
|
a) Stocks (+/-) |
-502.659,71 |
80.316,98 |
|
b) Debtors and other receivable accounts (+/-) |
-202.755,82 |
494.212,99 |
|
d) Creditors and other payable accounts (+/-) |
134.079,86 |
-264.583,14 |
|
4. Other cash flow coming from operating activities |
-97.625,97 |
-168.997,31 |
|
a) Interests payments (-) |
-92.190,33 |
-108.045,35 |
|
c) Interests collections (+) |
33,61 |
729,75 |
|
d) Collections (payments) for profit tax (+/-) |
-5.469,25 |
-61.681,71 |
|
5. Cash flow coming from operating activities (1 + 2 + 3 + 4) |
-267.746,37 |
608.353,04 |
|
B) CASH FLOW COMING FROM INVESTING ACTIVITIES |
|
|
|
6. Investment payments (-) |
-101.401,13 |
-210.484,27 |
|
b) Intangible assets |
|
-16.107,22 |
|
c) Tangible assets |
-101.401,13 |
-194.377,05 |
|
7. Disinvestment collections (+) |
|
1.200,00 |
|
c) Tangible assets |
|
1.200,00 |
|
8. Cash Flow in investment activities (6 + 7) |
-101.401,13 |
-209.284,27 |
|
C) CASH FLOW COMING FROM FINANCING ACTIVITIES |
|
|
|
9. Net worth instruments collections and payments |
|
|
|
10. Financial liabilities instruments collections and payments |
343.961,07 |
-374.133,39 |
|
a) Issue |
469.096,59 |
219.985,38 |
|
2. Debts with bank entities (+) |
469.096,59 |
219.985,38 |
|
b) Return and amortization of |
-125.135,52 |
-594.118,77 |
|
2. Debts with bank entities (-) |
-125.135,52 |
-594.118,77 |
|
11. Payments for dividends and remunerations of other net worth
instruments |
-3.000,00 |
-3.000,00 |
|
a) Dividends (-) |
-3.000,00 |
-3.000,00 |
|
12. Cash Flow in financing activities (9 + 10 + 11) |
340.961,07 |
-377.133,39 |
|
D) Exchange rate variations effect |
|
|
|
E) NET CASH OR EQUIVALENTS INCREASE / REDUCTION (5 + 8 + 12 + D) |
-28.186,43 |
21.935,38 |
|
Cash or equivalents at the beginning of the exercise |
33.749,93 |
11.814,55 |
|
Cash or equivalents at the end of the exercise |
5.563,50 |
33.749,93 |
RATIOS
|
|
31/12/2009 (12) |
CHANGE % |
31/12/2008 (12) |
|
BALANCE RATIOS |
|||
|
Working Capital (€) |
1.609.729,97 |
8,10 |
1.489.099,76 |
|
Working capital ratio |
0,28 |
-3,45 |
0,29 |
|
Soundness Ratio |
3,48 |
2,35 |
3,40 |
|
Average Collection Period (days) |
110 |
22,40 |
90 |
|
Average Payment Period (days) |
80 |
28,16 |
63 |
|
LIQUIDITY RATIOS |
|||
|
Current Ratio (%) |
144,75 |
-2,75 |
148,84 |
|
Quick Ratio (%) |
0,16 |
-85,59 |
1,11 |
|
DEBT RATIOS |
|||
|
Borrowing percentage (%) |
31,09 |
8,63 |
28,62 |
|
External Financing Average Cost |
0,05 |
-28,57 |
0,07 |
|
Debt Service Coverage |
-6,71 |
-380,75 |
2,39 |
|
Interest Coverage |
3,57 |
31,25 |
2,72 |
|
GENERAL AND ACTIVITIES RATIOS |
|||
|
Auto financing generated by sales (%) |
-2,62 |
-150,19 |
5,22 |
|
Auto financing generated by Assets (%) |
-4,63 |
-138,65 |
11,98 |
|
Breakdown Point |
1,03 |
0,00 |
1,03 |
|
Average Sales Volume per Employee |
284.306,37 |
-12,21 |
323.838,52 |
|
Average Cost per Employee |
26.928,95 |
-2,28 |
27.557,47 |
|
Assets Turnover |
1,77 |
-23,04 |
2,30 |
|
Inventory Turnover (days) |
102 |
53,80 |
66 |
|
RESULTS RATIOS |
|||
|
Return on Assets (ROA) (%) |
5,69 |
-1,73 |
5,79 |
|
Operating Profitability (%) |
7,76 |
-9,03 |
8,53 |
|
Return on Equity (ROE) (%) |
11,67 |
14,98 |
10,15 |
SECTORIAL ANALYSIS
Balance Sheet and Financial Balance
Figures expressed in %
|
|
COMPANY (2009) |
SECTOR |
DIFFERENCE |
|
BALANCE SHEET ANALYSIS: % on the total
assets |
|
|
|
|
ASSETS |
|||
|
A) NON CURRENT ASSETS |
9,93 |
18,55 |
-8,63 |
|
A) CURRENT ASSETS |
90,07 |
81,45 |
8,63 |
|
LIABILITIES |
|||
|
A) NET WORTH |
34,57 |
39,69 |
-5,12 |
|
B) NON CURRENT LIABILITIES |
3,20 |
6,51 |
-3,31 |
|
C) CURRENT LIABILITIES |
62,23 |
53,80 |
8,43 |
|
|
|
|
|
Analytical Account
of Results
Figures given in %
|
|
COMPANY (2009) |
SECTOR |
DIFFERENCE |
|
Net Turnover |
99,42 |
98,89 |
0,53 |
|
Other operating income |
0,58 |
1,11 |
-0,53 |
|
OPERATING INCOME |
100,00 |
100,00 |
0,00 |
|
Supplies |
-71,15 |
-71,26 |
0,11 |
|
Variation in stocks of finished goods and work in progress |
|
0,28 |
|
|
GROSS MARGIN |
28,85 |
29,02 |
-0,16 |
|
Other operating costs |
-15,08 |
-9,36 |
-5,72 |
|
Labour cost |
-9,42 |
-11,56 |
2,14 |
|
GROSS OPERATING RESULT |
4,36 |
8,09 |
-3,73 |
|
Amortization of fixed assets |
-1,16 |
-1,32 |
0,16 |
|
Deterioration and result for fixed assets disposal |
|
0,24 |
|
|
NET OPERATING RESULT |
3,19 |
7,00 |
-3,81 |
|
Financial result |
-0,93 |
-0,37 |
-0,56 |
|
RESULT BEFORE TAX |
2,27 |
6,64 |
-4,37 |
|
Taxes on profits |
-0,67 |
-1,94 |
1,28 |
|
RESULT COMING FROM CONTINUED OPERATIONS |
1,59 |
|
|
|
NET RESULT |
1,59 |
4,69 |
-3,10 |
Main Ratios
|
|
COMPANY (2009) |
PTILE25 |
PTILE50 |
PTILE75 |
|
BALANCE RATIOS |
|
|
|
|
|
Working Capital (€) |
1.609.729,97 |
834.305,04 |
1.928.238,50 |
4.003.711,57 |
|
Working capital ratio |
0,28 |
0,13 |
0,26 |
0,43 |
|
Soundness Ratio |
3,48 |
1,33 |
2,62 |
7,51 |
|
Average Collection Period (days) |
110 |
103 |
126 |
147 |
|
Average Payment Period (days) |
80 |
32 |
71 |
105 |
|
LIQUIDITY RATIOS |
|
|
|
|
|
Current Ratio (%) |
144,75 |
1,19 |
1,47 |
2,02 |
|
Quick Ratio (%) |
0,16 |
0,03 |
0,10 |
0,29 |
|
DEBT RATIOS |
|
|
|
|
|
Borrowing percentage (%) |
31,09 |
5,42 |
21,26 |
42,64 |
|
External Financing Average Cost |
0,05 |
0,03 |
0,05 |
0,08 |
|
Debt Service Coverage |
-6,71 |
0,41 |
2,62 |
7,53 |
|
Interest Coverage |
3,57 |
2,51 |
6,00 |
24,66 |
|
GENERAL AND ACTIVITIES RATIOS |
|
|
|
|
|
Auto financing generated by sales (%) |
-2,62 |
2,80 |
4,67 |
7,98 |
|
Auto financing generated by Assets (%) |
-4,63 |
3,96 |
7,53 |
11,78 |
|
Breakdown Point |
1,03 |
1,03 |
1,06 |
1,10 |
|
Average Sales Volume per Employee |
284.306,37 |
270.153,06 |
362.779,82 |
506.748,80 |
|
Average Cost per Employee |
26.928,95 |
31.994,31 |
38.726,80 |
49.279,99 |
|
Assets Turnover |
1,77 |
1,17 |
1,51 |
1,85 |
|
Inventory Turnover (days) |
102 |
40 |
67 |
102 |
|
RESULTS RATIOS |
|
|
|
|
|
Return on Assets (ROA) (%) |
5,69 |
4,44 |
8,47 |
14,14 |
|
Operating Profitability (%) |
7,76 |
6,62 |
11,16 |
16,72 |
|
Return on Equity (ROE) (%) |
11,67 |
13,22 |
23,25 |
35,29 |
ADDITIONAL INFORMATION
Consulted Sources
Central Trade Register
Tax Administration / VIES Consultation
Tax Administration / Consultation by NIF
INTERNET
Telephone directory: PÁGINAS AMARILLAS
Titular
FOREIGN EXCHANGE RATES
|
Currency |
Unit
|
Indian Rupees |
|
US Dollar |
1 |
Rs.44.94 |
|
UK Pound |
1 |
Rs.71.89 |
|
Euro |
1 |
Rs.64.09 |
RATING EXPLANATIONS
|
RATING |
STATUS |
PROPOSED CREDIT LINE |
|
|
>86 |
Aaa |
Possesses an extremely sound financial base with the strongest
capability for timely payment of interest and principal sums |
Unlimited |
|
71-85 |
Aa |
Possesses adequate working capital. No caution needed for credit transaction.
It has above average (strong) capability for payment of interest and
principal sums |
Large |
|
56-70 |
A |
Financial & operational base are regarded healthy. General unfavourable
factors will not cause fatal effect. Satisfactory capability for payment of
interest and principal sums |
Fairly Large |
|
41-55 |
Ba |
Overall operation is considered normal. Capable to meet normal
commitments. |
Satisfactory |
|
26-40 |
B |
Capability to overcome financial difficulties seems comparatively
below average. |
Small |
|
11-25 |
Ca |
Adverse factors are apparent. Repayment of interest and principal sums
in default or expected to be in default upon maturity |
Limited with full
security |
|
<10 |
C |
Absolute credit risk exists. Caution needed to be exercised |
Credit not
recommended |
|
---- |
NB |
New Business |
---- |
This score serves as a reference to assess SC’s credit risk and
to set the amount of credit to be extended. It is calculated from a composite
of weighted scores obtained from each of the major sections of this report. The
assessed factors and their relative weights (as indicated through %) are as
follows:
Financial
condition (40%) Ownership
background (20%) Payment
record (10%)
Credit history
(10%) Market trend
(10%) Operational
size (10%)
This report is issued at your request without any
risk and responsibility on the part of MIRA INFORM PRIVATE LIMITED (MIPL) or
its officials.