![]()
MIRA INFORM REPORT
|
Report Date : |
30.06.2011 |
IDENTIFICATION DETAILS
|
Name : |
G
STEEL PUBLIC COMPANY
LIMITED |
|
|
|
|
Formerly Known As : |
SIAM STRIP
MILL PUBLIC COMPANY
LIMITED |
|
|
|
|
Registered Office : |
18th Floor, Paso Tower, 88 Silom Road, Suriyawongse, Bangrak, Bangkok 10500 |
|
|
|
|
Country : |
Thailand |
|
|
|
|
Financials (as on) : |
31.12.2010 |
|
|
|
|
Date of Incorporation : |
31.10.1995 |
|
|
|
|
Com. Reg. No.: |
0107538000746 |
|
|
|
|
Legal Form : |
Public Limited Company |
|
|
|
|
Line of Business : |
Manufacturer, distributor and exporter of hot-rolled steel
coils |
RATING & COMMENTS
|
MIRA’s Rating : |
B |
|
RATING |
STATUS |
PROPOSED CREDIT LINE |
|
|
26-40 |
B |
Capability to overcome financial difficulties seems comparatively
below average. |
Small |
|
Status : |
Moderate |
|
|
|
|
Payment
Behaviour : |
Unknown |
|
|
|
|
Litigation : |
Clear |
NOTES :
Any query related to this report can be made
on e-mail : infodept@mirainform.com
while quoting report number, name and date.
ECGC Country Risk Classification List – March 31st, 2011
|
Country Name |
Previous Rating (31.12.2010) |
Current Rating (31.03.2011) |
|
Thailand |
b1 |
b1 |
|
Risk Category |
ECGC
Classification |
|
Insignificant |
A1 |
|
Low |
A2 |
|
Moderate |
B1 |
|
High |
B2 |
|
Very High |
C1 |
|
Restricted |
C2 |
|
Off-credit |
D |
Company name
G
STEEL PUBLIC COMPANY
LIMITED
[FORMER : SIAM STRIP
MILL PUBLIC COMPANY
LIMITED]
SUMMARY
BUSINESS
ADDRESS : 18th FLOOR, PASO
TOWER,
88 SILOM
ROAD, SURIYAWONGSE,
BANGRAK, BANGKOK
10500, THAILAND
TELEPHONE : [66]
2634-2222
FAX :
[66] 2634-3771,
2634-4114
E-MAIL
ADDRESS : recruit@g-steel.com, info@g-steel.com
REGISTRATION
ADDRESS : SAME
AS BUSINESS ADDRESS
ESTABLISHED : 1995
REGISTRATION
NO. : 0107538000746 [Former : BOR MOR
JOR. 597]
CAPITAL
REGISTERED : BHT.
18,960,000,000
CAPITAL
PAID-UP : BHT.
16,481,695,198
FISCAL
YEAR CLOSING DATE : DECEMBER 31
LEGAL
STATUS : PUBLIC LIMITED
COMPANY
EXECUTIVE : MR. AHAB G.
GARAS, AMERICAN
CO-CHIEF
EXECUTIVE OFFICER
NO.
OF STAFF : 644
LINES
OF BUSINESS : HOT-ROLLED
STEEL COILS
MANUFACTURER, DISTRIBUTOR
AND EXPORTER
CORPORATE PROFILE
OPERATING
TREND : STABLE
PRESENT
SITUATION : OPERATING
NORMALLY
REPUTATION : FAIR
FOR NORMAL BUSINESS
ENGAGEMENT
MANAGEMENT
STANDARD : MANAGEMENT
WITH LOW PERFORMANCE
HISTORY
The subject was
established on October
31, 1995 as
a private limited
company. It is
an affiliated company
of SSP Group
of Companies.
SSP Group of Companies [SSP],
holding majority shares
in the subject
and the main
sponsor of the
project. SSP, one
of Thailand’s largest
conglomerates, is the
Southeast Asia’s most
dominant producer of
steel pipes with
a combined annual
capacity of approximately
850,000 tons. It
also owns one
steel coil center
with an annual
capacity of approximately
150,000 tons. Dr.
Somsak Leeswadtrakul, a
pioneer in Thai
and Southeast Asia
steel industry, leads
the SSP Group.
The subject will
complement SSP Group’s
established core business.
The subject also
has equity participation
from a number
of prominent Japanese
companies including ITOCHU
etc. The project
is strongly supported
by The Japanese
Government in the
form of loan
guarantees issued by
The Ministry of
International Trade and
Industries [MITI]. The
subject registered for
a conversion of
its status to
become a public
limited company on
December 12, 1995.
The subject received
promotional privilege from
the Board of Investment
on January 29,
1996 for the manufacturing
of hot
rolled coils. The
main privilege includes
the exemption from
import duty on
approved machinery, the
reduction of import
duty on approved
raw materials, and
the exemption from
corporate income tax
for the promoted
activities for a
period of eight
years from the
date when income
is first derived
together with reduction
of 50% corporate
income tax for
the promoted activities for
a period of
five years after
the exemption period.
On March 26, 2004, the subject changed
its name to G STEEL PUBLIC
COMPANY LIMITED, then
has listed on the
Stock Exchange of
Thailand [SET] under
the symbol name
“GSTEEL”, on January
25, 2006. It
currently employs 644
staff.
It achieved the
ISO 14001, TIS 18001
and OSHAS 18001
by BVQI, UKAS,
TUV NORD, TUV
Cert and NAC.
The subject’s registered
and business address
was 88 SSP
Tower 3, Silom Rd., Suriyawongse,
Bangrak, Bangkok 10500.
In 2010, “SSP
Tower 3” has been
renamed to “PASO
Tower”.
THE BOARD
OF DIRECTORS
|
Name |
|
Nationality |
Age |
|
|
|
|
|
|
Dr. Somsak Leesawadtrakul : Vice
Chairman |
|
Thai |
58 |
|
Mr. Chainarong Monthienvichienchai |
|
Thai |
66 |
|
Mr. Preecha Prakobkij |
|
Thai |
63 |
|
Lady Patama Leesawadtrakul |
[x] |
Thai |
46 |
|
Mr. Paichit Rojanavanich |
|
Thai |
83 |
|
Mr. Yanyong Kurovart |
[x] |
Thai |
73 |
|
Mr. Prapunpong Vejjachewa |
|
Thai |
76 |
|
Mr. Vichit Supinij : Chairman |
|
Thai |
70 |
|
Mr. Ryuzo Ogino |
[x] |
Japanese |
68 |
|
Gen. Chuchat Khambhu
Na Ayudhya |
|
Thai |
68 |
|
Pol. Lt. Gen. Prakas Sataman |
[x] |
Thai |
69 |
|
Mr. Sitthichai Leesawadtrakul |
|
Thai |
33 |
|
Mr. Komol Wong-apai |
|
Thai |
74 |
|
Mr. Ahab G. Garas |
|
American |
- |
|
Mr. Ariel Seth Levy |
[x] |
American |
- |
AUTHORIZED PERSON
Any two of
the above directors
[x] can jointly
sign on behalf
of the subject with
the company’s affixed.
MANAGEMENT
Mr. Ahab G. Garas
is the Co-Chief
Executive Officer.
He is American
nationality.
Mr. Ryuzo Ogino is
the Co-Chief Executive
Officer.
He is Japanese
nationality with the
age of 68
years old.
Mr. Ariel Seth Levy
is the Chief
Finance Officer.
He is American
nationality.
Lady Patama Leesawadtrakul is the
Chief CSR.
She is Thai
nationality with the
age of 46
years old.
Mr. Nakun Sakunchotikarote is
the Chief Operation
Officer.
He is Thai
nationality.
Ms. Kannikar Soykeeree
is the Executive
Vice President.
She is Thai
nationality.
Mr. Wuthichai Srethabutra is
the Chief Administration Officer.
He is Thai
nationality.
BUSINESS OPERATIONS
The subject’s activity
is a producer
and distributor of
a wide range
of high quality
hot-rolled steel coil
aiming at substituting
imports and meeting
domestic customers’ demands. Its
product serve as raw
materials for such
downstream industries as
cold-rolled coils, galvanized
steel, steel pipe,
structural products for construction,
automobile as well as
steel furniture, LPG
container, electrical
appliances industries. The
production has annual
full capacity of
3,400,000 metric tons
per year.
The subject’s plant has
currently used new modern technology
for the production
and completed base facilities
systems, called “Compact Mini Mill”, consists of Electric Arc Furnace,
Medium Stab Casting
Machinery and Hot
Strip Mill, located
in the same
plant.
IMPORT [COUNTRIES]
80% of its
raw materials; steel
scrap, pig iron, machinery and
spare parts are
imported from Japan,
Singapore, Germany and
United States of
America, the remaining
20% is purchased
locally.
MAJOR SUPPLIERS
Stena Metal Inc.
:
United States of
America
Steel Base Trade
AG. :
Germany
Cargill International Trading
Pte. Ltd. :
Singapore
Multiserv [Thailand] Co.,
Ltd. :
Thailand
Mannesmann Demag Huttentechnik GmbH. : Germany
Sumitomo Heavy Industries
Ltd. :
Japan
Mitsubishi Heavy Industry
Ltd. :
Japan
SALES [LOCAL]
90% of its products
is sold locally
to manufacturers,
wholesalers and trading
companies.
EXPORT
10% of its
products is exported
to Singapore, Korea,
Japan and other
countries in Asia, Europe,
Middle East and
North America.
MAJOR CUSTOMERS
Intergrade AG. :
Germany
Mitsui & Co.
[Thailand] Ltd. : Thailand
Nippon Steel Trading
Ltd. : Japan
Cargill International Trading
Pte. Ltd. :
Singapore
Stemcor [SEA] Pte.
Ltd. : Singapore
Nara International Co.,
Ltd. : Thailand
Advanced Metal Fabrication
Co., Ltd. : Thailand
SUBSIDIARIES & AFFILIATED
COMPANY
The subject is
a member of
SSP Group of
Companies which has
several core business
including steel and stainless steel products, construction, property
development, hotel, international
trade, hospital, transport
and general industries.
The companies are as
follows:
Siam Professional Holding
Co., Ltd.
Business : Investment
company.
Oriental Access Co.,
Ltd.
Business Type :
Consulting service provider
for the group
of companies.
G J Steel Public
Company Limited
Business Type : Manufacturer of
hot rolled coil
steels.
LITIGATION
Bankruptcy and
Receivership
There are no
litigation on bankruptcy
and receivership cases
filed against the
subject found at
Legal Execution Department
for the past
five years.
Others
There are no
legal suits filed
against the subject
for the past
two years.
CREDIT
Sales are by
cash or on
the credits of
30-60 days.
Local bills are
paid by cash
or on the
credits of 30-60
days.
Imports are by
L/C at sight
and T/T.
Exports are against
T/T.
BANKING
Bangkok Bank Public
Co., Ltd.
[Soonthorn Kosa Branch :
Soonthorn Kosa Rd.,
Klongtoey, Bangkok 10110]
Kasikornbank Public Co.,
Ltd.
TMB Bank Public
Co., Ltd.
The Siam Commercial
Bank Public Co.,
Ltd.
EMPLOYMENT
The subject employs
644 staff [office
staff and factory
workers].
LOCATION DETAILS
The premise is
rented for administrative an office
at the heading
address on the 18th floor
of a multi-storey
building in a prime commercial area.
Factory is located
at 55 Moo
5, SSP Industrial
Park, T. Nonglalong,
A. Bankhai, Rayong
21120, Tel.: [66]
38 869-323 Fax:
[66] 38 869-333.
Premise is on
683,200 square meters
of land.
REMARK
CREDIT OF US$ 125,000
AGAINST DA TERMS
SHOULD BE IN
ORDER.
COMMENT
The Thai economy
overall in 2010
has some growth
above the previous year.
The demand for
domestic steel was
about 14 million
metric tons, 44.33% increased from
the year before.
The steel products
with the increased use
was the flat-shaped steel
due to the demand of
downstream industries, such
as automobile and
electrical appliance
industries expanding at a
higher rate and
the trend of the
steel industry in 2011
expecting to expand
continuously.
As a result,
the company had a
turnover increased from the
previous year. However,
the company and the operators of the
same business around
the world had
faced the severe
economic crisis in
2008. For the
company, it had clear
guidelines on solving
the liquidity problem,
on supply of
working capital, and
on the adjustment of the operational structure to get stronger. Such
measures included seeking
new strategic partners,
searching for new sources of working capital and
loan from both domestic
and international financial institutions,
as well as
negotiating with suppliers
and accelerating debt collecting process, while increasing cash
transactions.
The company satisfactorily maintained its sales
performance in 2010 due to
careful operation driven
by clear corporate
vision. The company’s
facility is one of a few
in Southeast Asia
that were able
to maintain their
performance within the
same level as
the previous year.
FINANCIAL INFORMATION
The capital was initially
registered at Bht. 50,000,000 divided into 500,000
shares of Bht.
100 each.
On December 12,
1995, the capital
was increased to
Bht. 5,000,000,000, divided
into 500,000,000 shares
of Bht. 10
each.
The latest capital was
increased to Bht. 18,960,000,000 divided
into 18,960,000,000 shares of
Bht. 1 each
with the current
capital paid-up of
Bht. 16,481,695,198.
MAIN SHAREHOLDERS : [as at June 17,
2011] at Bht.
16,481,695,198 of capitalization.
|
NAME |
HOLDING |
% |
|
|
|
|
|
Superior Overseas [Thailand]
Co., Ltd. |
2,522,588,903 |
15.31 |
|
Lady Pattama Leesawadtrakul |
1,434,623,093 |
8.70 |
|
Thai NVDR Co.,
Ltd. |
1,024,341,600 |
6.22 |
|
Whiterock Global Fund
SPC. |
892,200,414 |
5.41 |
|
The Bank of
New York [Nominees] Limited |
610,451,300 |
3.70 |
|
Mr. Sitthichai Leesawadtrakul |
334,946,800 |
2.03 |
|
HSBC Private Bank [Suisse] SA, |
243,687,200 |
1.48 |
|
Mr. Nirand Ngamchamnanrith |
229,960,800 |
1.40 |
|
Mr. Pramote Pasawong |
166,833,700 |
1.01 |
|
Somers [U.K.] Limited |
164,400,000 |
1.00 |
|
Other Shareholders : |
8,857,661,388 |
53.74 |
Total Shareholders :
7,474
NAME OF AUDITOR
& CERTIFIED PUBLIC
ACCOUNTANT NO. :
Mrs. Vilai Buranakittisophon No.
3920
BALANCE SHEET [BAHT]
The latest financial figures published as at December 31, 2010 & 2009 were:
ASSETS
|
Current Assets |
2010 |
2009 |
|
|
|
|
|
Cash and cash equivalents |
18,178,077 |
17,658,714 |
|
Trade accounts receivable |
226,347,305 |
996,665,965 |
|
Amount due from
related parties |
111,282,981 |
390,155,972 |
|
Inventories |
2,572,416,492 |
691,187,498 |
|
Other current assets |
269,662,942 |
425,853,210 |
|
|
|
|
|
Total Current Assets
|
3,197,887,797 |
2,521,521,359 |
|
|
|
|
|
Restricted deposits at
financial institutions |
27,493,574 |
31,725,449 |
|
Investments in associated |
3,066,378,647 |
3,502,800,000 |
|
Investments in subsidiaries |
957,881,336 |
992,236,875 |
|
Advance payment for
purchases of property, plant and
equipment |
- |
3,821,129,342 |
|
Property, plant and
equipment |
18,335,621,074 |
23,303,508,734 |
|
Intangible assets |
16,599,467 |
31,454,706 |
|
Other non-current assets |
247,499,853 |
311,650,709 |
|
Total Assets |
25,849,361,748 |
34,516,027,174 |
LIABILITIES &
SHAREHOLDERS' EQUITY [BAHT]
|
Current
Liabilities |
2010 |
2009 |
|
|
|
|
|
Short-term loan from financial institution |
201,259,479 |
228,828,690 |
|
Trade accounts payable |
7,815,797,034 |
6,431,967,517 |
|
Current portion of
liabilities which were included under the
former rehabilitation plan |
14,260,686 |
15,124,430 |
|
Bonds |
372,026,932 |
5,668,531,420 |
|
Short-term loan from other parties |
517,971,044 |
406,774,342 |
|
Advanced received from
customers |
2,182,592,744 |
1,784,553,409 |
|
Accrued expenses |
269,104,149 |
228,633,858 |
|
Accrued interest expenses |
1,639,160,707 |
1,325,002,510 |
|
Provisions |
1,302,278,245 |
884,191,549 |
|
Other current liabilities |
1,254,793,785 |
1,328,102,688 |
|
|
|
|
|
Total Current Liabilities |
15,569,244,805 |
18,301,710,413 |
|
Liabilities which were
included under the former rehabilitation plan |
529,526,161 |
562,973,119 |
|
Finance lease liabilities |
1,280,781 |
- |
|
Bonds |
669,656,810 |
- |
|
Total Liabilities |
16,769,708,557 |
18,864,683,532 |
|
|
|
|
|
Shareholders' Equity |
|
|
|
Share capital |
|
|
|
Authorised share
capital |
18,960,000,000 |
13,860,000,000 |
|
Issued and
paid up share capital |
16,481,695,198 |
13,760,435,198 |
|
Surplus on ordinary
shares |
|
|
|
Share premium |
1,145,125,214 |
1,976,477,530 |
|
Premium on
capital reduction |
206,307,094 |
206,307,094 |
|
Retained Earnings
[deficits] |
|
|
|
Appropriated - statutory
reserve |
763,976,886 |
763,976,886 |
|
Unappropriated |
[9,517,451,201] |
[1,055,853,066] |
|
Total Shareholders' Equity |
9,079,653,191 |
15,651,343,642 |
|
Total Liabilities &
Shareholders' Equity |
25,849,361,748 |
34,516,027,174 |
PROFIT & LOSS ACCOUNT
|
Sale |
2010 |
2009 |
|
|
|
|
|
Sale from sale of
goods rendering of production services |
7,856,484,328 |
9,839,959,917 |
|
Sale from rendering
of services |
- |
402,995,660 |
|
Reversal of allowance
for devaluation of inventories |
913,693,213 |
2,076,078,095 |
|
Reversal of provision for loss
on purchase order for
undelivered raw material |
221,946,374 |
- |
|
Net foreign exchange
gain |
1,237,462,302 |
562,654,685 |
|
Gain from debt
restructuring |
3,187,595,196 |
- |
|
Other incomes |
122,179,494 |
252,622,707 |
|
Total Sales |
13,539,360,907 |
13,134,311,064 |
|
Expenses |
|
|
|
|
|
|
|
Cost of sale
of goods and rendering of production services |
8,480,825,438 |
13,674,789,085 |
|
Selling expenses |
96,072,035 |
151,035,660 |
|
Administrative expenses |
821,228,128 |
553,939,729 |
|
Management benefit expenses |
46,076,476 |
32,753,819 |
|
Loss purchase order
for undelivered raw materials |
- |
348,147,462 |
|
Bad and doubtful
debts expenses |
62,121,017 |
4,356,951,487 |
|
Loss on impairment of
assets |
8,983,356,797 |
1,906,992,628 |
|
Other expenses |
2,053,623,598 |
682,555,919 |
|
Total Expenses |
20,543,303,489 |
21,707,165,789 |
|
|
|
|
|
Loss before finance costs |
[7,003,942,582] |
[8,572,854,725] |
|
Finance costs |
[1,457,655,553] |
[1,178,357,649] |
|
Net Profit / [Loss] |
[8,461,598,135] |
[9,751,212,374] |
FINANCIAL ANALYSIS
|
ITEM |
UNIT |
2010 |
2009 |
|
|
|
|
|
|
LIQUIDITY RATIO |
|
|
|
|
CURRENT RATIO |
TIMES |
0.21 |
0.14 |
|
QUICK RATIO |
TIMES |
0.02 |
0.08 |
|
|
|
|
|
|
ACTIVITY RATIO |
|
|
|
|
FIXED ASSETS TURNOVER |
TIMES |
0.48 |
0.51 |
|
TOTAL ASSETS TURNOVER |
TIMES |
0.34 |
0.35 |
|
INVENTORY CONVERSION PERIOD |
DAYS |
110.71 |
18.45 |
|
INVENTORY TURNOVER |
TIMES |
3.30 |
19.78 |
|
RECEIVABLES CONVERSION PERIOD |
DAYS |
9.42 |
30.53 |
|
RECEIVABLES TURNOVER |
TIMES |
38.75 |
11.96 |
|
PAYABLES CONVERSION PERIOD |
DAYS |
336.38 |
171.68 |
|
CASH CONVERSION CYCLE |
DAYS |
(216.25) |
(122.70) |
|
|
|
|
|
|
PROFITABILITY
RATIO |
|
|
|
|
COST OF GOODS SOLD |
% |
96.70 |
114.76 |
|
SELLING & ADMINISTRATION |
% |
10.98 |
6.19 |
|
INTEREST |
% |
16.62 |
9.89 |
|
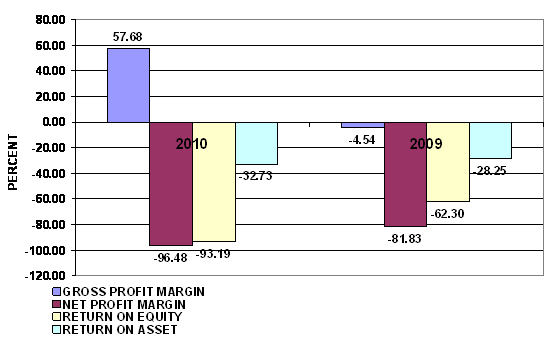
GROSS PROFIT MARGIN |
% |
57.68 |
(4.54) |
|
NET PROFIT MARGIN BEFORE EX. ITEM |
% |
(79.86) |
(71.94) |
|
NET PROFIT MARGIN |
% |
(96.48) |
(81.83) |
|
RETURN ON EQUITY |
% |
(93.19) |
(62.30) |
|
RETURN ON ASSET |
% |
(32.73) |
(28.25) |
|
EARNING PER SHARE |
BAHT |
(51.34) |
(70.86) |
|
|
|
|
|
|
LEVERAGE RATIO |
|
|
|
|
DEBT RATIO |
TIMES |
0.65 |
0.55 |
|
DEBT TO EQUITY RATIO |
TIMES |
1.85 |
1.21 |
|
TIME INTEREST EARNED |
TIMES |
(4.80) |
(7.28) |
|
|
|
|
|
|
ANNUAL GROWTH |
|
|
|
|
SALES GROWTH |
% |
(26.40) |
|
|
OPERATING PROFIT |
% |
(18.30) |
|
|
NET PROFIT |
% |
13.23 |
|
|
FIXED ASSETS |
% |
(21.32) |
|
|
TOTAL ASSETS |
% |
(25.11) |
|
PROFITABILITY RATIO
|
Gross Profit Margin |
57.68 |
Impressive |
Industrial Average |
13.13 |
|
Net Profit Margin |
(96.48) |
Deteriorated |
Industrial Average |
(6.46) |
|
Return on Assets |
(32.73) |
Deteriorated |
Industrial Average |
(1.65) |
|
Return on Equity |
(93.19) |
Deteriorated |
Industrial Average |
(8.33) |
Gross Profit Margin used to assess a firm's financial health by
revealing the proportion of money left over from sales after accounting for the
cost of goods sold. Gross profit margin serves as the source for paying
additional expenses and future savings. The company's figure is 57.68%. When
compared with the industry average, the ratio of the company was higher. This
indicated that company was more profitable than the same industry.
Net Profit Margin is the indicator of the company's efficiency in that
net profit takes into consideration all expenses of the company. A low profit
margin indicates a low margin of safety, higher risk that a decline in sales
will erase profits and result in a net loss. The company's figure is -96.48%.
When compared with the industry average, the ratio of the company was lower.
Return on Assets measures how efficiently profits are being generated
from the assets employed in the business when compared with the ratios of firms
in a similar business. A low ratio in comparison with industry averages
indicates an inefficient use of business assets. When compared with the
industry average, it was lower, the company's figure is -32.73%.
Return on Equity indicates how profitable a company is by comparing its
net income to its average shareholders' equity, ROE measures how much the
shareholders earned for their investment in the company. When compared with the
industry average, it was lower, the company's figure is -93.19%.
Trend of the
average competitors in the same industry for last 5 years
Return on Assets Downtrend
Return on Equity Downtrend
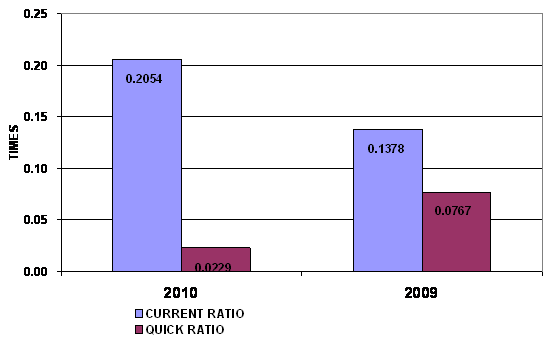
LIQUIDITY RATIO
|
Current Ratio |
0.21 |
Risky |
Industrial Average |
20.66 |
|
Quick Ratio |
0.02 |
|
|
|
|
Cash Conversion Cycle |
(216.25) |
|
|
|
The Current Ratio is to ascertain whether a company's short-term assets
are readily available to pay off its short-term liabilities. The company's
figure is 0.21 times in 2010, increase from 0.14 times, then the company may
not be efficiently using its current assets. When compared with the industry
average, the ratio of the company was lower.
The Quick Ratio is a liquidity indicator that further refines the
current ratio by measuring the amount of the most liquid current assets there
are to cover current liabilities. The company's figure is 0.02 times in 2010,
decrease from 0.08 times, then the company has not enough current assets that
presumably can be quickly converted to cash for pay financial obligations.
The Cash Conversion Cycle measures the number of days a company's cash
is tied up in the production and sales process of its operations and the
benefit from payment terms from its creditors. It meant the company could
survive when no cash inflow was received from sale for -217 days.
Trend of the
average competitors in the same industry for last 5 years
Current Ratio Uptrend

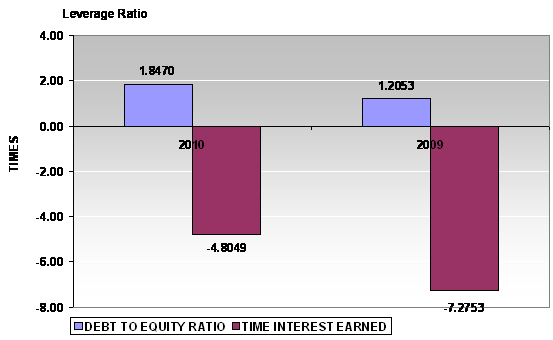
LEVERAGE RATIO
|
Debt Ratio |
0.65 |
Impressive |
Industrial Average |
0.95 |
|
Debt to Equity Ratio |
1.85 |
Acceptable |
Industrial Average |
2.25 |
|
Times Interest Earned |
(4.80) |
Risky |
Industrial Average |
81.13 |
Debt to Equity Ratio a measurement of how much suppliers, lenders,
creditors and obligors have committed to the company versus what the shareholders
have committed. A lower the percentage means that the company is using less
leverage and has a stronger equity position.
Times Interest Earned measuring a company's ability to meet its debt
obligations. Ratio is -4.81 lower than 1, so the company is not generating
enough cash from EBIT to meet its interest obligations.
Debt Ratio shows the proportion of a company's assets which are financed
through debt. The company's figure is 0.65 greater than 0.5, most of the
company's assets are financed through debt.
Trend of the
average competitors in the same industry for last 5 years
Debt Ratio Uptrend
Times Interest Earned Uptrend
ACTIVITY RATIO
|
Fixed Assets Turnover |
0.48 |
Deteriorated |
Industrial Average |
62.51 |
|
Total Assets Turnover |
0.34 |
Deteriorated |
Industrial Average |
1.66 |
|
Inventory Conversion Period |
110.71 |
|
|
|
|
Inventory Turnover |
3.30 |
Deteriorated |
Industrial Average |
12.67 |
|
Receivables Conversion Period |
9.42 |
|
|
|
|
Receivables Turnover |
38.75 |
Impressive |
Industrial Average |
14.78 |
|
Payables Conversion Period |
336.38 |
|
|
|
Trend of the
average competitors in the same industry for last 5 years
Fixed Assets Turnover Uptrend
Total Assets Turnover Uptrend
Inventory Turnover Uptrend
Receivables Turnover Uptrend
FOREIGN EXCHANGE RATES
|
Currency |
Unit
|
Indian Rupees |
|
US Dollar |
1 |
Rs.44.94 |
|
UK Pound |
1 |
Rs.71.91 |
|
Euro |
1 |
Rs.64.60 |
RATING EXPLANATIONS
|
RATING |
STATUS |
PROPOSED CREDIT LINE |
|
|
>86 |
Aaa |
Possesses an extremely sound financial base with the strongest
capability for timely payment of interest and principal sums |
Unlimited |
|
71-85 |
Aa |
Possesses adequate working capital. No caution needed for credit
transaction. It has above average (strong) capability for payment of interest
and principal sums |
Large |
|
56-70 |
A |
Financial & operational base are regarded healthy. General unfavourable
factors will not cause fatal effect. Satisfactory capability for payment of
interest and principal sums |
Fairly Large |
|
41-55 |
Ba |
Overall operation is considered normal. Capable to meet normal
commitments. |
Satisfactory |
|
26-40 |
B |
Capability to overcome financial difficulties seems comparatively
below average. |
Small |
|
11-25 |
Ca |
Adverse factors are apparent. Repayment of interest and principal sums
in default or expected to be in default upon maturity |
Limited with full
security |
|
<10 |
C |
Absolute credit risk exists. Caution needed to be exercised |
Credit not
recommended |
|
---- |
NB |
New Business |
---- |
This score serves as a reference to assess SC’s credit risk and
to set the amount of credit to be extended. It is calculated from a composite
of weighted scores obtained from each of the major sections of this report. The
assessed factors and their relative weights (as indicated through %) are as
follows:
Financial
condition (40%) Ownership
background (20%) Payment
record (10%)
Credit history
(10%) Market trend
(10%) Operational
size (10%)
This report is issued at your request without any
risk and responsibility on the part of MIRA INFORM PRIVATE LIMITED (MIPL)
or its officials.