![]()
MIRA INFORM REPORT
|
Report Date : |
14.03.2011 |
IDENTIFICATION DETAILS
|
Name : |
FILANDER SL |
|
|
|
|
Registered Office : |
Calle Casp, 54 - Planta 1.Pta. 2, 08010 |
|
|
|
|
Country : |
|
|
|
|
|
Financials (as on) : |
31.12.2009 |
|
|
|
|
Date of Incorporation : |
|
|
|
|
|
Legal Form : |
Limited Liability Company |
|
|
|
|
Line of Business : |
RATING & COMMENTS
|
MIRA’s Rating : |
Ba |
|
RATING |
STATUS |
PROPOSED CREDIT LINE |
|
|
41-55 |
Ba |
Overall operation is considered normal. Capable to meet normal
commitments. |
Satisfactory |
|
Maximum Credit Limit : |
129.000,00 € |
|
|
|
|
Status : |
Satisfactory |
|
|
|
|
Payment
Behaviour : |
No Complaints |
|
|
|
|
Litigation : |
Clear |
NOTES :
Any query related to this report can be made
on e-mail : infodept@mirainform.com
while quoting report number, name and date.
ECGC Country Risk Classification List – December 31, 2010
|
Country Name |
Previous Rating (30.09.2010) |
Current Rating (31.12.2010) |
|
|
a2 |
a2 |
|
Risk Category |
ECGC
Classification |
|
Insignificant |
A1 |
|
Low |
A2 |
|
Moderate |
B1 |
|
High |
B2 |
|
Very High |
C1 |
|
Restricted |
C2 |
|
Off-credit |
D |
Company name
FILANDER SL
TAX NUMBER: B60056348
EXECUTIVE SUMMARY
Identification
Current Business Name: FILANDER SL
Other names: NO
Current Address: CALLE CASP, 54 - PLANTA
1.PTA. 2
Telephone number: 934124995 Fax: 934127208
URL: www.filander.es
Corporate e-mail: filandercial@filander.es
Trade Risk
Credit Appraisal: 129.000,00 €
Incidents: NO
Bank and business defaults of payment - ASNEF INDUSTRIAL: NO
Financial Information
Balance sheet latest sales (2009): 7.021.477,78 €
(Trade Register)
Result: 19.831,33 €
Total Assets: 5.122.465,73 €
Social Capital: 842.400,00 €
Employees: 4
Listed on a Stock Exchange: NO
Commercial Information
Incorporation date: 04/03/1992
Activity: Wholesale of textiles
NACE 2009 CODE: 4641
International Operations: Imports and
Exports
Corporate Structure
President:
Participations: 1
Other Complementary Information
Latest act published in BORME: 25/08/2010 Annual Filed Accounts
Bank Entities: There are
The date when this report was last updated is 12/03/2011.
The information contained in this report has been investigated and
contrasted on 03/02/2011
Credit Appraisal
Maximum Credit
(from 0 to 6,000,000 €)
Favourable to 129.000,00 €
Financial Situation
Exercise:2009
|
Treasury |
Excellent |
|
Indebtedness |
Bad |
|
Profitability |
Null |
|
Balance |
Excellent |
Performance
|
Incidents |
None or Negligible |
|
Business
Trajectory |
|
INCIDENTS

Summary
LEGAL ACTIONS: No legal actions registered
ADMINISTRATIVE CLAIMS: No administrative claims registered
AFFECTED BY:
2 Company / Companies in Insolvency Proceedings.
BANK AND BUSINESS DEFAULTS OF PAYMENT - ASNEF INDUSTRIAL
![]()
FINANCIAL ELEMENTS AND SECTORIAL COMPARATIVE
FINANCIAL ELEMENTS
The shaded amounts in the following financial statements have been converted to the norms established in the PGC2007 derived from RD 1514/2007 and 1515/2007, this way comparatives could be shown with the amounts of exercises initiated from 1/01/08.
Figures given in €
|
|
31/12/2009 (12) |
% ASSETS |
31/12/2008 (12) |
% ASSETS |
31/12/2007 (12) |
% ASSETS |
|
ASSETS |
|
|
|
|
|
|
|
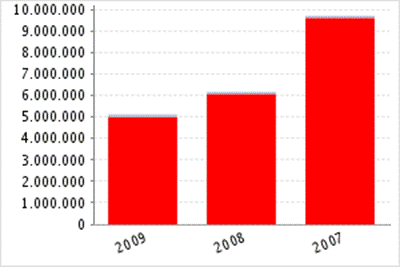
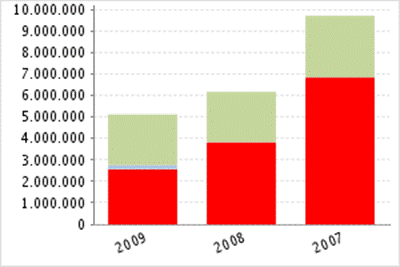
A) NON CURRENT ASSETS |
121.809,13 |
2,38 |
92.654,66 |
1,50 |
95.674,35 |
0,98 |
|
B) CURRENT ASSETS |
5.000.656,60 |
97,62 |
6.075.568,93 |
98,50 |
9.621.303,59 |
99,02 |
|
LIABILITIES |
|
|
|
|
|
|
|
A) NET WORTH |
2.359.452,09 |
46,06 |
2.336.121,96 |
37,87 |
2.874.365,24 |
29,58 |
|
B) NON CURRENT LIABILITIES |
199.129,95 |
3,89 |
8.517,64 |
0,14 |
7.901,68 |
0,08 |
|
C) CURRENT LIABILITIES |
2.563.883,69 |
50,05 |
3.823.583,99 |
61,99 |
6.834.711,02 |
70,34 |
|
|
|
|
|
|
|
|
|
Balance Sheet Comments
Total assets of the company decreased in 16,95%
between 2.008 and 2.009.
In spite of the decrease in the amount of total assets, non current
assets grew 31,47%.
Assets reduction contrasts with net worth growth
of 1,00%. Therefore, the company’s indebtedness has reduced
in 27,90%.
Total assets of the company decreased in 36,52%
between 2.007 and 2.008.
This total assets decrease has been reflected in a reduction of non
current assets of 3,16%.
Assets reduction is partly explained by the Net Worth decrease
of 18,73%; nevertheless, the decrease of 44,00% in the
indebtedness explains mainly this reduction.
Profit and Loss Account Analysis
Figures given in €
|
|
31/12/2009 (12) |
% NET TURNOVER |
31/12/2008 (12) |
% NET TURNOVER |
31/12/2007 (12) |
% NET TURNOVER |
|
SALES |
7.021.477,78 |
|
8.921.777,28 |
|
13.423.215,14 |
|
|
GROSS MARGIN |
1.111.384,22 |
15,83 |
1.207.780,02 |
13,54 |
2.008.503,56 |
14,96 |
|
EBITDA |
291.306,97 |
4,15 |
122.067,86 |
1,37 |
685.855,24 |
5,11 |
|
EBIT |
204.572,51 |
2,91 |
-92.753,59 |
-1,04 |
471.368,18 |
3,51 |
|
NET RESULT |
19.831,33 |
0,28 |
-549.384,40 |
-6,16 |
118.195,97 |
0,88 |
|
EFFECTIVE TAX RATE (%) |
4,23 |
0,00 |
3,93 |
0,00 |
30,73 |
0,00 |


Profit and Loss Account Comments
The company’s sales figure decreased
in 21,30% between 2.008 and 2.009.
The company’s EBIT grew
in 320,55% between 2.008 and 2.009.
This evolution implies an increase in the company’s economic
profitability .
The result of these variations is an increase of the company’s Economic
Profitability of 468,91% in the analysed period, being equal
to 4,39% in the year 2.009.
The Net Result of the company grew
in 103,61% between 2.008 and 2.009.
The company’s Financial Profitability has been negatively affected by
the financial activities in comparison with EBITs behaviour .
The result of these variations is an increase of the company’s Economic
Profitability of 103,87% in the analysed period, being equal
to 0,88% in the year 2.009 .
The company’s sales figure decreased in 33,53% between 2.007 and 2.008.
The company’s EBIT decreased
in 119,68% between 2.007 and 2.008.
This evolution implies a reduction in the economic profitability of the
company .
The result of these variations is a decrease of the company’s Operating
Profitability of 123,52% in the analysed period, being this
profitability of -1,19% in the year 2.008.
The Net Result of the company decreased
in 564,81% between 2.007 and 2.008.
The company’s Financial Profitability has been negatively affected by
the financial activities in comparison with EBITs behaviour .
The result of these variations is a reduction of the company’s economic
profitability of 482,83% in the analysed period, being equal to -22,74% in
the year 2.008 .
COMPARATIVE SECTOR ANALYSIS
Values table
Figures expressed in %
|
|
COMPANY (2009) |
SECTOR |
DIFFERENCE |
|
BALANCE SHEET ANALYSIS: % on the total
assets |
|
|
|
|
ASSETS |
|
|
|
|
A) NON CURRENT ASSETS |
2,38 |
19,15 |
-16,77 |
|
A) CURRENT ASSETS |
97,62 |
80,85 |
16,77 |
|
LIABILITIES |
|
|
|
|
A) NET WORTH |
46,06 |
46,38 |
-0,32 |
|
B) NON CURRENT LIABILITIES |
3,89 |
5,14 |
-1,26 |
|
C) CURRENT LIABILITIES |
50,05 |
48,48 |
1,57 |
|
|
|
|
|
|
|
COMPANY (2009) |
SECTOR |
DIFFERENCE |
|
PROFIT AND LOSS ACCOUNT ANALYSIS: % on the total
operating income |
|
|
|
|
SALES |
100,00 |
98,59 |
1,41 |
|
GROSS MARGIN |
15,83 |
29,62 |
-13,80 |
|
EBITDA |
4,15 |
6,29 |
-2,14 |
|
EBIT |
2,91 |
4,80 |
-1,89 |
|
NET RESULT |
0,28 |
2,62 |
-2,33 |
Sector Composition
Compared sector (NACE 2009): 4641
Number of companies: 81
Size (Sales Figure): 7,000,000.00 - 40,000,000.00 Euros
Comments on the sectorial
comparative
Compared to its sector the assets of the companies show an
inferior proportion of non current assets. Specifically the difference with the
sector average is -16,77% .
In liabilities composition the company appeals on a smaller scale to
self financing, being the Net Worth proportion 0,32% inferior. As a
consequence, external financing sources are more used by the company
( 0,32% more than the sector) .
The proportion that the sales mean to the company’s total ordinary
income is 100,00% , an 1,41% higher than in the sector .
The company’s EBIT was positive and was 2,91% with regard to
the total ordinary income, 1,89% inferior to the one of the sector .
The company’s capacity to generate operating income is inferior to that
of the sector as its ratio EBIT/Sales is inferior (0,03 in comparison
with 0,05) .
The company’s net result was positive and equal to 0,28% with
regard to the total ordinary income, -2,33% inferior to the one of
the sector .
The financial results and the tax impact have had a negative impact on
the net result of the company with a worse behaviour that the one of the sector
.
OTHER DATA FROM THE ANNUAL FINANCIAL REPORT
Results
Distribution
Source: annual financial report 2009
Figures given in €
|
DISTRIBUTION BASE |
APPLICATION A |
||
|
Profit and Loss |
19.831,33 |
Legal Reserve |
0,00 |
|
Carry over |
0,00 |
Voluntary Reserve |
0,00 |
|
Voluntary reserves |
0,00 |
Prior years losses |
19.831,33 |
|
Reserves |
0,00 |
Carry over |
0,00 |
|
Other concepts |
0,00 |
Other funds |
0,00 |
|
Total of Amounts to be distributed |
19.831,33 |
Dividends |
0,00 |
|
|
|
Other Applications |
0,00 |
Auditing
Source: filing of annual financial statement 2009
Auditors’ opinion: FAVOURABLE
Auditor: TARRES SINFREU FRANCISCO
Auditing fees: 4.820,00 €
Facts subsequent
to the closing
Source: Annual financial report 2009
Posterior to the closure there were no relevant facts that require the
inclusion in the annual accounts.
company ADDRESSES
Current Legal Seat Address:
CALLE CASP, 54 - PLANTA 1.PTA. 2
08010
Characteristics of
the current address
Type of establishment: store
Owners: rented
Local Situation: secondary
CORPORATE STRUCTURE
ADMINISTRATIVE
LINKS
Main Board
members, Directors and Auditor ![]()
|
POSITION |
NAME AND SURNAME |
APPOINTMENT DATE |
|
|
PRESIDENT |
JOVER BERENGUER JORGE |
21/02/2002 |
|
|
MEMBER OF THE BOARD |
JOVER MARTI MERCEDES |
21/02/2002 |
|
|
MEMBER OF THE BOARD |
JOVER COLL JORGE |
21/02/2002 |
|
|
MEMBER OF THE BOARD |
JOVER MARTI ELSA |
09/04/2007 |
|
|
AUDITOR |
APPOINTMENT DATE |
||
|
TARRES SINFREU FRANCISCO |
10/12/2009 |
||
|
PONSA VILALTA JOSEP |
10/12/2009 |
||
There are 6 board members, directors and auditors registered
Board members remuneration
Source: Annual financial report 2009
Board members remuneration: 63.140,00 €
Functional
Managers
|
POSITION |
NAME AND SURNAME |
|
Manager |
JOVER MARTI ELSA |
|
Financial Director |
JOVER MARTI ELSA |
|
Commercial Director |
JOVER MARTI ELSA |
|
Exports Director |
GIRON JAVIER |
|
Imports Director |
GIRON JAVIER |
FINANCIAL LINKS
|
|
BUSINESS NAME |
CIF / COUNTRY |
% |
SOURCE |
DATE REP. |
|
|
JOVER BELENGUER JORGE |
|
27,00 |
OWN SOURCES |
30/09/2010 |
|
|
FAMILIA JOVER |
|
21,00 |
OWN SOURCES |
03/02/2011 |
|
|
REVOJ SA |
A08774127 |
17,00 |
OWN SOURCES |
30/09/2010 |
|
|
INVESPAT BELITA S.L. |
B61802179 |
11,00 |
OWN SOURCES |
30/09/2010 |
|
|
LUIS JOVER SA |
A08019259 |
7,00 |
OWN SOURCES |
30/09/2010 |
|
|
JOVER COLL JORGE |
|
Indef. |
OWN SOURCES |
30/09/2010 |
There are 8 direct financial links through shareholders
registered
|
|
BUSINESS NAME |
CIF / COUNTRY |
% |
SOURCE |
DATE REP. |
|
|
MID FILANDER S.L. |
B64041197 |
50,00 |
OWN SOURCES |
12/02/2010 |
There are 1 direct financial links through participations
registered
CREDIT INFORMATION
Incorporation date: 04/03/1992
Establishment date: 01/01/1992
Founder’s Name: LA TITULAR ES LA FUNDADORA INICIAL DEL NEGOCIO
Activity: Wholesale of textiles
NACE 2009 CODE: 4641
NACE 2009 Activity: Wholesale of textiles
Business: COMPRA VENTA, IMPORTACION Y EXPORTACION DE TODA
CLASE DE HILADOS, TEJIDOS Y PRENDAS TEXTILES Y CUALQUIER OTRO PRODUCTO
RELACIONADO CON LA MODA.
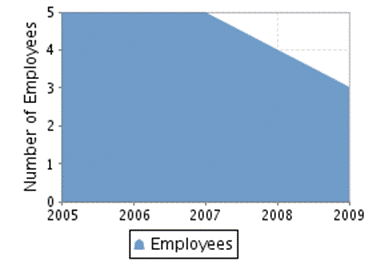
Latest employees figure: 4 (2011)
% of fixed employees: 100,00%
Employees
evolution
|
|
|
|
COMMERCIAL OPERATIONS
PURCHASES
Import Percentage: 90%
Imports from: CEE
National Distribution: 10%
SALES
Export Percentage: 38%
Exports to: CEE
National Distribution: 62%
CLIENTS
|
BUSINESS NAME |
INTERNATIONAL |
|
MID FILANDER S. L. |
NO |
There are 1 Clients
Sales breakdown
•
La mayor parte de su cifra de negocio corresponde a
la actividad de venta al por mayor.
Banks
|
ENTITY |
BRANCH |
ADDRESS |
TOWN OR CITY |
PROVINCE |
|
BANCO BILBAO VIZCAYA ARGENTARIA, S.A. |
1000 |
PL. DE CATALUÑA, 5 |
|
|
|
BANCO DE SABADELL, S.A. |
|
|
|
|
|
BANCO GUIPUZCOANO, S.A. |
0085 |
VIA |
|
|
There are 3 bank entities registered
Summary of bank operations
Discount facilities: 1
Credit policy: 0
Mortgage loan: 0
Loans with no real security: 0
Bank operations
|
Debt type: Discount
facilities |
Granted limit:1.100.000,00 € Used limit:475.710,60 € Available limit:624.289,40
€ Source: Filed
Accounts (2009) |
|
|
|
There are 1 bank operations registered
Leasing
Figures given in €
|
ENTITY |
ASSERTS INVOLVED IN THE ACTIVITY |
UP TO 1 YEAR |
FROM 1 TO 5 YEARS |
|
|
vehículo |
1.655,24 |
|
|
|
vehículo |
8.916,50 |
26.397,97 |
There are 2 leasing operations registered
LEGAL STRUCTURE
Constitution Data
Register Date: 04/03/1992
Register town:
Announcement number: 156692
Social Capital: 12.020,24 €
Legal form: Limited Liability Company
Social Capital: 842.400,00 €
Obligation to fill in Financial Statements: YES
Chamber census: YES (2009)
B.O.R.M.E.
(OFFICIAL
COMPANIES REGISTRY GAZETTE) ![]()
· Acts on activity: 0
· Acts on administrators: 17 (Last: 10/12/2009, first: 22/06/1992)
· Acts on capital: 9 (Last: 04/07/2006, first: 16/12/1991)
· Acts on creation: 1 (Last: 22/06/1992)
· Acts on filed accounts: 16 (Last: 25/08/2010, first: 23/08/1995)
· Acts on identification: 0
· Acts on Information: 2 (Last: 21/02/2002, first: 04/12/1996)
Latest acts in
B.O.R.M.E.
Other acts
|
ACT |
DATE |
NOTICE NUM. |
TRADE REGISTER |
|
Appointments |
10/12/2009 |
514040 |
|
|
Appointments |
13/10/2008 |
471061 |
|
|
Appointments |
27/11/2007 |
589411 |
|
|
Appointments |
09/04/2007 |
199596 |
|
|
Resignations |
09/04/2007 |
199596 |
|
|
Appointments |
09/04/2007 |
199595 |
|
|
Appointments |
22/12/2006 |
612952 |
|
|
Capital enlargement |
04/07/2006 |
344651 |
|
Latest filed accounts
|
ACT |
DATE |
NOTICE NUM. |
TRADE REGISTER |
|
Annual Filed Accounts (2009) |
25/08/2010 |
366450 |
|
|
Annual Filed Accounts (2008) |
25/09/2009 |
481680 |
|
|
Annual Filed Accounts (2007) |
25/08/2008 |
305658 |
|
There are 45 acts registered
FOREIGN EXCHANGE RATES
|
Currency |
Unit
|
Indian Rupees |
|
US Dollar |
1 |
Rs.45.21 |
|
|
1 |
Rs.72.55 |
|
Euro |
1 |
Rs.62.43 |
RATING EXPLANATIONS
|
RATING |
STATUS |
PROPOSED CREDIT LINE |
|
|
>86 |
Aaa |
Possesses an extremely sound financial base with the strongest
capability for timely payment of interest and principal sums |
Unlimited |
|
71-85 |
Aa |
Possesses adequate working capital. No caution needed for credit
transaction. It has above average (strong) capability for payment of interest
and principal sums |
Large |
|
56-70 |
A |
Financial & operational base are regarded healthy. General
unfavourable factors will not cause fatal effect. Satisfactory capability for
payment of interest and principal sums |
Fairly Large |
|
41-55 |
Ba |
Overall operation is considered normal. Capable to meet normal
commitments. |
Satisfactory |
|
26-40 |
B |
Capability to overcome financial difficulties seems comparatively
below average. |
Small |
|
11-25 |
Ca |
Adverse factors are apparent. Repayment of interest and principal sums
in default or expected to be in default upon maturity |
Limited with
full security |
|
<10 |
C |
Absolute credit risk exists. Caution needed to be exercised |
Credit not
recommended |
This score serves as a reference to assess SC’s credit risk
and to set the amount of credit to be extended. It is calculated from a
composite of weighted scores obtained from each of the major sections of this
report. The assessed factors and their relative weights (as indicated through
%) are as follows:
Financial
condition (40%) Ownership
background (20%) Payment
record (10%)
Credit history
(10%) Market trend
(10%) Operational
size (10%)
This report is issued at your request without any
risk and responsibility on the part of MIRA INFORM PRIVATE LIMITED (MIPL)
or its officials.