![]()
MIRA
INFORM REPORT
|
Report Date : |
25.03.2011 |
IDENTIFICATION DETAILS
|
Name : |
RODA INTERNACIONAL CANARIAS SL |
|
|
|
|
Registered Office : |
Calle Nicolas Estevanez, 11 - Plt Tercera B 35007 Las Palmas De Gran Canaria Palmas (Las) |
|
|
|
|
Country : |
|
|
|
|
|
Financials (as on) : |
31.12.2009 |
|
|
|
|
Date of Incorporation : |
21.06.1989 |
|
|
|
|
Legal Form : |
Sole-Partnered Limited Liability Company |
|
|
|
|
Line of Business : |
RATING & COMMENTS
|
MIRA’s Rating : |
Ba |
|
RATING |
STATUS |
PROPOSED CREDIT LINE |
|
|
41-55 |
Ba |
Overall operation is considered normal. Capable to meet normal
commitments. |
Satisfactory |
|
Maximum Credit Limit : |
164.743,00 € |
|
|
|
|
Status : |
Good |
|
|
|
|
Payment Behaviour : |
No Complaints |
|
|
|
|
Litigation : |
Clear |
NOTES :
Any query related to this report can be made
on e-mail: infodept@mirainform.com
while quoting report number, name and date.
ECGC Country Risk Classification List – December 31, 2010
|
Country Name |
Previous Rating (30.09.2010) |
Current Rating (31.12.2010) |
|
|
A2 |
A2 |
|
Risk Category |
ECGC
Classification |
|
Insignificant |
A1 |
|
Low |
A2 |
|
Moderate |
B1 |
|
High |
B2 |
|
Very High |
C1 |
|
Restricted |
C2 |
|
Off-credit |
D |
company Name
RODA INTERNACIONAL CANARIAS SL
TAX NUMBER: B35232776
EXECUTIVE SUMMARY
Identification
Current Business Name: RODA INTERNACIONAL CANARIAS SL
Commercial Name: RODA INTERNACIONAL
Other names: YES
Current Address: CALLE NICOLAS ESTEVANEZ, 11
- PLT TERCERA B
35007 LAS PALMAS DE GRAN CANARIA PALMAS (LAS)
Telephone number: 928220662 Fax: 928221674
URL: www.rodaint.com
Corporate e-mail: juan@rodaint.com
Trade Risk
Credit Appraisal: 164.743,00 €
Incidents: NO
R.A.I.: NO
Bank and business defaults of payment - ASNEF INDUSTRIAL: NO
Financial Information
Balance sheet latest sales (2009): 13.373.734,65 € (Trade Register)
Result: 35.269,18 €
Total Assets: 3.867.525,47 €
Social Capital: 300.024,00 €
Employees: 7
Listed on a Stock Exchange: NO
Commercial Information
Incorporation date: 21/06/1989
Activity: Wholesale of fish,
NACE 2009 CODE: 4638
International Operations: Imports and
Exports
Corporate Structure
Sole Administrator:
Parent Company:
Participations: 1
Other Complementary Information
Latest filed accounts published in the Mercantile Register: 2009
Type of Accounts available at the Mercantile Register: Individuals
Latest act published in BORME: 09/02/2011 Re-elections
Latest press article: No press articles
Bank Entities: There are
The date when this report was last updated is 23/03/2011.
The information contained in this report has been investigated and
contrasted on 23/03/2011
TRADE RISK
Credit Appraisal
Maximum Credit
(from 0 to
6,000,000 €)
Favourable to 164.743,00 €
Financial Situation
Exercise:2009
|
Treasury |
Excellent |
|
Indebtedness |
Average |
|
Profitability |
Null |
|
Balance |
Excellent |
Performance
|
Incidents |
None or Negligible |
|
Business
Trajectory |
|
Summary
LEGAL ACTIONS: No legal actions
ADMINISTRATIVE CLAIMS: No administrative claims
AFFECTED BY: No significant element.
BANK AND BUSINESS DEFAULTS OF PAYMENT - ASNEF INDUSTRIAL
![]()
Summary
COMPANY NOT REGISTERED IN ASNEF INDUSTRIAL
•
There are no information on the nif/cif provided in
the Asnef Industrial file
This information has been obtained through a consultation made to the
ASNEF INDUSTRIAL file. It can just be used for credit granting, monitoring and
credit control. This information could not be uploaded in any database nor
reused and could not be copied or reproduced or transferred to third parties.
ASNEF INDUSTRIAL is a brand property of Equifax Ibérica, S.L.
R.A.I.
COMPANY NOT REGISTERED IN THE R.A.I.
This company is not registered in the Disputed Bills register (R.A.I.)
DATE AND TIME OF THE CONSULTATION
18/03/2011 13:03:14
Information from the Registro de Aceptaciones Impagados (RAI)- Disputed
Bills register.
It can only be used for information legitimate needs of the consulting
party, in accordance with its social or business activity, in order to grant a
credit or the monitoring or control of the already granted credits and can not
be transmitted or communicated to thirds, nor copied, duplicated, reproduced
nor implemented to any database , owned or external, or reused it in anyway,
direct or indirectly.
FINANCIAL ELEMENTS AND SECTORIAL COMPARATIVE
FINANCIAL ELEMENTS
The shaded amounts in the following financial statements
have been converted to the norms established in the PGC2007 derived from RD
1514/2007 and 1515/2007, this way comparatives could be shown with the amounts of exercises
initiated from 1/01/08.
Figures given in €
|
|
31/12/2009 (12) BALANCE SHEET |
% ASSETS |
31/12/2008 (12) BALANCE SHEET |
% ASSETS |
31/12/2007 (12) BALANCE SHEET |
% ASSETS |
|
ASSETS |
|
|
|
|
|
|
|
A) NON CURRENT ASSETS |
78.806,32 |
2,04 |
24.954,10 |
0,42 |
270.800,27 |
4,66 |
|
B) CURRENT ASSETS |
3.788.719,15 |
97,96 |
5.909.342,81 |
99,58 |
5.534.674,94 |
95,34 |
|
LIABILITIES |
|
|
|
|
|
|
|
A) NET WORTH |
867.723,44 |
22,44 |
832.454,26 |
14,03 |
796.346,80 |
13,72 |
|
B) NON CURRENT LIABILITIES |
1.000.000,00 |
25,86 |
762.411,35 |
12,85 |
2.294.227,90 |
39,52 |
|
C) CURRENT LIABILITIES |
1.999.802,03 |
51,71 |
4.339.431,30 |
73,12 |
2.714.900,51 |
46,76 |
Profit and Loss Account Analysis ![]()
Figures given in €
|
|
31/12/2009 (12) BALANCE SHEET |
% NET TURNOVER |
31/12/2008 (12) BALANCE SHEET |
% NET TURNOVER |
31/12/2007 (12) BALANCE SHEET |
% NET TURNOVER |
|
SALES |
13.373.734,65 |
|
11.020.176,16 |
|
9.951.671,02 |
|
|
GROSS MARGIN |
1.278.026,82 |
9,56 |
1.010.588,41 |
9,17 |
920.216,66 |
9,25 |
|
EBITDA |
312.229,35 |
2,33 |
11.981,22 |
0,11 |
242.357,20 |
2,44 |
|
EBIT |
265.515,18 |
1,99 |
-116.317,38 |
-1,06 |
238.641,26 |
2,40 |
|
NET RESULT |
35.269,18 |
0,26 |
36.588,96 |
0,33 |
80.977,60 |
0,81 |
|
EFFECTIVE TAX RATE (%) |
29,62 |
|
27,37 |
|
32,53 |
|
COMPARATIVE SECTOR
ANALYSIS
Values table
Figures expressed in %
|
|
COMPANY (2009) |
SECTOR |
DIFFERENCE |
|
|
|
|
|
BALANCE SHEET ANALYSIS: % on the total
assets |
|
|
|
|
|
|
|
|
ASSETS |
|
|
|
|
|||
|
A) NON CURRENT ASSETS |
2,04 |
31,46 |
-29,42 |
|
|
|
|
|
A) CURRENT ASSETS |
97,96 |
68,54 |
29,42 |
|
|
|
|
|
LIABILITIES |
|
|
|
|
|||
|
A) NET WORTH |
22,44 |
36,10 |
-13,66 |
|
|
|
|
|
B) NON CURRENT LIABILITIES |
25,86 |
10,39 |
15,47 |
|
|
|
|
|
C) CURRENT LIABILITIES |
51,71 |
53,51 |
-1,81 |
|
|
|
|
|
|
|
|
|
|
|
|
|
|
|
COMPANY (2009) |
SECTOR |
DIFFERENCE |
|
|
|
|
|
PROFIT AND LOSS ACCOUNT ANALYSIS: % on the total
operating income |
|
|
|
|
|
|
|
|
SALES |
99,85 |
99,11 |
0,74 |
|
|
|
|
|
GROSS MARGIN |
9,54 |
16,43 |
-6,89 |
|
|
|
|
|
EBITDA |
2,33 |
3,79 |
-1,46 |
|
|
|
|
|
EBIT |
1,98 |
2,48 |
-0,49 |
|
|
|
|
|
NET RESULT |
0,26 |
1,40 |
-1,14 |
|
|
|
|
Sector Composition
Compared sector (NACE 2009): 4638
Number of companies: 244
Size (Sales Figure): 7,000,000.00 - 40,000,000.00 Euros
OTHER DATA FROM THE ANNUAL FINANCIAL REPORT
Results Distribution
Source: annual financial report 2009
Figures given in €
|
DISTRIBUTION BASE |
APPLICATION A |
||
|
Profit and Loss Account Balance |
35.269,18 |
Legal Reserve |
3.526,92 |
|
Carry over |
0,00 |
Goodwill reserve |
0,00 |
|
Voluntary reserves |
0,00 |
Special reserves |
0,00 |
|
Other reserves disposable at will |
0,00 |
Voluntary reserves |
31.742,26 |
|
Total of Amounts to be distributed |
35.269,18 |
Dividends |
0,00 |
|
|
|
Carry over and others |
0,00 |
|
|
|
Compensation of previous exercises losses |
0,00 |
|
|
|
Application total |
35.269,18 |
Facts subsequent to the closing
Source: Annual financial report 2009
Posterior to the closure there were no relevant facts that require the
inclusion in the annual accounts.
ADDRESSES
Current Legal Seat Address:
CALLE NICOLAS ESTEVANEZ, 11 - PLT TERCERA B
35007
|
STREET |
POSTAL CODE |
TOWN |
PROVINCE |
|
CALLE FOTOGRAFO XAIME PACHECO, 26 |
36209 |
|
Pontevedra |
CORPORATE STRUCTURE
ADMINISTRATIVE LINKS
Main Board members, Directors and Auditor ![]()
|
POSITION |
NAME AND SURNAME |
APPOINTMENT DATE |
|
|
SOLE ADMINISTRATOR |
MULERO CARRIZO ELSA JUANA |
21/01/2010 |
|
|
AUDITOR |
APPOINTMENT DATE |
||
|
RMA AUDITORES Y CONSULTORES SL |
09/02/2011 |
||
Board members remuneration
Source: Annual
financial report 2009
Board
members remuneration: 0,00 €
Functional Managers
|
POSITION |
NAME AND SURNAME |
|
Manager |
RESNIK MALAMUD RAUL LUCIO |
|
Commercial Director |
FERNANDEZ JOSE ANTONIO |
FINANCIAL LINKS
|
|
BUSINESS NAME |
CIF / COUNTRY |
% |
SOURCE |
DATE REP. |
|
|
GALBOA SA |
I80106013 |
100,00 |
OWN SOURCES |
18/06/2010 |
|
|
BUSINESS NAME |
CIF / COUNTRY |
% |
SOURCE |
DATE REP. |
|
|
LERMI SA |
|
100,00 |
OWN SOURCES |
16/06/2008 |
|
|
RESNIK MALAMUD RAUL LUCIO |
|
Indef. |
OWN SOURCES |
18/01/1996 |
|
|
BITTINI DELGADO LUIS |
|
Indef. |
OWN SOURCES |
18/01/1996 |
|
|
BUSINESS NAME |
CIF / COUNTRY |
% |
SOURCE |
DATE REP. |
|
|
RODA INTERNATIONAL HELLAS LTD |
|
Indef. |
TRADE REG. |
31/12/2001 |
|
BUSINESS NAME |
CIF / COUNTRY |
% |
SOURCE |
DATE REP. |
|
|
B96597034 |
100,00 |
TRADE REG. |
31/12/2008 |
|
RODA TOURS SA |
A35212513 |
Indef. |
TRADE REG. |
28/02/1995 |
POTENTIAL LINKS
Search Criterion: "Wheel
International CANARIAS SL"
URL: www.conxemar.com
International Canary WHEELS,
S.L. - ASSOCIATION
CONXEMAR - HOLIDAYS
... Name: Wheel
International Canaries S.L.. Address: C
/ Nicolas Estevanez,
11-3 º B. E-mail: afernandez@rodaint.com.
Phone: 928-220662. Fax: 928-221674
URL: www.boe.es
Acts of Las Palmas Borman number. 13, 2010 21 Jan 2010 ... 23312 - Calderara Y metal structure CANARY SL (RM Las Palmas). ... 23327 - Wheel International CANARY limited company (RM LAS ...
CREDIT INFORMATION
Incorporation date: 21/06/1989
Establishment date: 01/01/1989
Founder’s Name: LA TITULAR
NACE 2009 CODE: 4638
NACE 2009 Activity: Wholesale of other food, including fish,
crustaceans and molluscs
Business: Import and
export of all kinds of goods. The company's
main activity is the
wholesale trade of fish.
Latest employees figure: 7 (2011)
% of fixed employees: 100,00%
% of men: 66,67%
% of women: 33,33%
Employees evolution
|
|
|
|
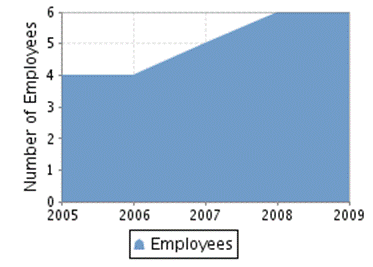
Source: Annual financial report 2009
|
CATEGORY |
AVERAGE NUMBER OF EMPLOYEES |
MEN |
WOMEN |
|
Distribution by sexes |
|
4 |
2 |
SALES
Export Percentage: 51%
Exports to: UNION EUROPEA Y RESTO
National Distribution: 49%
CLIENTS
|
BUSINESS NAME |
INTERNATIONAL |
|
|
YES |
|
NETO MELINDA
TRADING LTD |
YES |
Professional and advertising services ![]()
Source: Annual financial report 2009
Professional services
expenses: 41.849,01 €
Advertising services expenses: 35.027,37 €
|
ENTITY |
BRANCH |
ADDRESS |
TOWN OR CITY |
PROVINCE |
|
BANCO BILBAO VIZCAYA ARGENTARIA, S.A. |
|
|
PALMAS DE GRAN CANARIA (LAS) |
|
|
BANCO SANTANDER, S.A. |
1848 |
JOSE FRANCHY |
PALMAS DE GRAN CANARIA (LAS) |
Palmas (Las) |
|
DEUTSCHE BANK, S.A.E. |
|
|
PALMAS DE GRAN CANARIA (LAS) |
|
FORMER NAMES:
•
RODA INTERNACIONAL CANARIAS SA
Brand name: PESCASOL (Valid)
Type: DENOMINATIVE Scope: NATIONAL
Date: 17/03/1997
Name: RODA INTERNACIONAL (Valid)
Type: JOINT Scope: NATIONAL Date: 28/12/2001
LEGAL STRUCTURE
Constitution Data
Register Date: 21/06/1989
Legal form: Sole-partnered Limited Liability Company
Social Capital: 300.024,00 €
Obligation to fill in Financial Statements: YES
Chamber census: YES (2009)
B.O.R.M.E. (OFFICIAL COMPANIES REGISTRY GAZETTE) ![]()
Acts on activity: 0
Acts on administrators: 16 (Last: 09/02/2011, first:
25/03/1993)
Acts on capital: 5 (Last: 30/12/2004, first:
25/03/1993)
Acts on creation: 0
Acts on filed accounts: 20 (Last: 22/09/2010, first:
11/10/1991)
Acts on identification: 1 (Last: 25/03/1993)
Latest acts in B.O.R.M.E.
Other acts
|
ACT |
DATE |
NOTICE NUM. |
TRADE REGISTER |
|
Re-elections |
09/02/2011 |
56929 |
Palmas (Las) |
|
Appointments |
24/11/2010 |
434066 |
Palmas (Las) |
|
Appointments |
21/01/2010 |
23329 |
Palmas (Las) |
|
Appointments |
21/01/2010 |
23328 |
Palmas (Las) |
|
Modification of the Articles of Association |
21/01/2010 |
23327 |
Palmas (Las) |
|
Appointments |
21/01/2010 |
23327 |
Palmas (Las) |
|
Resignations |
21/01/2010 |
23327 |
Palmas (Las) |
|
Appointments |
25/02/2009 |
99548 |
Palmas (Las) |
Latest filed accounts
|
ACT |
DATE |
NOTICE NUM. |
TRADE REGISTER |
|
Annual Filed Accounts (2009) |
22/09/2010 |
646167 |
Palmas (Las) |
|
Annual Filed Accounts (2008) |
21/10/2009 |
702442 |
Palmas (Las) |
|
Annual Filed Accounts (2007) |
01/12/2008 |
1161308 |
Palmas (Las) |
Press articles
No press articles
Complementary Information
Financial Information
Deposit accounts in the
year 2004 has
been detected out of position
on the following items:
The result of the closed Liabilities Balance at
31/12/2004 does not match the
text in the profit and loss
account.
FINANCIAL INFORMATION
The information on the last account contained in this report is
extracted from the Mercantile Register file of the legal address of the Company
and dated 03/11/2010.
The shaded amounts in the following financial statements have been converted to the norms established in the PGC2007 derived from RD 1514/2007 and 1515/2007, this way comparatives could be shown with the amounts of exercises initiated from 1/01/08.
This theoretical conversion exercise has been carried out from the financial statements contained in the accounting information presented on the Trade Register, and elaborated under the accounting norms and principles collected in PGC90 derived from RD 1643/1990, not taking into account any other type of information; for this reason the conversion exercise could include certain inaccuracies.
SITUATION BALANCE-SHEET
Assets
Figures given in €
|
|
31/12/2009 (12) |
% ASSETS |
31/12/2008 (12) |
% ASSETS |
31/12/2007 (12) |
% ASSETS |
|
A) NON CURRENT ASSETS |
78.806,32 |
2,04 |
24.954,10 |
0,42 |
270.800,27 |
4,66 |
|
I. Intangible assets |
1.335,84 |
0,03 |
1.751,27 |
0,03 |
534,28 |
0,01 |
|
3. Patents, licences , trademarks and similars |
129,22 |
0,00 |
260,75 |
0,00 |
|
|
|
5. Software |
1.206,62 |
0,03 |
1.490,52 |
0,03 |
|
|
|
II. Tangible fixed assets |
5.191,47 |
0,13 |
6.276,01 |
0,11 |
5.079,18 |
0,09 |
|
2. Technical fittings and other tangible assets |
5.191,47 |
0,13 |
6.276,01 |
0,11 |
|
|
|
III. Real-estate investments |
|
|
|
|
|
|
|
IV. Long term investments in associated and affiliated companies |
|
|
|
|
265.186,81 |
4,57 |
|
V. Long Term Financial Investments |
72.279,01 |
1,87 |
16.926,82 |
0,29 |
|
|
|
1. Net worth instruments |
16.402,61 |
0,42 |
15.550,42 |
0,26 |
|
|
|
5. Other financial assets |
55.876,40 |
1,44 |
1.376,40 |
0,02 |
|
|
|
VI. Assets by deferred taxes |
|
|
|
|
|
|
|
VII. Non current commercial debts |
|
|
|
|
|
|
|
B) CURRENT ASSETS |
3.788.719,15 |
97,96 |
5.909.342,81 |
99,58 |
5.534.674,94 |
95,34 |
|
I. Non-current assets maintained for sale |
|
|
|
|
|
|
|
II. Stocks |
1.215.761,98 |
31,44 |
1.970.447,65 |
33,20 |
2.768.698,50 |
47,69 |
|
1. Goods available for sale |
627.228,28 |
16,22 |
1.265.495,82 |
21,33 |
|
|
|
3. Work in Progress |
588.533,70 |
15,22 |
673.036,93 |
11,34 |
|
|
|
b) Short production cycle |
588.533,70 |
15,22 |
673.036,93 |
11,34 |
|
|
|
6. Pre-payments to suppliers |
|
|
31.914,90 |
0,54 |
|
|
|
III. Trade Debtors and other receivable accounts |
2.243.925,71 |
58,02 |
2.993.007,34 |
50,44 |
|
|
|
1. Clients |
2.052.001,81 |
53,06 |
2.771.789,96 |
46,71 |
|
|
|
b) Clients for sales and short term services
rendering |
2.052.001,81 |
53,06 |
2.771.789,96 |
46,71 |
|
|
|
2. Clients group and associated companies |
1.396,00 |
0,04 |
|
|
|
|
|
3. Other debts |
56.342,29 |
1,46 |
77.519,39 |
1,31 |
|
|
|
4. Staff |
14.303,29 |
0,37 |
8.912,55 |
0,15 |
|
|
|
5. Assets by current taxes |
733,97 |
0,02 |
4.084,96 |
0,07 |
|
|
|
6. Other credits with the Public Administrations |
119.148,35 |
3,08 |
130.700,48 |
2,20 |
|
|
|
IV. Short term investments in associated and affiliated companies |
|
|
|
|
|
|
|
V. Short term financial investments |
|
|
|
|
|
|
|
VI. Short term periodifications |
|
|
|
|
|
|
|
VII. Cash and equivalents |
329.031,46 |
8,51 |
945.887,82 |
15,94 |
786.319,33 |
13,54 |
|
1. Treasury |
329.031,46 |
8,51 |
945.887,82 |
15,94 |
|
|
|
TOTAL ASSETS (A + B) |
3.867.525,47 |
100,00 |
5.934.296,91 |
100,00 |
5.805.475,21 |
100,00 |
Net Worth and Liabilities
Figures given in €
|
|
31/12/2009 (12) |
% ASSETS |
31/12/2008 (12) |
% ASSETS |
31/12/2007 (12) |
% ASSETS |
|
A) NET WORTH |
867.723,44 |
22,44 |
832.454,26 |
14,03 |
796.346,80 |
13,72 |
|
A-1) Equity |
867.723,44 |
22,44 |
832.454,26 |
14,03 |
782.865,02 |
13,48 |
|
I. Capital |
300.024,00 |
7,76 |
300.024,00 |
5,06 |
300.024,00 |
5,17 |
|
1. Authorized capital |
300.024,00 |
7,76 |
300.024,00 |
5,06 |
300.024,00 |
5,17 |
|
II. Issue premium |
|
|
|
|
|
|
|
III. Reserves |
532.430,26 |
13,77 |
495.841,30 |
8,36 |
401.863,42 |
6,92 |
|
1. Legal and statutory |
44.823,79 |
1,16 |
41.164,89 |
0,69 |
|
|
|
2. Other funds |
487.606,47 |
12,61 |
454.676,41 |
7,66 |
|
|
|
IV. (Net worth own shares and participations) |
|
|
|
|
|
|
|
V. Results from previous years |
|
|
|
|
|
|
|
VI. Other loans from partners |
|
|
|
|
|
|
|
VII. Exercise Result |
35.269,18 |
0,91 |
36.588,96 |
0,62 |
80.977,60 |
1,39 |
|
VIII. (Interim dividend) |
|
|
|
|
|
|
|
IX. Other net worth instruments |
|
|
|
|
|
|
|
A-2) Value changes adjustments |
|
|
|
|
|
|
|
I. Financial assets available for sale |
|
|
|
|
|
|
|
II. Coverage operations |
|
|
|
|
|
|
|
III. Non-current assets and related liabilities, maintained for sale |
|
|
|
|
|
|
|
IV. Conversion differences |
|
|
|
|
|
|
|
V. Other |
|
|
|
|
|
|
|
A-3) Received legacies, grants and subventions |
|
|
|
|
13.481,78 |
0,23 |
|
B) NON CURRENT LIABILITIES |
1.000.000,00 |
25,86 |
762.411,35 |
12,85 |
2.294.227,90 |
39,52 |
|
I. Long term provisions |
|
|
|
|
|
|
|
II. Long term debts |
|
|
|
|
|
|
|
III. Long term debts with associated and affiliated companies |
1.000.000,00 |
25,86 |
762.411,35 |
12,85 |
|
|
|
IV. Liabilities by deferred taxes |
|
|
|
|
|
|
|
V. Long term periodifications |
|
|
|
|
|
|
|
VI. Non current trade creditors |
|
|
|
|
|
|
|
VII. Long term debts with special characteristics |
|
|
|
|
|
|
|
C) CURRENT LIABILITIES |
1.999.802,03 |
51,71 |
4.339.431,30 |
73,12 |
2.714.900,51 |
46,76 |
|
I. Liabilities related with non-current assets maintained for sale |
|
|
|
|
|
|
|
II. Short term provisions |
|
|
|
|
|
|
|
III. Short term debts |
712.795,23 |
18,43 |
352.347,06 |
5,94 |
|
|
|
2. Debts with bank entities |
711.550,10 |
18,40 |
352.347,06 |
5,94 |
|
|
|
4. By-products |
1.245,13 |
0,03 |
|
|
|
|
|
IV. Short term debts with associated and affiliated companies |
|
|
2.058.402,39 |
34,69 |
|
|
|
V. Trade creditors and other payable accounts |
1.287.006,80 |
33,28 |
1.928.681,85 |
32,50 |
|
|
|
1. Suppliers |
1.198.711,51 |
30,99 |
1.824.993,31 |
30,75 |
|
|
|
b) Short term suppliers |
1.198.711,51 |
30,99 |
1.824.993,31 |
30,75 |
|
|
|
3. Different creditors |
54.196,90 |
1,40 |
63.995,01 |
1,08 |
|
|
|
4. Staff (pending remunerations) |
7.325,03 |
0,19 |
11.017,80 |
0,19 |
|
|
|
6. Other debts with Public Administrations |
26.773,36 |
0,69 |
28.675,73 |
0,48 |
|
|
|
VI. Short term periodifications |
|
|
|
|
|
|
|
VII. Short term debts with special characteristics |
|
|
|
|
|
|
|
TOTAL NET WORTH AND LIABILITIES (A + B + C) |
3.867.525,47 |
100,00 |
5.934.296,91 |
100,00 |
5.805.475,21 |
100,00 |
Alerts associated to the conversion to PGC2007
![]() The Valuation norms applicable to “Subventions”
have changed substantially and, for this reason, the conversion of financial
statements of the formulation exercise of the accounts to PGC2007 could include
notable inaccuracies
The Valuation norms applicable to “Subventions”
have changed substantially and, for this reason, the conversion of financial
statements of the formulation exercise of the accounts to PGC2007 could include
notable inaccuracies
![]() The Valuation norms applicable to “Long
Term Creditors” have changed substantially and, for this reason, the conversion
of financial statements of the formulation exercise of the accounts to PGC2007
could include notable inaccuracies.
The Valuation norms applicable to “Long
Term Creditors” have changed substantially and, for this reason, the conversion
of financial statements of the formulation exercise of the accounts to PGC2007
could include notable inaccuracies.
![]() The Valuation norms applicable
to “Short Term Creditors” have changed and, for this reason, the conversion of
financial statements of the formulation exercise of the accounts to PGC2007
could include notable inaccuracies.
The Valuation norms applicable
to “Short Term Creditors” have changed and, for this reason, the conversion of
financial statements of the formulation exercise of the accounts to PGC2007
could include notable inaccuracies.
PROFIT AND LOSS ACCOUNT
Figures given in €
|
|
31/12/2009 (12) |
%OPERATING INCOME |
31/12/2008 (12) |
%OPERATING INCOME |
31/12/2007 (12) |
%OPERATING INCOME |
|
A) CONTINUED OPERATIONS |
|
|
|
|
|
|
|
1. Net Turnover |
13.373.734,65 |
99,85 |
11.020.176,16 |
99,40 |
9.951.671,02 |
99,86 |
|
A) Sales |
13.373.734,65 |
99,85 |
11.020.176,16 |
99,40 |
|
|
|
2. Variation in stocks of finished goods and work in progress |
|
|
|
|
|
|
|
3. Works for its own assets |
|
|
|
|
|
|
|
4. Supplies |
-12.115.928,83 |
-90,46 |
-10.075.733,75 |
-90,88 |
-9.044.941,11 |
-90,77 |
|
a) Material consumed |
-11.648.931,72 |
-86,97 |
-10.005.683,57 |
-90,25 |
|
|
|
c) Works carried out for other companies |
-494.032,29 |
-3,69 |
-43.015,00 |
-0,39 |
|
|
|
d) Deterioration on merchandises, raw materials and other supplies |
27.035,18 |
0,20 |
-27.035,18 |
-0,24 |
|
|
|
5. Other operating income |
20.221,00 |
0,15 |
66.146,00 |
0,60 |
13.486,75 |
0,14 |
|
a) Other incomes |
20.221,00 |
0,15 |
66.146,00 |
0,60 |
|
|
|
6. Labour cost |
-317.199,22 |
-2,37 |
-317.536,62 |
-2,86 |
-195.087,62 |
-1,96 |
|
a) Wages and similar expenses |
-261.770,30 |
-1,95 |
-258.852,45 |
-2,33 |
|
|
|
b) Social costs |
-55.428,92 |
-0,41 |
-58.684,17 |
-0,53 |
|
|
|
7. Other operating costs |
-692.697,61 |
-5,17 |
-806.349,03 |
-7,27 |
-482.771,84 |
-4,84 |
|
a) External services |
-619.210,97 |
-4,62 |
-706.093,39 |
-6,37 |
|
|
|
b) Taxes |
-2.352,10 |
-0,02 |
-2.012,36 |
-0,02 |
|
|
|
c) Losses, deterioration and variation on business operations
provisions |
-71.134,54 |
-0,53 |
-98.243,28 |
-0,89 |
|
|
|
8. Amortization of fixed assets |
-2.614,81 |
-0,02 |
-3.020,14 |
-0,03 |
-3.715,94 |
-0,04 |
|
9. Allocation of subventions on non financial investments and other |
|
|
|
|
|
|
|
10. Provisions excess |
|
|
|
|
|
|
|
11. Deterioration and result for fixed assets disposal |
|
|
|
|
|
|
|
12. Negative difference of business combinations |
|
|
|
|
|
|
|
13. Other results |
|
|
|
|
|
|
|
A.1) OPERATING RESULT (1 + 2 + 3 + 4 + 5 + 6 + 7 + 8 + 9 + 10 + 11 + 12
+ 13) |
265.515,18 |
1,98 |
-116.317,38 |
-1,05 |
238.641,26 |
2,39 |
|
14. Financial income |
4.792,85 |
0,04 |
4.581,29 |
0,04 |
2.439,02 |
0,02 |
|
b) From negotiable values and other financial instruments |
4.792,85 |
0,04 |
4.581,29 |
0,04 |
|
|
|
b 2) From third parties |
4.792,85 |
0,04 |
4.581,29 |
0,04 |
|
|
|
15. Financial expenses |
-88.009,12 |
-0,66 |
-96.915,02 |
-0,87 |
-59.028,94 |
-0,59 |
|
a) For debts with associated and affiliated companies |
-68.599,71 |
-0,51 |
-84.678,20 |
-0,76 |
|
|
|
b) For debts with third parties |
-19.409,41 |
-0,14 |
-12.236,82 |
-0,11 |
|
|
|
16. Reasonable value variation on financial instruments |
-1.245,13 |
-0,01 |
|
|
|
|
|
a) Negotiation portfolio and others |
-1.245,13 |
-0,01 |
|
|
|
|
|
17. Exchange differences |
-130.943,66 |
-0,98 |
259.028,67 |
2,34 |
-62.031,31 |
-0,62 |
|
18. Deterioration and result for disposal of financial instruments |
|
|
|
|
|
|
|
19. Other financial income and expenses |
|
|
|
|
|
|
|
A.2) FINANCIAL RESULT (14 + 15 + 16 + 17 + 18 + 19) |
-215.405,06 |
-1,61 |
166.694,94 |
1,50 |
-118.621,23 |
-1,19 |
|
A.3) RESULT BEFORE TAXES (A.1 + A.2) |
50.110,12 |
0,37 |
50.377,56 |
0,45 |
120.020,03 |
1,20 |
|
20. Taxes on profits |
-14.840,94 |
-0,11 |
-13.788,60 |
-0,12 |
-39.042,43 |
-0,39 |
|
A.4) EXERCISE RESULT COMING FROM CONTINUED OPERATIONS (A.3 + 20) |
35.269,18 |
0,26 |
36.588,96 |
0,33 |
|
|
|
B) DISCONTINUED OPERATIONS |
|
|
|
|
|
|
|
21. Net of taxes exercise result coming from discontinued operations |
|
|
|
|
|
|
|
A.5) EXERCISE RESULT (A.4 + 21) |
35.269,18 |
0,26 |
36.588,96 |
0,33 |
80.977,60 |
0,81 |
NET WORTH CHANGES
STATUS
Status of recognized income and expenses
Figures given in €
|
NET WORTH CHANGES (1/2) |
31/12/2009 (12) |
31/12/2008 (12) |
|
A) PROFIT AND LOSS ACCOUNT RESULT |
35.269,18 |
36.588,96 |
|
INCOME AND EXPENSES ALLOCATED DIRECTLY TO NET WORTH |
|
|
|
|
|
|
|
II. Cash flow coverage |
|
|
|
III. Received legacies, grants and subventions |
|
|
|
IV. For actuarial profits and losses and other adjustments |
|
|
|
V. Non-current assets and related liabilities, maintained for sale |
|
|
|
VI. Conversion differences |
|
|
|
VII. Tax effect |
|
|
|
B) TOTAL INCOME AND EXPENSES ALLOCATED DIRECTLY TO NET WORTH (I + II +
III + IV +V+VI+VII) |
|
|
|
PROFIT AND LOSS ACCOUNT TRANSFERS |
|
|
|
VIII. For valuation of financial instruments |
|
|
|
IX. Cash flow coverage |
|
|
|
X. Received legacies, grants and subventions |
|
|
|
XI. Non-current assets and related liabilities, maintained for sale |
|
|
|
XII. Conversion differences |
|
|
|
XIII. Tax effect |
|
|
|
C) TOTAL TRANSFERS TO THE PROFIT AND LOSS ACCOUNT (VIII + IX + X + XI+
XII+ XIII) |
|
|
|
TOTAL INCOME AND EXPENSES RECOGNIZED (A + B + C) |
35.269,18 |
36.588,96 |
Total net worth changes status
Figures given in €
|
NET WORTH CHANGES ( 2 /2) |
AUTHORIZED CAPITAL |
RESERVES |
EXERCISE RESULT |
TOTAL |
|
FINAL ACCOUNT BALANCE OF EXERCISE (2007) |
300.024,00 |
401.863,42 |
80.977,60 |
782.865,02 |
|
I. Adjustments by change of criteria in the exercise (2007) |
|
13.000,28 |
|
13.000,28 |
|
II. Adjustments by errors in the exercise (2007) |
|
|
|
|
|
ADJUSTED ACCOUNT BALANCE, BEGINNING OF EXERCISE (2008) |
300.024,00 |
414.863,70 |
80.977,60 |
795.865,30 |
|
I. Total recognized income and expenses |
|
|
36.588,96 |
36.588,96 |
|
II. Operations with partners or owners |
|
80.977,60 |
-80.977,60 |
|
|
5. Operations with own participations or shares (net) |
|
80.977,60 |
|
80.977,60 |
|
7. Other operations with partners or owners |
|
|
-80.977,60 |
-80.977,60 |
|
III. Other net worth variations |
|
|
|
|
|
FINAL ACCOUNT BALANCE OF EXERCISE (2008) |
300.024,00 |
495.841,30 |
36.588,96 |
832.454,26 |
|
I. Adjustments by change of criteria in the exercise (2008) |
|
|
|
|
|
II. Adjustments by errors in the exercise (2008) |
|
|
|
|
|
ADJUSTED ACCOUNT BALANCE, BEGINNING OF EXERCISE (2009) |
300.024,00 |
495.841,30 |
36.588,96 |
832.454,26 |
|
I. Total recognized income and expenses |
|
|
35.269,18 |
35.269,18 |
|
II. Operations with partners or owners |
|
|
|
|
|
III. Other net worth variations |
|
36.588,96 |
-36.588,96 |
|
|
FINAL ACCOUNT BALANCE OF EXERCISE (2009) |
300.024,00 |
532.430,26 |
35.269,18 |
867.723,44 |
CASH FLOW STATUS
Figures given in €
|
|
31/12/2009 (12) |
31/12/2008 (12) |
|
A) CASH FLOW COMING FROM OPERATING ACTIVITIES |
|
|
|
1. exercise result before taxes |
50.110,12 |
50.377,56 |
|
2. Results adjustments |
156.591,69 |
255.492,19 |
|
a) Amortization of fixed assets (+) |
2.614,81 |
3.020,14 |
|
b) Value correction for deterioration (+/-) |
-27.035,18 |
27.035,18 |
|
c) Change of Provisions (+/-) |
71.134,54 |
98.243,28 |
|
f) Financial expenses (+) |
38.646,16 |
|
|
i) Change difference (+/-) |
69.986,23 |
120.226,01 |
|
k) Other income and expenses (-/+) |
1.245,13 |
6.967,58 |
|
3. Changes in current capital |
1.162.354,99 |
336.180,01 |
|
a) Stocks (+/-) |
749.805,95 |
469.504,27 |
|
b) Debtors and other receivable accounts (+/-) |
668.434,71 |
-1.180.054,95 |
|
c) Other current assets (+/-) |
-5.328,56 |
-65.720,08 |
|
d) Creditors and other payable accounts (+/-) |
-604.165,01 |
1.112.739,69 |
|
e) Other current liabilities (+/-) |
353.607,90 |
-288,92 |
|
4. Other cash flow coming from operating activities |
|
|
|
5. Cash flow coming from operating activities (1 + 2 + 3 + 4) |
1.369.056,80 |
642.049,76 |
|
B) CASH FLOW COMING FROM INVESTING ACTIVITIES |
|
|
|
6. Investment payments (-) |
-56.467,03 |
-5.433,96 |
|
b) Intangible assets |
|
-1.419,50 |
|
c) Tangible assets |
-1.114,84 |
-4.014,46 |
|
e) Other financial assets |
-55.352,19 |
|
|
7. Disinvestment collections (+) |
|
103.384,32 |
|
a) Group and associated companies |
|
87.406,01 |
|
e) Other financial assets |
|
15.978,31 |
|
8. Cash Flow in investment activities (6 + 7) |
-56.467,03 |
97.950,36 |
|
C) CASH FLOW COMING FROM FINANCING ACTIVITIES |
|
|
|
9. Net worth instruments collections and payments |
|
|
|
10. Financial liabilities instruments collections and payments |
-1.929.446,13 |
-580.431,63 |
|
b) Return and amortization of |
-1.929.446,13 |
-580.431,63 |
|
3. Debts with group and associated companies (-) |
-1.929.446,13 |
-580.431,63 |
|
11. Payments for dividends and remunerations of other net worth
instruments |
|
|
|
12. Cash Flow in financing activities (9 + 10 + 11) |
-1.929.446,13 |
-580.431,63 |
|
D) Exchange rate variations effect |
|
|
|
E) NET CASH OR EQUIVALENTS INCREASE / REDUCTION (5 + 8 + 12 + D) |
-616.856,36 |
159.568,49 |
|
Cash or equivalents at the beginning of the exercise |
945.887,82 |
786.319,33 |
|
Cash or equivalents at the end of the exercise |
329.031,46 |
945.887,82 |
RATIOS
|
|
31/12/2009 (12) |
CHANGE % |
31/12/2008 (12) |
CHANGE % |
31/12/2007 (12) |
|
BALANCE RATIOS |
|||||
|
Working Capital (€) |
1.788.917,12 |
13,95 |
1.569.911,51 |
-44,32 |
2.819.774,43 |
|
Working capital ratio |
0,46 |
70,37 |
0,26 |
-44,90 |
0,49 |
|
Soundness Ratio |
11,01 |
-67,00 |
33,36 |
1.054,33 |
2,89 |
|
Average Collection Period (days) |
60 |
-38,24 |
98 |
36,68 |
72 |
|
Average Payment Period (days) |
36 |
-72,68 |
132 |
|
|
|
LIQUIDITY RATIOS |
|||||
|
Current Ratio (%) |
189,46 |
39,12 |
136,18 |
-33,20 |
203,86 |
|
Quick Ratio (%) |
16,45 |
-24,54 |
21,80 |
-24,72 |
28,96 |
|
DEBT RATIOS |
|||||
|
Borrowing percentage (%) |
44,29 |
-17,17 |
53,47 |
|
|
|
External Financing Average Cost |
0,05 |
66,67 |
0,03 |
|
|
|
Debt Service Coverage |
1,25 |
-74,70 |
4,94 |
|
|
|
Interest Coverage |
3,02 |
351,67 |
-1,20 |
-129,70 |
4,04 |
|
GENERAL AND ACTIVITIES RATIOS |
|||||
|
Auto financing generated by sales (%) |
10,24 |
75,64 |
5,83 |
585,88 |
0,85 |
|
Auto financing generated by Assets (%) |
35,40 |
227,17 |
10,82 |
641,10 |
1,46 |
|
Breakdown Point |
1,02 |
3,03 |
0,99 |
-2,94 |
1,02 |
|
Average Sales Volume per Employee |
2.228.955,77 |
21,36 |
1.836.696,03 |
-7,72 |
1.990.334,20 |
|
Average Cost per Employee |
52.866,54 |
-0,11 |
52.922,77 |
35,64 |
39.017,52 |
|
Assets Turnover |
3,46 |
86,02 |
1,86 |
8,77 |
1,71 |
|
Inventory Turnover (days) |
36 |
-48,98 |
71 |
-35,95 |
110 |
|
RESULTS RATIOS |
|||||
|
Return on Assets (ROA) (%) |
6,86 |
450,51 |
-1,96 |
-147,69 |
4,11 |
|
Operating Profitability (%) |
6,93 |
462,83 |
-1,91 |
-145,69 |
4,18 |
|
Return on Equity (ROE) (%) |
5,78 |
-4,46 |
6,05 |
-60,53 |
15,33 |
SECTORIAL ANALYSIS
Balance Sheet and Financial Balance
Figures expressed in %
|
|
COMPANY (2009) |
SECTOR |
DIFFERENCE |
|
BALANCE SHEET ANALYSIS: % on the total
assets |
|
|
|
|
ASSETS |
|||
|
A) NON CURRENT ASSETS |
2,04 |
31,46 |
-29,42 |
|
A) CURRENT ASSETS |
97,96 |
68,54 |
29,42 |
|
LIABILITIES |
|||
|
A) NET WORTH |
22,44 |
36,10 |
-13,66 |
|
B) NON CURRENT LIABILITIES |
25,86 |
10,39 |
15,47 |
|
C) CURRENT LIABILITIES |
51,71 |
53,51 |
-1,81 |
|
|
|
|
|
Analytical Account of Results
Figures given in %
|
|
COMPANY (2009) |
SECTOR |
DIFFERENCE |
|
Net Turnover |
99,85 |
99,11 |
0,74 |
|
Other operating income |
0,15 |
0,89 |
-0,74 |
|
OPERATING INCOME |
100,00 |
100,00 |
0,00 |
|
Supplies |
-90,46 |
-83,47 |
-6,99 |
|
Variation in stocks of finished goods and work in progress |
|
-0,09 |
|
|
GROSS MARGIN |
9,54 |
16,43 |
-6,89 |
|
Other operating costs |
-5,17 |
-7,34 |
2,17 |
|
Labour cost |
-2,37 |
-5,56 |
3,19 |
|
GROSS OPERATING RESULT |
2,00 |
3,53 |
-1,53 |
|
Amortization of fixed assets |
-0,02 |
-1,15 |
1,13 |
|
Deterioration and result for fixed assets disposal |
|
0,10 |
|
|
NET OPERATING RESULT |
1,98 |
2,48 |
-0,50 |
|
Financial result |
-1,61 |
-0,48 |
-1,13 |
|
RESULT BEFORE TAX |
0,37 |
2,00 |
-1,63 |
|
Taxes on profits |
-0,11 |
-0,59 |
0,48 |
|
RESULT COMING FROM CONTINUED OPERATIONS |
0,26 |
|
|
|
NET RESULT |
0,26 |
1,40 |
-1,14 |
Main Ratios
|
|
COMPANY (2009) |
PTILE25 |
PTILE50 |
PTILE75 |
|
BALANCE RATIOS |
|
|
|
|
|
Working Capital (€) |
1.788.917,12 |
147.522,99 |
508.222,96 |
1.360.630,96 |
|
Working capital ratio |
0,46 |
0,03 |
0,12 |
0,25 |
|
Soundness Ratio |
11,01 |
0,64 |
1,23 |
2,56 |
|
Average Collection Period (days) |
60 |
39 |
60 |
90 |
|
Average Payment Period (days) |
36 |
0 |
32 |
66 |
|
LIQUIDITY RATIOS |
|
|
|
|
|
Current Ratio (%) |
189,46 |
1,05 |
1,19 |
1,50 |
|
Quick Ratio (%) |
16,45 |
0,04 |
0,11 |
0,33 |
|
DEBT RATIOS |
|
|
|
|
|
Borrowing percentage (%) |
44,29 |
0,00 |
9,61 |
36,59 |
|
External Financing Average Cost |
0,05 |
0,04 |
0,06 |
0,08 |
|
Debt Service Coverage |
1,25 |
0,00 |
1,03 |
8,34 |
|
Interest Coverage |
3,02 |
1,42 |
2,65 |
7,27 |
|
GENERAL AND ACTIVITIES RATIOS |
|
|
|
|
|
Auto financing generated by sales (%) |
10,24 |
0,92 |
1,77 |
3,30 |
|
Auto financing generated by Assets (%) |
35,40 |
2,67 |
4,58 |
7,24 |
|
Breakdown Point |
1,02 |
1,01 |
1,02 |
1,03 |
|
Average Sales Volume per Employee |
2.228.955,77 |
322.640,81 |
564.106,61 |
963.632,94 |
|
Average Cost per Employee |
52.866,54 |
22.831,20 |
27.611,31 |
34.751,12 |
|
Assets Turnover |
3,46 |
1,60 |
2,42 |
3,51 |
|
Inventory Turnover (days) |
36 |
7 |
33 |
59 |
|
RESULTS RATIOS |
|
|
|
|
|
Return on Assets (ROA) (%) |
6,86 |
2,40 |
4,20 |
6,41 |
|
Operating Profitability (%) |
6,93 |
4,37 |
6,31 |
10,29 |
|
Return on Equity (ROE) (%) |
5,78 |
5,75 |
13,61 |
24,30 |
FOREIGN EXCHANGE RATES
|
Currency |
Unit
|
Indian Rupees |
|
US Dollar |
1 |
Rs.44.96 |
|
|
1 |
Rs.73.56 |
|
Euro |
1 |
Rs.63.68 |
RATING EXPLANATIONS
|
RATING |
STATUS |
PROPOSED CREDIT LINE |
|
|
>86 |
Aaa |
Possesses an extremely sound financial base with the strongest capability
for timely payment of interest and principal sums |
Unlimited |
|
71-85 |
Aa |
Possesses adequate working capital. No caution needed for credit
transaction. It has above average (strong) capability for payment of interest
and principal sums |
Large |
|
56-70 |
A |
Financial & operational base are regarded healthy. General
unfavourable factors will not cause fatal effect. Satisfactory capability for
payment of interest and principal sums |
Fairly Large |
|
41-55 |
Ba |
Overall operation is considered normal. Capable to meet normal
commitments. |
Satisfactory |
|
26-40 |
B |
Capability to overcome financial difficulties seems comparatively
below average. |
Small |
|
11-25 |
Ca |
Adverse factors are apparent. Repayment of interest and principal sums
in default or expected to be in default upon maturity |
Limited with
full security |
|
<10 |
C |
Absolute credit risk exists. Caution needed to be exercised |
Credit not
recommended |
|
-- |
NB |
New Business |
-- |
This score serves as a reference to assess SC’s credit risk
and to set the amount of credit to be extended. It is calculated from a composite
of weighted scores obtained from each of the major sections of this report. The
assessed factors and their relative weights (as indicated through %) are as
follows:
Financial
condition (40%) Ownership
background (20%) Payment
record (10%)
Credit history
(10%) Market trend
(10%) Operational
size (10%)
This report is issued at your request without any
risk and responsibility on the part of MIRA INFORM PRIVATE LIMITED (MIPL)
or its officials.